Project 1 - Parsing NASA thermodynamic data
AIM
Write a program to parse NASA thermodynamic data file and calculate thermodynamic properties of different species.
OBJECTIVE
- Create a program to read NASA THERMODYNAMIC DATA (File).
- Extract the co efficient from the file.
- calculate Enthapy,Entropy,Specific Heat of all the species in the file.
- Calculate molecular weight of each species .
- Plot cp,Enthapy,Entropy graph.
- Save the plot of species in different folder with name of species.
THEORY
What is file parsing?
Using file parsing,data can be extracted from the file and can be used for process.Here we extract the data from NASA THERMODYNAMIC file for further calculation.
Specific Heat (cp)
Specific heat is the quantity of heat required to raise temperature of one gram by onecelsius degree.Unit is `J/K`.



Enthapy
Enthalpy is the sum of internal energy and pressure times volume. The unit is ``J``or `KJ`.

 |
= | enthalpy |
 |
= | internal energy |
 |
= | pressure |
 |
= | volume |
Entropy
Entropy is the measure of systems thermal energy per unit temperature that is unavailable for doing work.Unit of entropy is`JK−1mol−1`.
δs=Q/T
PROCEDURE
- Open 'THERMO' file and read the data and store it in variable file.
- Calculate the 14 coefficient of each species in given thermodynamic data .
- The string is converted to num.
- After finding the coefficient calculate Entropy,Enthapy,Specific heat of all species
- Taking gas constant as R=8.314 J/mol.and Taken 100 values of Temperature from 100 to 5000 .
- graph is plotted ;Temperatur vs enthapy, Temperature vs entropy Temperature vs specific Heat.
- The created plots of different species are saved in appropriate folder of species.
- A function named molecular_mass is created to calculate the molecular mass of each species.
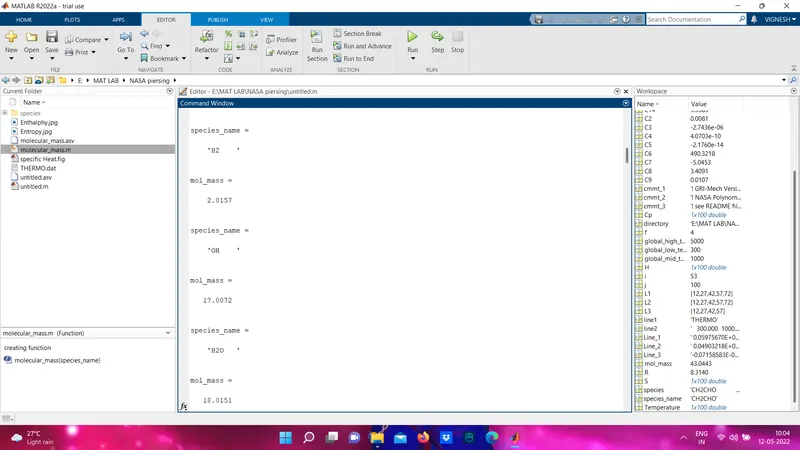
- The function is called to the mail function and runned.
SYNTAX USED
clear ; removes all variables from the current workspace, releasing them from system memory.
close all ; closes all figures, including figures with hidden handles.
clc ; clears all the text from the command window , resulting in a clear screen.
fopen(filename) ; opens the file, filename, for binary read access, and returns an integer file identifier equal to or greater than 3.
fgetl(obj) ; reads one line of text from the instrument connected to obj, and returns the data to tline.
strsplit(str) ;splits str at whitespace into output. A whitespace character is equivalent to any sequence in the set
{' ','\f','\n','\r','\t','\v'}.
str2num(txt) ; converts a character array or string scalar to a numeric matrix. The input can include spaces, commas, and semicolons to indicate separate elements. If str2num cannot parse the input as numeric values, then it returns an empty matrix.
strfind(str,pat) ; searches str for occurrences of pat. The output, , indicates the starting index of each occurrence of pat in str. If pat is not found, then strfind returns an empty array, []. The strfind function executes a case-sensitive search.
for loop ; A for loop is a repetition control structure that allows you to efficiently write a loop that needs to execute a specific number of times.
cd within a function, the folder change persists after MATLAB finishes executing the function.saveas ; To save variables to file.
linspace(x1,x2,n) ; generates n points. The spacing between the points is (x2-x1)/(n-1)
PROGRAM
Main prrogram
clear
close all
clc


%fopen- opens file for reading and writing

f = fopen('THERMO.DAT','r')

%skipping the heading

%fgetl is used to read lines of file

line1 = fgetl(f);

%getting global temp values

line2 = fgetl(f)

%skipping comments

cmmt_1=fgetl(f);
cmmt_2=fgetl(f);
cmmt_3=fgetl(f);

%splitting the global temp with spaces

A = strsplit(line2,' ')

% changing string to number  for global temp

global_low_temp = str2num(A{2})
global_mid_temp = str2num(A{3})
global_high_temp = str2num(A{4})

%species information

for i = 1:53   %there are 53 species


species = fgetl(f);
species_name = species(1:6)

%taking values from first line

Line_1 = fgetl(f);

L1 = strfind(Line_1,'E');

C1 = str2num(Line_1(1:(L1(1)+3)));

C2 = str2num(Line_1((L1(1)+4):(L1(2)+3)));

C3 = str2num(Line_1((L1(2)+4):(L1(3)+3)));

C4 = str2num(Line_1((L1(3)+4):(L1(4)+3)));

C5 = str2num(Line_1((L1(4)+4):(L1(5)+3)));


%taking values from second line

Line_2 = fgetl(f);

L2 = strfind(Line_2,'E');

C6 = str2num(Line_2(1:(L2(1)+3)));

C7 = str2num(Line_2((L2(1)+4):(L2(2)+3)));

C8 = str2num(Line_2((L2(2)+4):(L2(3)+3)));

C9 = str2num(Line_2((L2(3)+4):(L2(4)+3)));

C10 = str2num(Line_2((L2(4)+4):(L2(5)+3)));


Line_3 = fgetl(f);

L3 = strfind(Line_3,'E');

C11 = str2num(Line_3(1:(L3(1)+3)));

C12 = str2num(Line_3((L3(1)+4):(L3(2)+3)));

C13 = str2num(Line_3((L3(2)+4):(L3(3)+3)));

C14 = str2num(Line_3((L3(3)+4):(L3(4)+3)));


%creating folder

mkdir(['E:\MAT LAB\NASA piersing\species\',species_name]);


%assuming temp range

Temperature = linspace(300,5000,100);

% inputing Universal constant

R = 8.314;


%calculation based on temp

for j = 1:length(Temperature)

    if Temperature(j)<3000

       Cp = (C1+C2.*Temperature+C3.*Temperature.^2+C4.*Temperature.^3+C5.*Temperature.^4).*R;
        H = (C1+(C2.*Temperature)./2+(C3.*Temperature.^2)/3+(C4.*Temperature.^3)/4+(C5.*Temperature.^4./5)+C6./Temperature).*Temperature.*R;
        S = (C1.*log(Temperature)+C2.*Temperature+(C3.*Temperature.^2)/2+(C4.*Temperature.^3)/3+(C5.*Temperature.^4)/4+C7).*R;

    else

        Cp = (C8+C9.*Temperature+C10.*Temperature.^2+C11.*Temperature.^3+C12.*Temperature.^4).*R;
        H = (C8+(C9.*Temperature)./2+(C10.*Temperature.^2)/3+(C11.*Temperature.^3)/4+(C12.*Temperature.^4./5)+C13./Temperature).*Temperature.*R;
       S = (C8.*log(Temperature)+C9.*Temperature+(C10.*Temperature.^2)/2+(C11.*Temperature.^3)/3+(C12.*Temperature.^4)/4+C14).*R;
    end
end

%plotting graph

figure(1)

plot(Temperature,S,'LineWidth',4,'Color','b')
title(species_name)
xlabel('Temperature')
ylabel('Entropy')


figure(2)

plot(Temperature,H,'LineWidth',4,'Color','r')
title(species_name)
xlabel('Temperature')
ylabel('Enthalpy')


figure(3)

plot(Temperature,Cp,'LineWidth',4,'Color','y')
title(species_name)
xlabel('Temperature')
ylabel('Specific heat')

%saving plots in species folder

directory = (['E:\MAT LAB\NASA piersing\species\',species_name]);
cd(directory)

saveas(1,'Entropy.jpg');
saveas(2,'Enthalphy.jpg');
saveas(3,'specific Heat','jpg');

cd('E:\MAT LAB\NASA piersing\')

%finding molecular mass of each species
%molecular_mass is function name

mol_mass = molecular_mass(species_name)

end
fclose(f)
Function program(molecular mass)
% creating function

function mol_mass = molecular_mass(species_name)

species = upper(species_name);

constituents = ['H','C','N','O','A'];

atomic_weight = [1.00784 12.0107 14.0067 15.9994 39.948];

mol_mass=0;

for i = 1:length(species)
 for   j= 1:length(constituents)

    if strcmp(species(i),constituents(j))
        mol_mass = mol_mass + atomic_weight(j);
        u = j;
    end
end

n = str2num(species(i));

if n>1

    mol_mass = mol_mass + atomic_weight(u)*(n-1);
end
end
end
OUTPUT
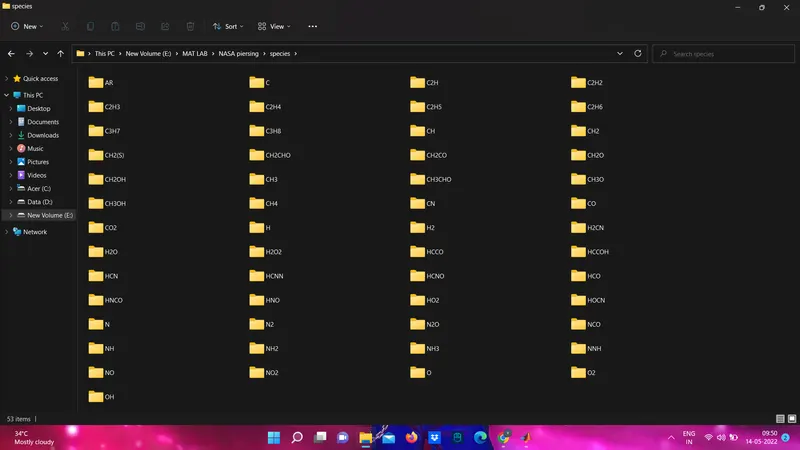
folder created for different species
PLOTS
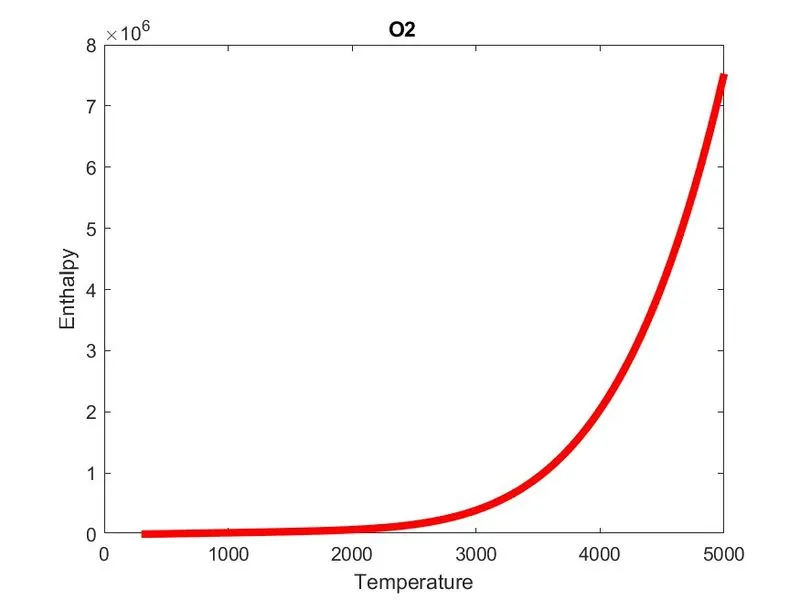
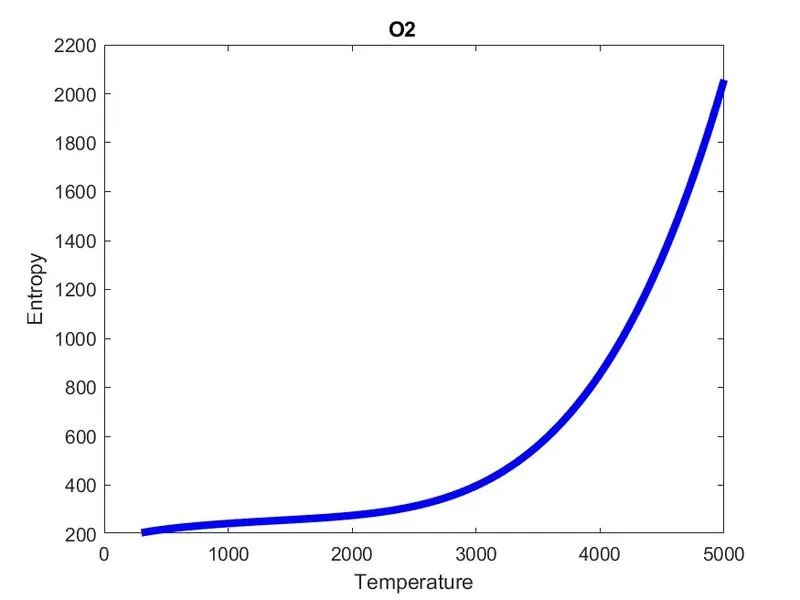
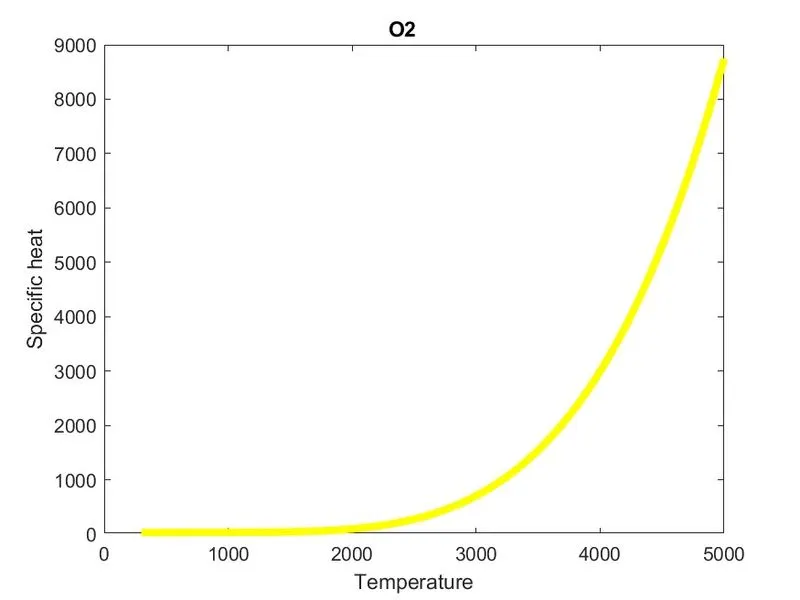
O2
Temperature VS Enthaphy
Temperature VS Entropy
Temperature VS Specific Heat
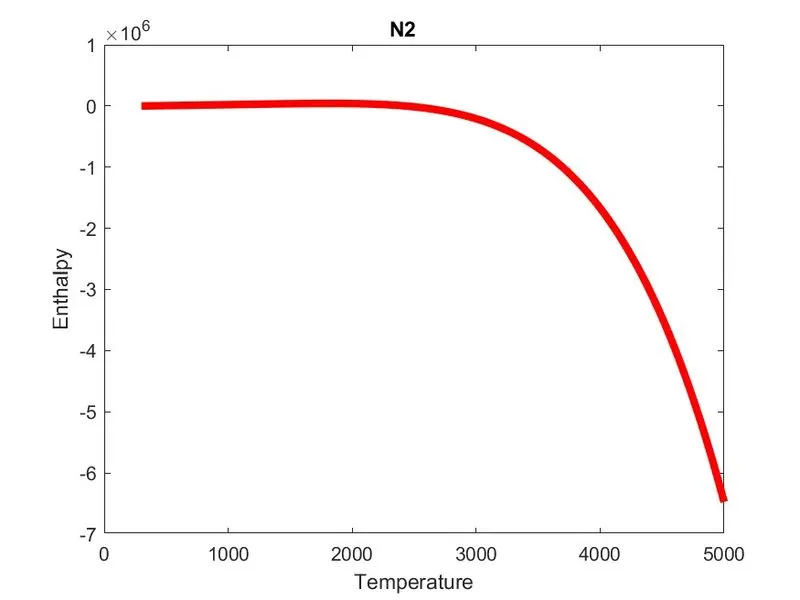
N2
Temperature VS Enthapy
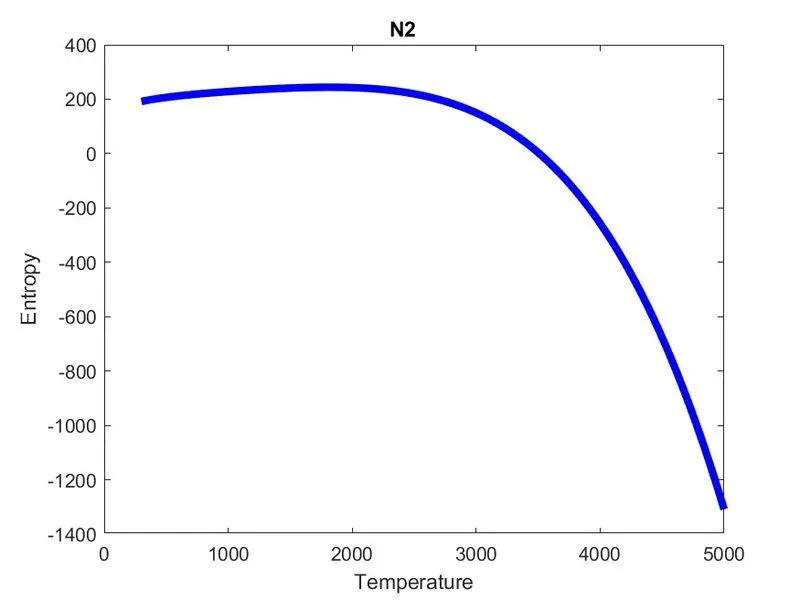
Temperature VS Entropy
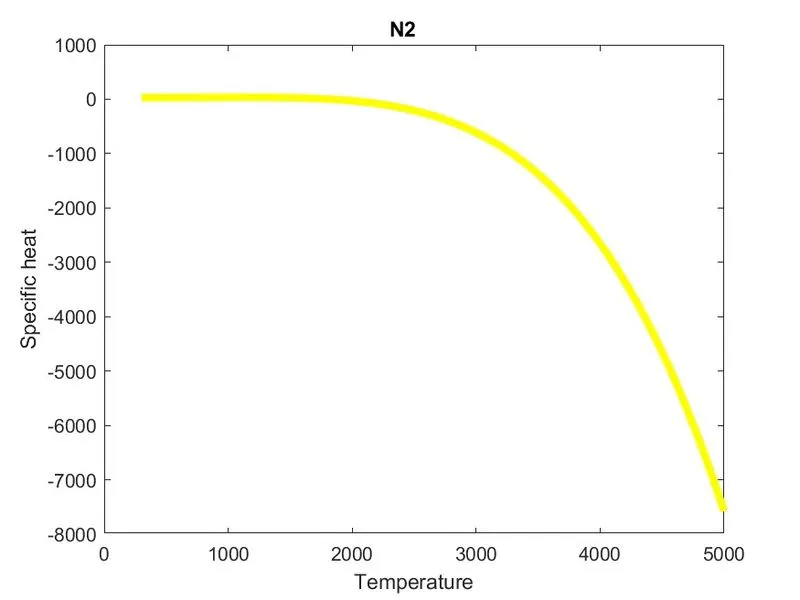
Temperature VS Specific Heat
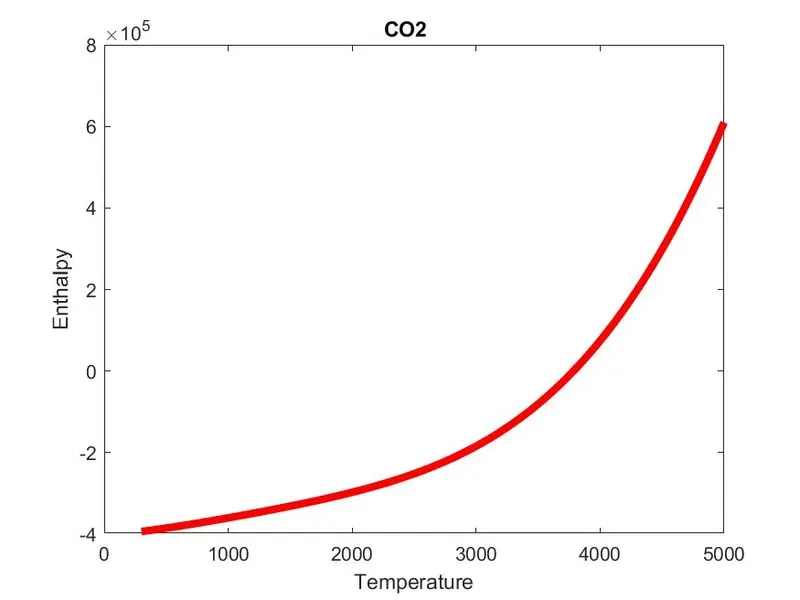
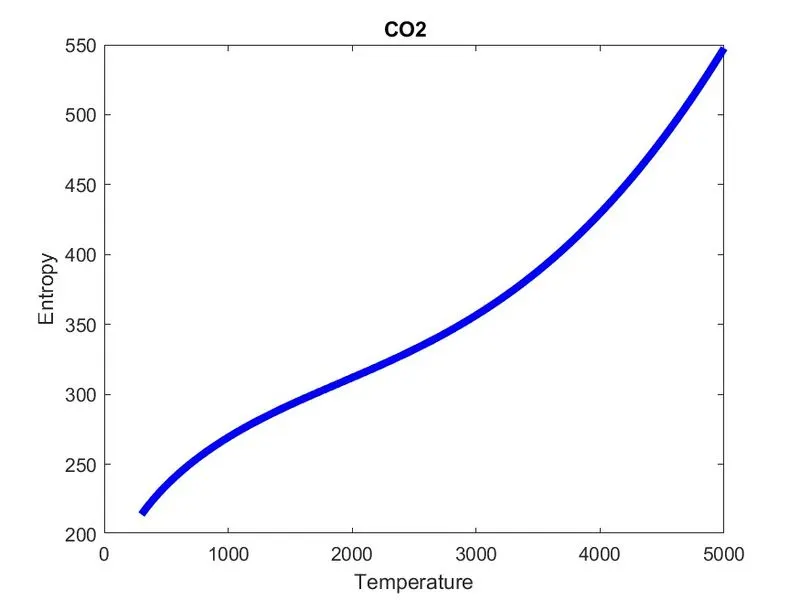
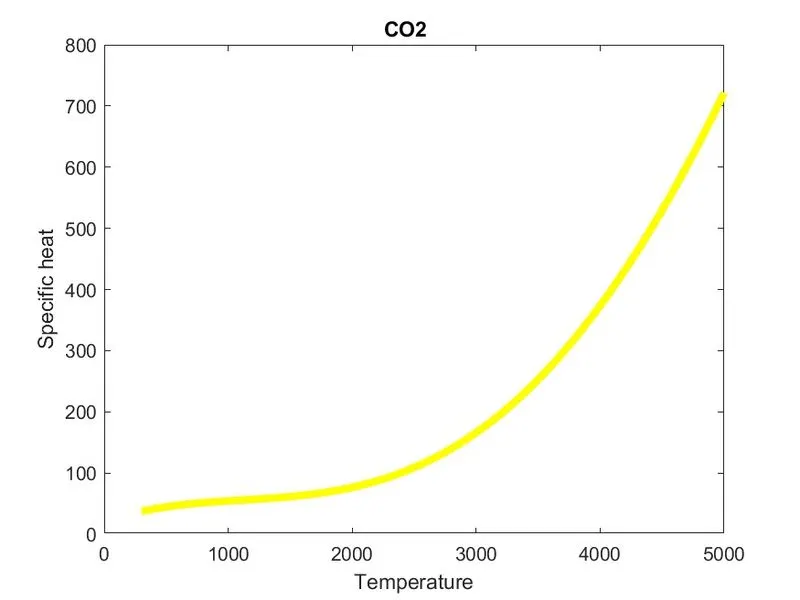
CO2
Temperature VS Enthapy
Temperature VS Entropy
Temperature VS Specific heat
MOLECULAR MASS