Project 1 - Parsing NASA thermodynamic data
AIM:
To write a code in MATLAB to parse the NASA thermodynamic data file and calculate the thermodynamic properties of various gas species.
OBJECTIVE:
- To write a function that extracts the 14 co efficients and calculates the specific heat,enthalpy, and entropy for all the species in the data file.
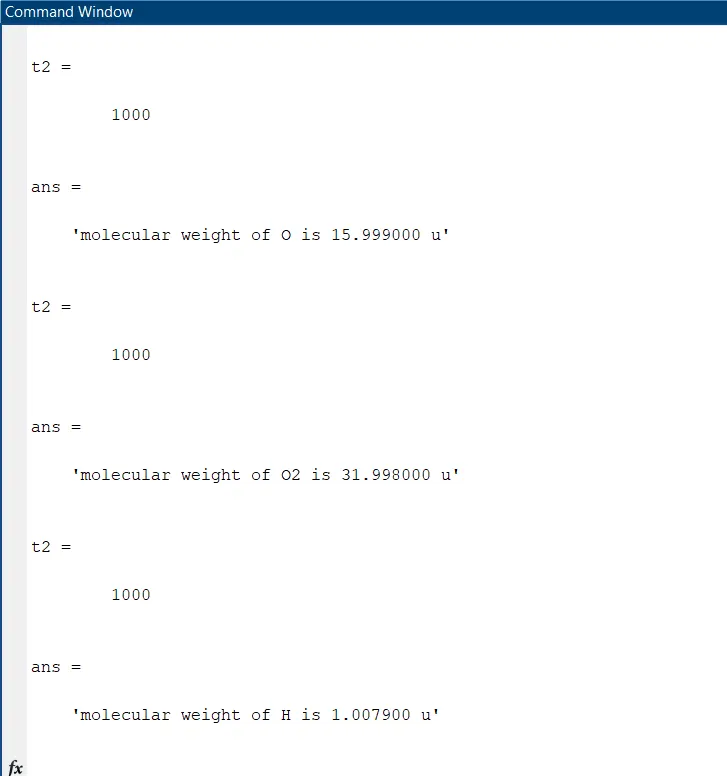
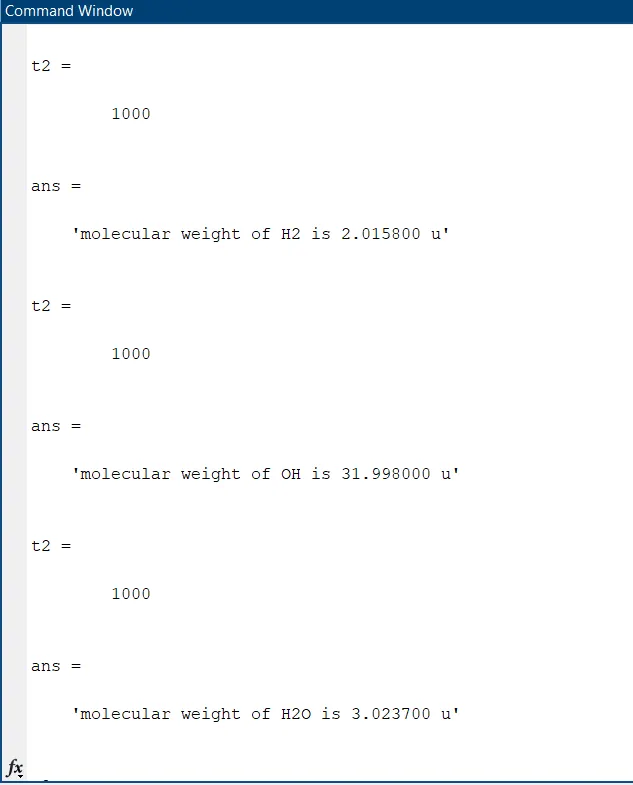
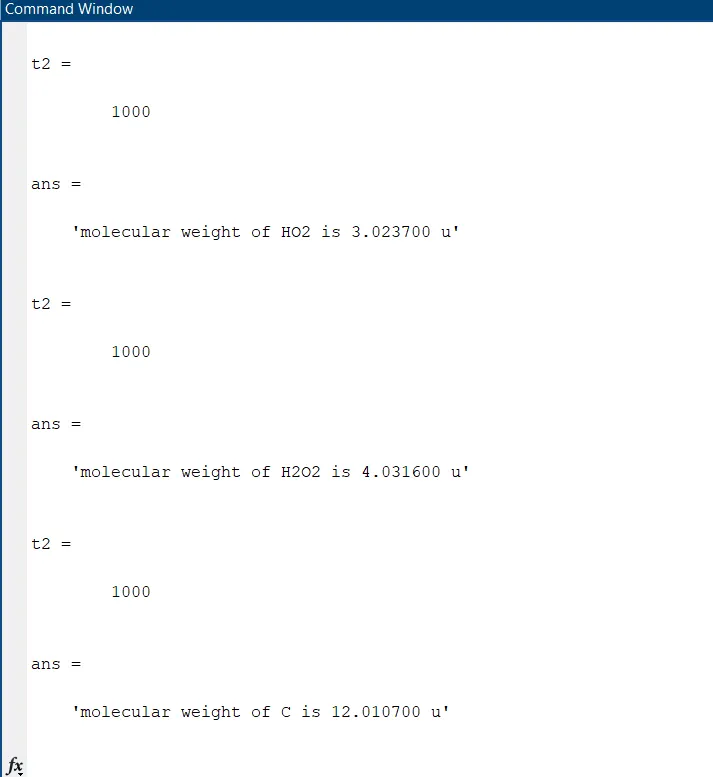
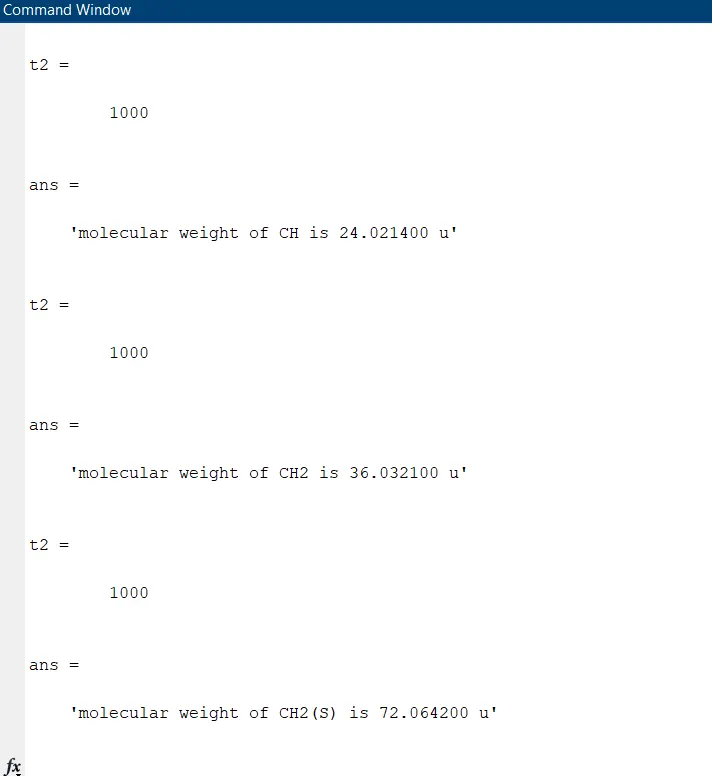
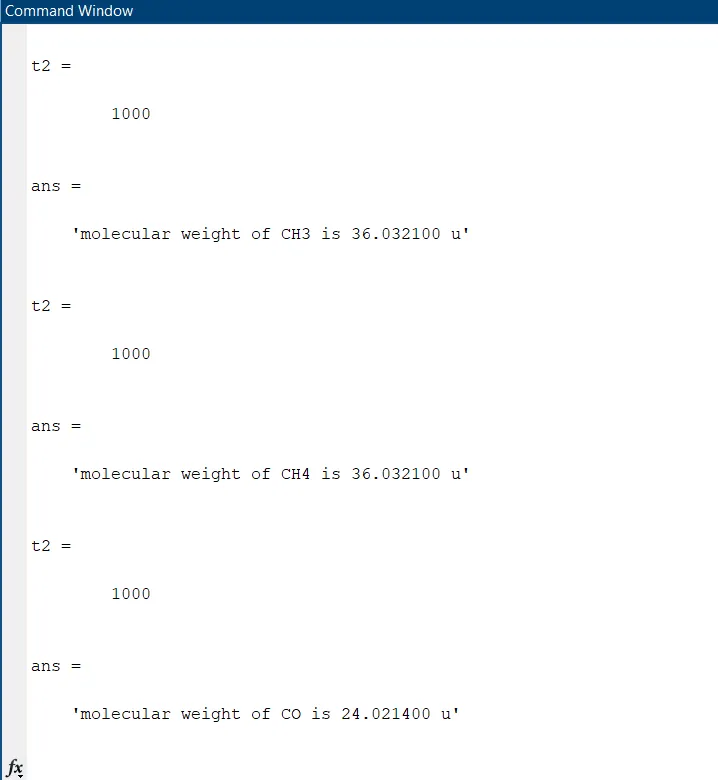
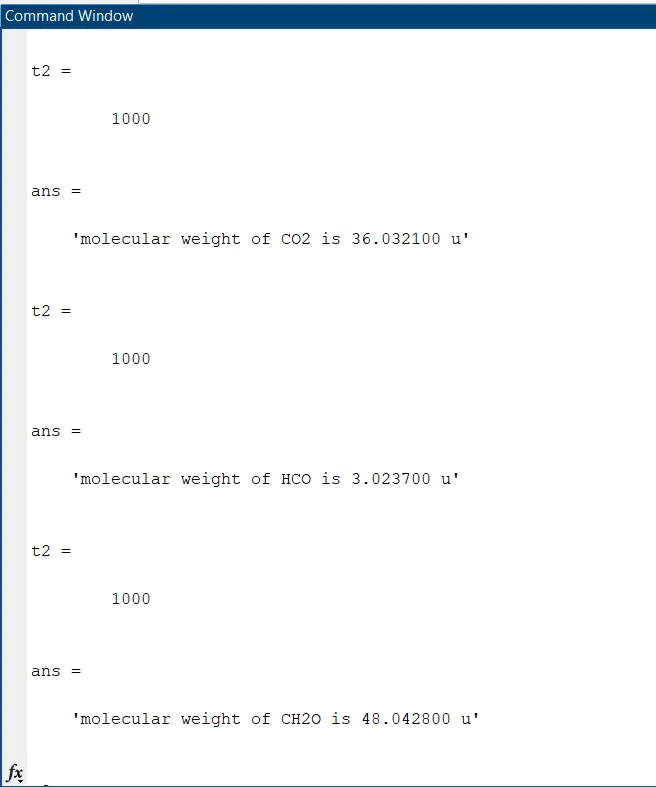
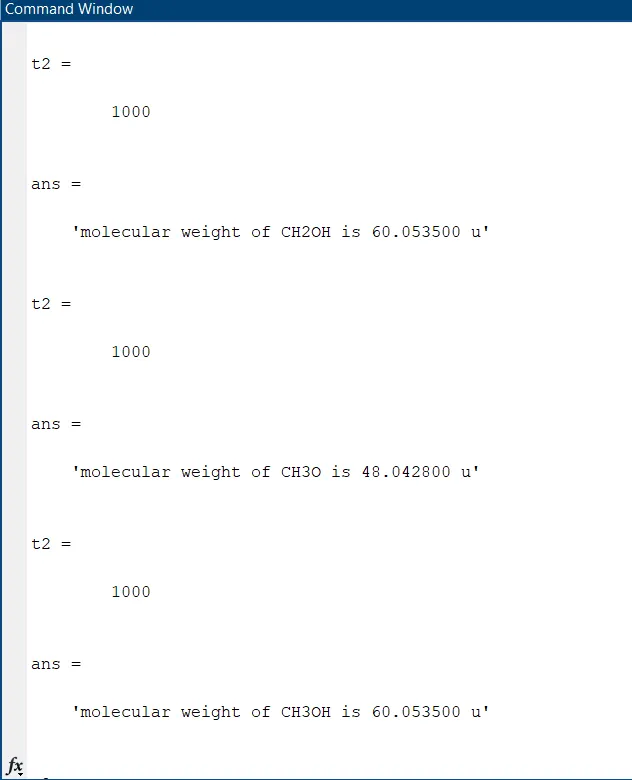
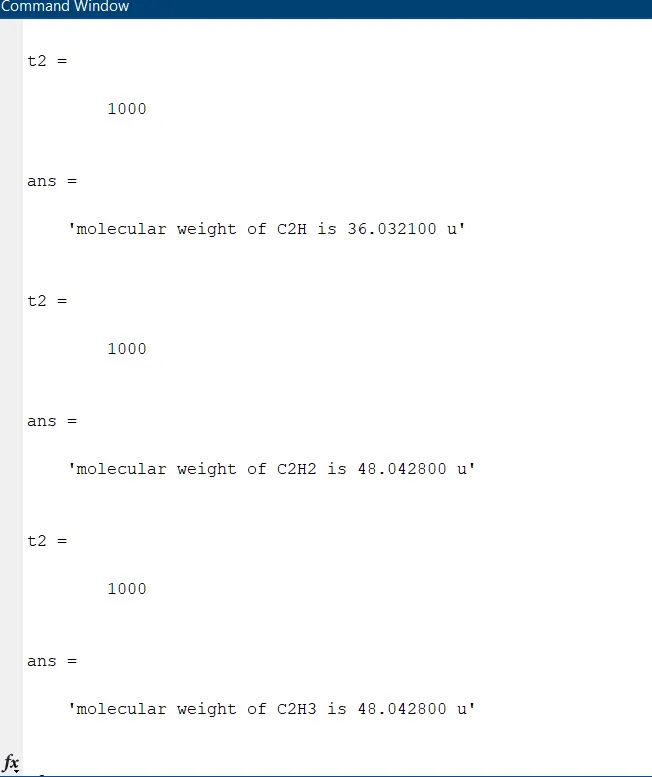
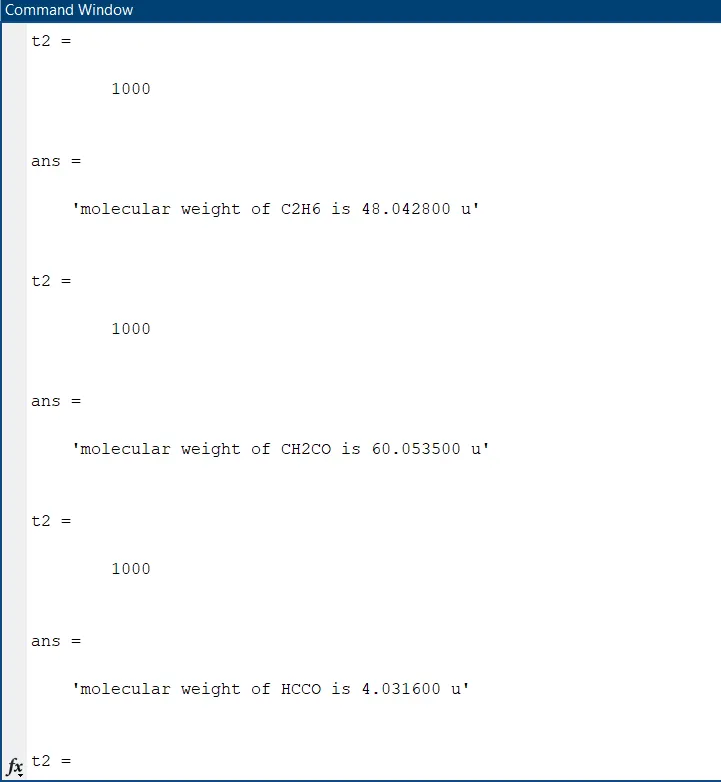
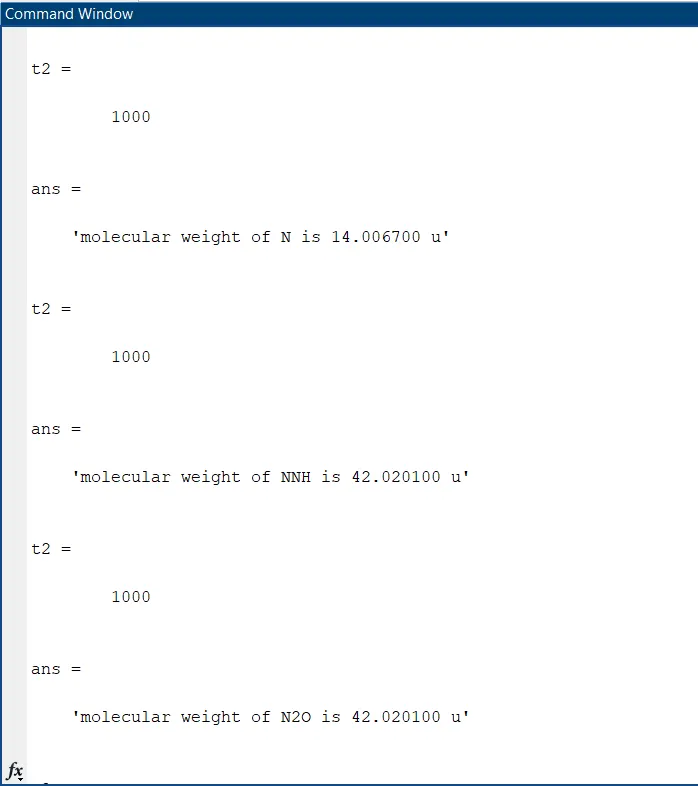
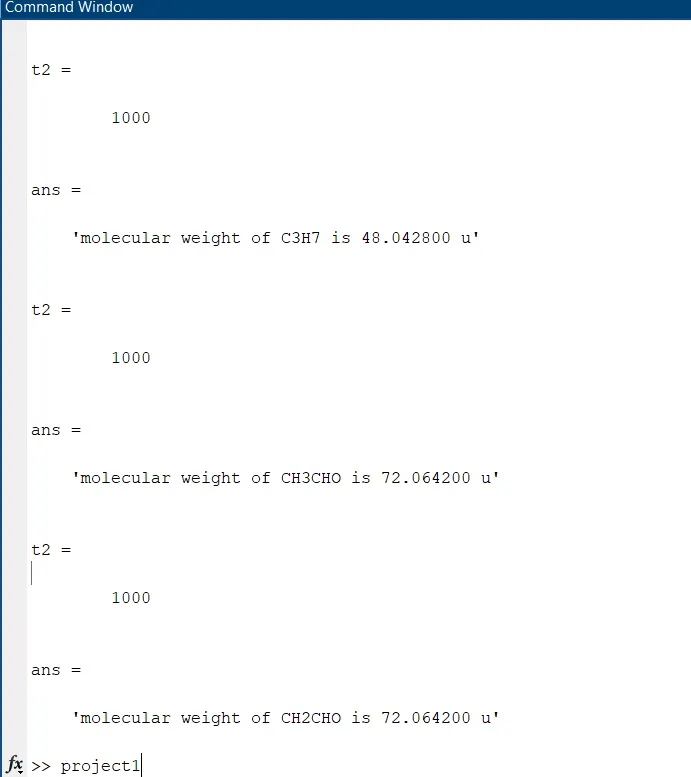
- To calculate the molecular weight of each species and displya it in the command window.
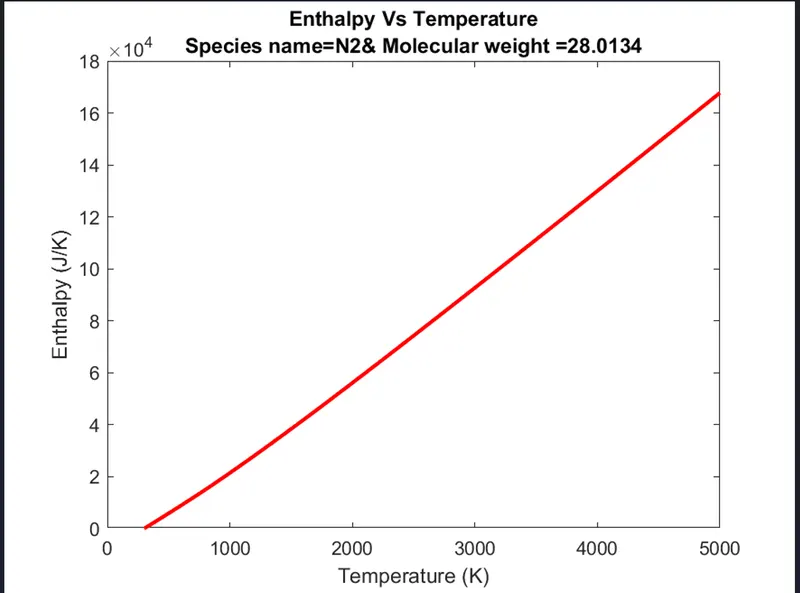
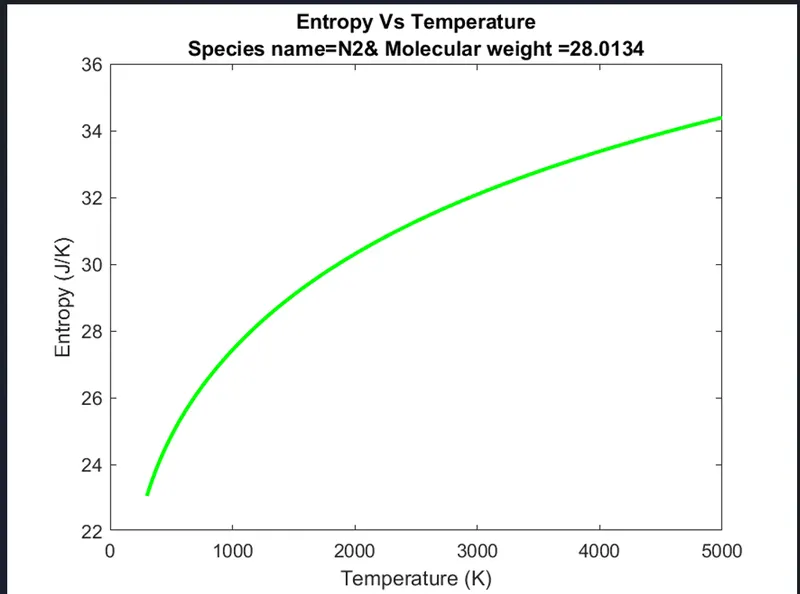
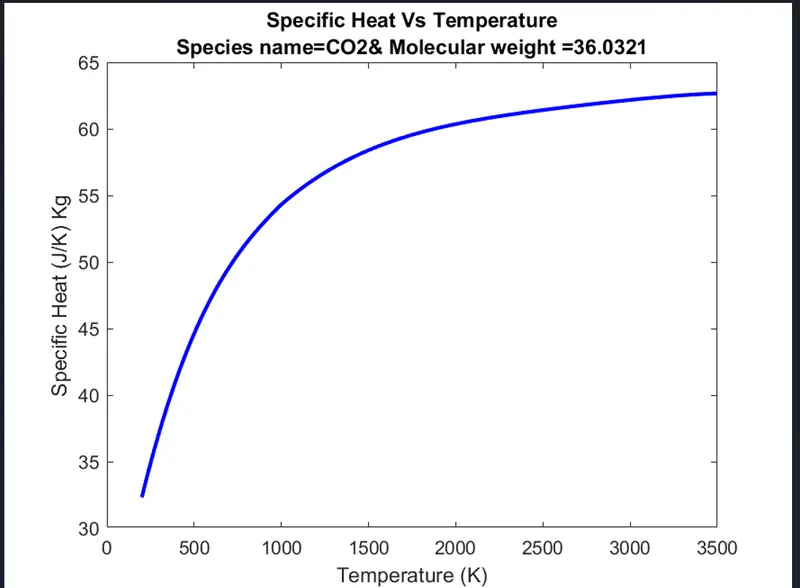
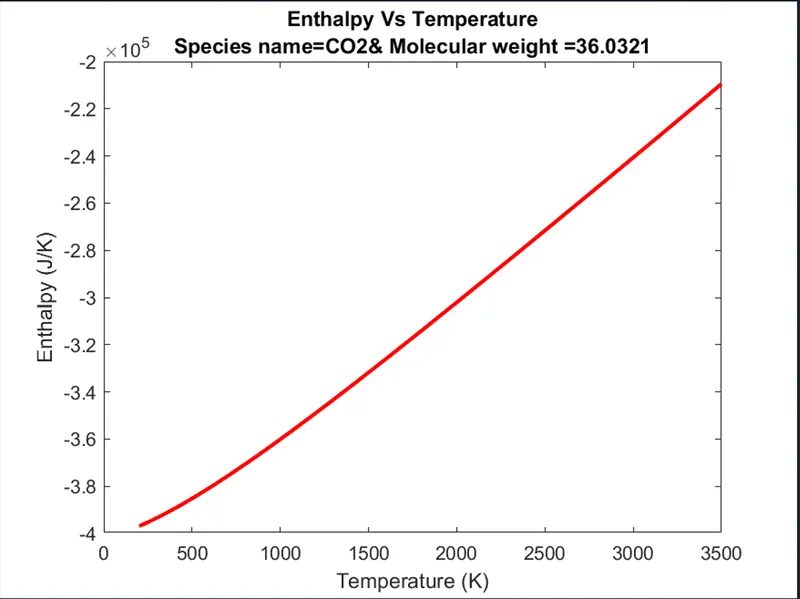
- To plot Cp,Enthalpy, and entropy for the local temperature range(low temperature:high temperature) specific for each species.
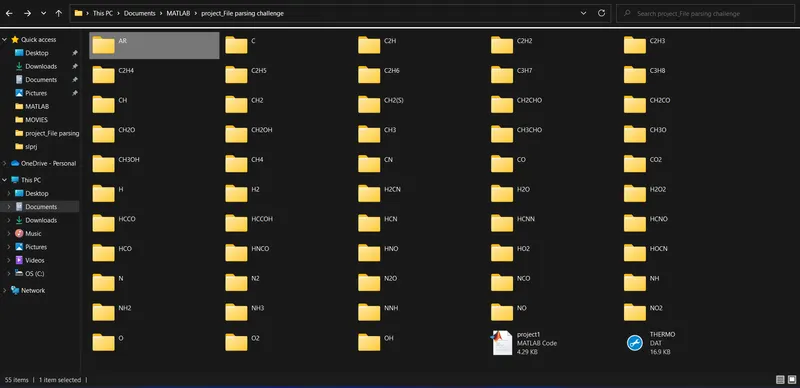
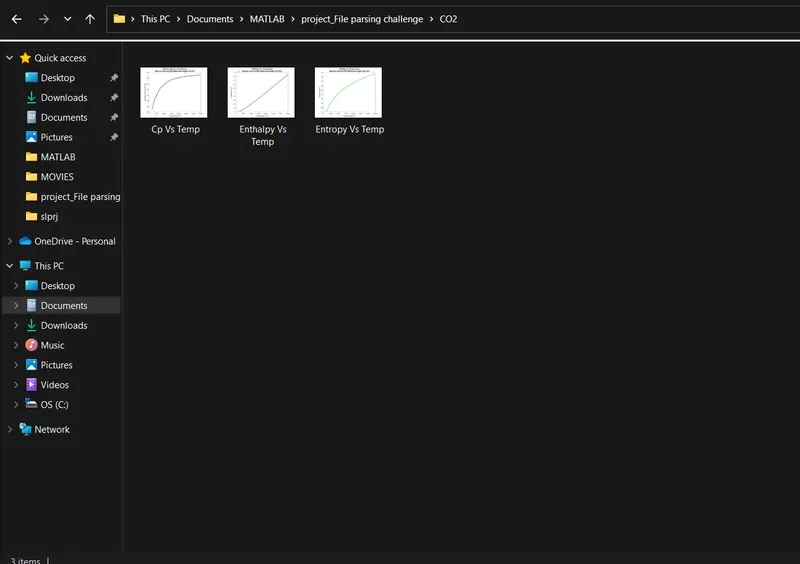
- To save the plot as images with appropriate name and dump them in separate folders for each species with suitable name and all these should be done automatically.
- The main program will just take the 'THERMO.dat' file as input and generate Cp,H and S plots.
THEORY:
File Parsing:-
Parsing,syntax analysis or syntactic analysis is the process of analysing a string of symbols,either in natural language,computer languages or data structures.
Parsing a file means reading in a data stream of some sort and building an in memory model of the semantic content of that data.This aims at facilitating performing some kind of transformation on the data.It is the method of splitting the file or other input into a piece of data that can be easily stored or manipulated.
Specific Heat:-
Specific Heat is the amount of heat energy required to raise the temperature of body per unit of mass.Specific heat is also known as specific heat capacity or mass specific heat.
NASA Thermodynamic File:-
NASA thermodynamic file which is THERMO.dat file in which there are temperature range and 53 species are given in these data and each species contains 14 coefficients and temperature ranges and we have to parse these 14 coefficients and temperature ranges and we have to parse these 14 coefficients to find specific heat,entropy, and enthalpy using equations given,

where,
R=Universal gas constant
T=temperature
Cp=Specific heat(KJ)
S=Entropy(KJ/mol-K)
H=Enthalpy(KL/mol)
a(i)=Coefficients where ,i=1 to 14
Enthalpy:-
Enthalpy, a property of a thermodynamic system, is the sum of the system's internal energy and the product of its pressure and volume. It is a state function used in many measurements in chemical, biological, and physical systems at a constant pressure, which is conveniently provided by the large ambient atmosphere.In a system contained so as to prevent mass transfer,for processes at constant pressure,the heat absorbed or released equals the change in enthalpy.
Entropy:-
The entropy of an object is a measure of the amount of energy which is unavailable to do work.Entropy is also a measure of the number of possible arrangements of atom a system can have.The amount of entropy is also a measure of the molecular disorder,or randomness of a system.
Gas Constant:-
The gas constant is a physical constant denoted by R and is expressed in terms of units of energy per temperature increment per mole.
Molecular weight:-
Molecular weight is a measure of the sum of the atomic weight values of the atoms in a molecule.
MATLAB CODE:
Main Code:-
clear all
close all
clc

% opening the file
f1 = fopen("THERMO.dat",'r');
% reading the lines
fgetl(f1);
fgetl(f1);
fgetl(f1);
fgetl(f1);
fgetl(f1);

% Extracting all species data

for i = 1:53

    % extracting name of gas species

    A = fgetl(f1);                   % Reading sixth line
    z = findstr(A,' ');              % reading species name
    species_name = A(1:z(1)-1);      % finding out species name

    % extracting local temperatures of gas species

    a=findstr(A,'.');
    t1=A((a(1)-3):a(1)+3);
    t1=str2num(t1);
    t2=A((a(3)-4):a(3)+3);
    t2=str2num(t2)
    t3=A((a(2)-4):a(2)+3);
    t3=str2num(t3);

    % t1=Low temp
    % t2=Mid temp
    % t3=High temp

    % extracting coefficient of gas species

    B=fgetl(f1);
    b=findstr(B,'E');
    a1=B(1:b(1)+3);
    a1=str2num(a1);
    a2=B(b(1)+4:b(2)+3);
    a2=str2num(a2);
    a3=B(b(2)+4:b(3)+3);
    a3=str2num(a3);
    a4=B(b(3)+4:b(4)+3);
    a4=str2num(a4);
    a5=B(b(4)+4:b(5)+3);
    a5=str2num(a5);
    C=fgetl(f1);
    c=findstr(C,'E');
    a6=C(1:c(1)+3);
    a6=str2num(a6);
    a7=C(c(1)+4:c(2)+3);
    a7=str2num(a7);
    a8=C(c(2)+4:c(3)+3);
    a8=str2num(a8);
    a9=C(c(3)+4:c(4)+3);
    a9=str2num(a9);
    a10=C(c(4)+4:c(5)+3);
    a10=str2num(a10);
    D=fgetl(f1);
    d=findstr(D,'E');
    a11=D(1:d(1)+3);
    a11=str2num(a11);
    a12=D(d(1)+4:d(2)+3);
    a12=str2num(a12);
    a13=D(d(2)+4:d(3)+3);
    a13=str2num(a13);
    a14=D(d(3)+4:d(4)+3);
    a14=str2num(a14);


   % first 7 are high temp coefficients from a1 to a7
   % second 7 are low temp coefficients from a8 to a14

   % creating the range of low and high values of local temperatures

   T=linspace(t1,t3,1000);
   R=8.314;                          % UNIVERSAL GAS CONSTANT

   % Calculation of specific heat,enthalpy and entropy.

   for i = 1:length(T)

       if T(i)>t2
           Cp(i)=(a1+a2.*T(i)+a3.*T(i).^2+a4.*T(i).^3+a5.*T(i).^4)*R;
           H(i)=(a1+(a2.*T(i))/2+(a3.*T(i).^2)/3+(a4.*T(i).^3)/4+(a5.*T(i).^4)/5+(a6./T(i)))*R.*T(i);
           S(i)=a1.*log(T(i))+a2.*T(i)+(a3.*T(i)^2)/2+(a4.*T(i)^3)/3+(a5.*T(i).^4)/4+a7;
       else
           Cp(i)=(a8+a9.*T(i)+a10.*T(i).^2+a11.*T(i).^3+a12.*T(i).^4)*R;
           H(i)=(a8+(a9.*T(i))/2+(a10.*T(i).^2)/3+(a11.*T(i).^3)/4+(a12.*T(i).^4)/5+(a13./T(i)))*R.*T(i);
           S(i)=a8.*log(T(i))+a9.*T(i)+(a10.*T(i)^2)/2+(a11.*T(i)^3)/3+(a12.*T(i).^4)/4+a14;
       end
   end

   % molecular weight calculation

   elements=['H','C','O','N','A','S'];
   atomic_weight=[1.0079 12.0107 15.999 14.0067 39.948 32.065];
   mol_mass=0;

   for l = 1:length(species_name)
       for m = 1:length(atomic_weight)
           if strcmp(species_name(1),elements(m))
               mol_mass=mol_mass+atomic_weight(m);
               position=m;
           end
       end
       n=str2double(species_name(1));
       if n>1
           mol_mass=mol_mass+atomic_weight(position)*(n-1);
       end
   end
   % printing the molecular weight of gas species in command window

   sprintf('molecular weight of %s is %f u',species_name,mol_mass)

   %creating a folder to save the plots

   mkdir(species_name)
   cd(sprintf(species_name))

   % plotting specific heat vs temperature

   figure(1)
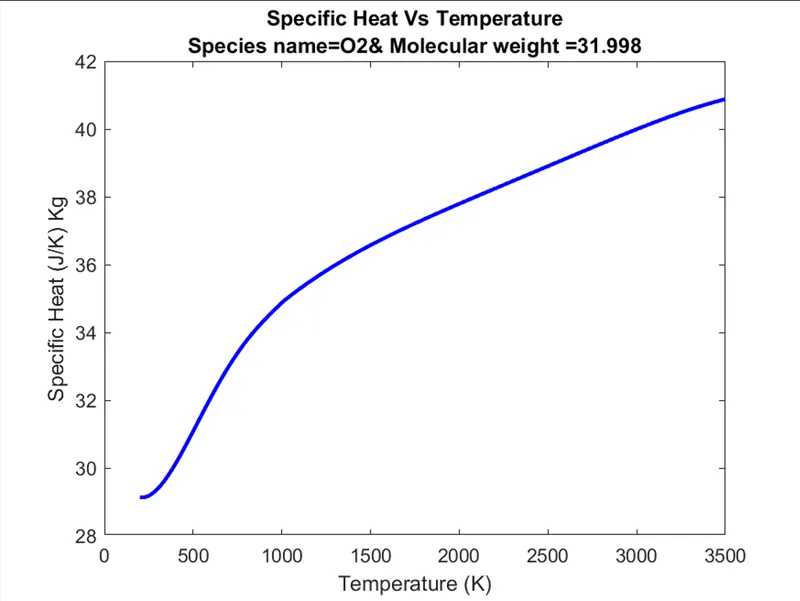
   plot(T,Cp,"Color",'b','LineWidth',2)
   xlabel('Temperature (K)')
   ylabel('Specific Heat (J/K) Kg')
   title({'Specific Heat Vs Temperature',['Species name=',species_name,'& Molecular weight =',num2str(mol_mass)]});
   saveas(figure(1),'Cp Vs Temp.png')

   % plotting enthalpy Vs Temperature
   figure(2)
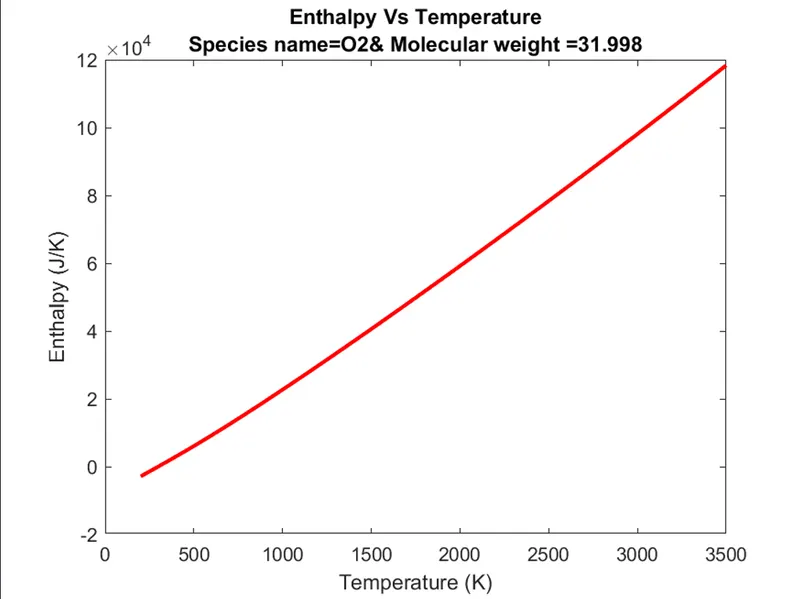
   plot(T,H,"Color",'r','LineWidth',2)
   xlabel('Temperature (K)')
   ylabel('Enthalpy (J/K)')
   title({'Enthalpy Vs Temperature',['Species name=',species_name,'& Molecular weight =',num2str(mol_mass)]});
   saveas(figure(2),'Enthalpy Vs Temp.png')

   % plotting entropy vs temp

   figure(3)
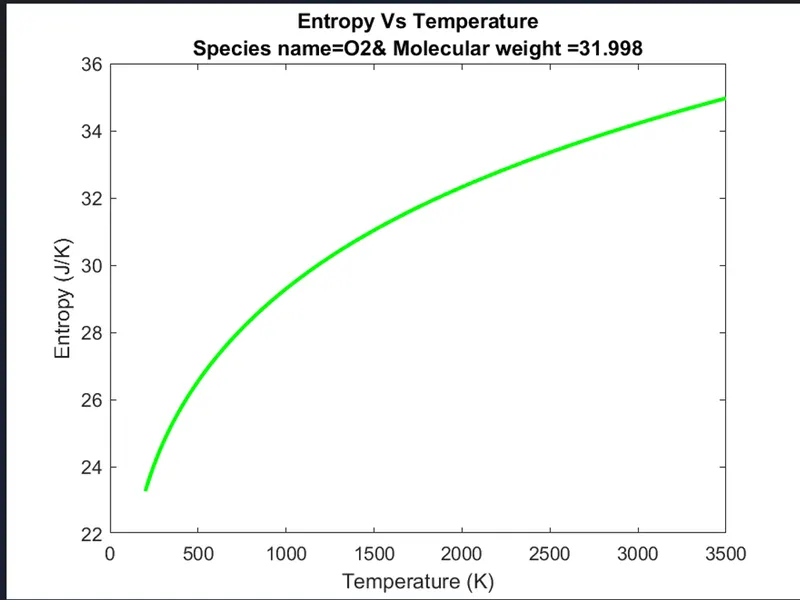
   plot(T,S,"Color",'g','LineWidth',2)
   xlabel('Temperature (K)')
   ylabel('Entropy (J/K)')
   title({'Entropy Vs Temperature',['Species name=',species_name,'& Molecular weight =',num2str(mol_mass)]});
   saveas(figure(3),'Entropy Vs Temp.png')

   % to change the current directory to the main folder

   oldfolder = cd('c:/Users/Nandu/Documents/MATLAB/project_File parsing challenge');

end
CODE EXPLANATION:
- The program start with Clear all,Close all and clc commands to delete all data s in command window and workspace.
- Then using fopen and fgetl command the data given from external NASA thermodynamicdata is opened and read the content line by line.
- A Variable called f1 is assigned then and fgetl(f1) command acts like a line cursor.
- The first 5 lines are skipped to enter the pattern of values of respective gas species and the for loop command is used.
- Using findstr command the name of gas species are founded out.
- Then the gas species names are stored in a variable species_name.
- Similarly using findstr command the local temperatures were found and the low,mid and high temperature are assigned as t1,t2 and t3 respectively.
- Then the co efficent of gas species are extracted in which the coefficient locations are line in the 2nd,next 5 in the 3rd and rest in the 4th rows.
- The values from a1 to a7 represnts high temperature coefficients and a8 to a14 represents the low temperature coefficients.
- Temperature range values from low temperature to high temperature is assigned using the linspace command.
- The for loop is used to calculate specific heat,enthalpy, and entropy and also if-else command also used to find out required values if temperature is above or below the mid temperatures.
- To calculate the molecular weight of species we declare the species elements in form of cell array.
- The value of molecular weight is calculated for the respective gas species and is displayed in command window.
- Then plots are created for obtain specific heat,enthalpy and entropy values and save it in species_name folder automatically.
- To create the folder species_name,mkdir command is used.to change the current directory from main folder to species_name folder cd command is used.
- Thn the plots are labelled and the titles are given to the plots.
- saveas command is used to save the plots in the species_name folder.
- oldfolder=cd() is used then to change the current directory to the main folder.
ERRORS FOUND:
There are only some simple syntax errors are there and it is cleared by the help of insructions in command window.
OUTPUT:
O2 Plot:
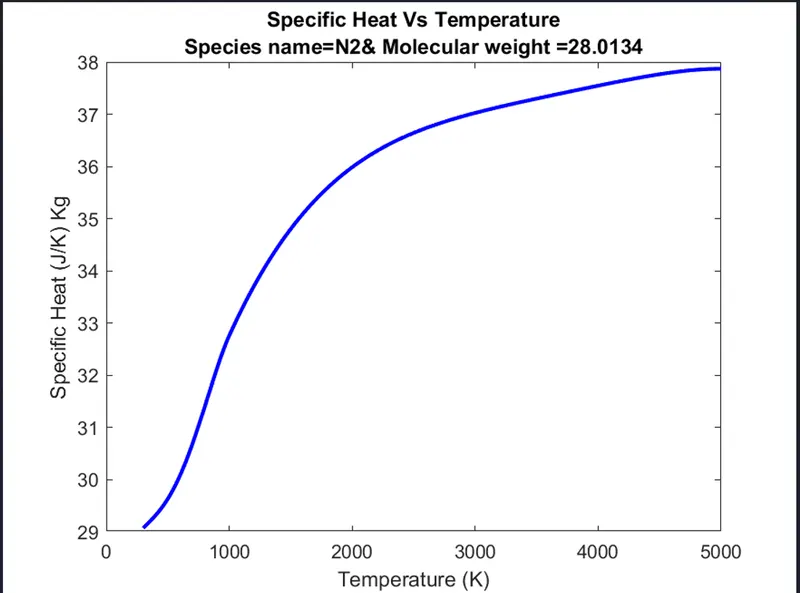
N2 Plot:
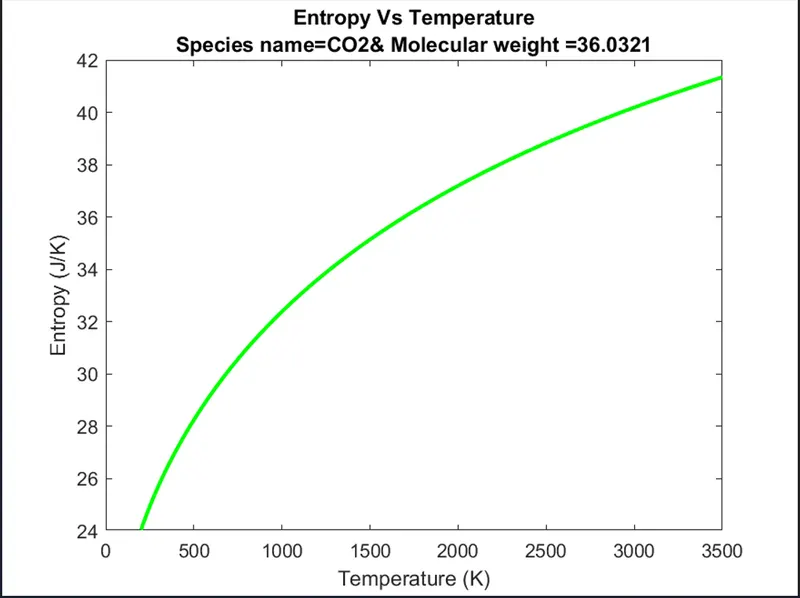
CO2 Plot:
Folder containing the species names:
Folder Containing Plots:
Molecular weight of each species displayed in the command window:
 3
3
CONCLUSION:
Using MATLAB code,the necessary coefficients required to evaluate various thermodynamic parameters for different species are extracted from NASA thermodynamic data file.
The specific heat,enthalpy and entropy are calculated and plotted against local temperature.Also the molecular weight is also calculated.
Google Drive link for folders:
https://drive.google.com/drive/folders/1dW9NHBS6SDiEBNDC7e4uiLKttmW1Gjj8?usp=sharing
REFERENCES:
1.https://in.mathworks.com/help/matlab/ref/mkdir.html
2.https://in.mathworks.com/help/matlab/ref/cd.html