Project 1 - Parsing NASA thermodynamic data
PARSING THE THERMODYNAMICS DATA.
AIM:-To write a code in MATLAB to parse the NASA thermodynamics data file and then calculate thermodynamics properties ,molecular weight,and plot nature of thermodynamics properties if various spceies.
OBJECTIVE:-
1-To write the function that extracts the 14 coefficients for a given species .
2-to write function that calculate the enthalpy,entropy,specific heat using the NASA polynomials for the given species.
3-to write function that plots the cp,enthalpy,entropy, of an input species.
4- to write function that calculates the molecular weight of each species.
INTRODUCTION:-
Parsing is the process of breaking a data into smaller chunks by following a set of rules,
so teat it can be ,more easily interpreted,managed or transmitted by ac computer.NASA
come up with the polynomials that can be used to evaluate thermodynamics properties
such as cp,H, and S using polynomia.they have also documentated the coefficient that
are required to evaluate these polynomials for 1000+ species.
SPECIFIC HEAT:-
this functions uses the high temperature coefficients,low temperature coefficents,and
universal gas constant and global minimum,global mid,global maximum temperature
values as the input species.

writing a function to calculate the specific heat:-
%calculaton of sepcific heat
function cp = specific_heat(a1,a2,a3,a4,a5,b1,b2,b3,b4,b5,T,R,global_mid_temp)

%comparing with global temperature

%if less than global it will take min coeffs

if T>global_mid_temp

    cp = R.*(a1+a2.*T+a3.*T.^2+a4.*T.^3+a5.*T.^4);

    %if temperature is more it will max coeffs

else

    cp = R.*(b1+b2.*T+b3.*T.^2+b4.*T.^3+b5.*T.^4);

end
end
ENTHALPY:-
this functions uses the high- temperature coefficients,low temperature coefficients,universal
gas constant and global minimum,global mid,global maximum temperature values as the input
parameters.

writing a program in matlab to calculate the enthalpy:-
%calculation of enthalpy
function H = enthalpy(a1,a2,a3,a4,a5,a6,b1,b2,b3,b4,b5,b6,T,R,global_mid_temp)

if T>global_mid_temp

   H = R.*(a1.*T+(a2.*T.^2)./2+(a3.*T.^3)./3+a4.*(T.^4)./4+a5.*(T.^5)./5+a6);

else

   H = R.*(b1.*T+(b2.*T.^2)./2+(b3.*T.^3)./3+b4.*(T.^4)./4+b5.*(T.^5)./5+b6);

end
end
ENTROPY:-
this function uses the high-temperature coefficent,low temperature coefficients,universal gas constant,
and global minimum,global mid, global maximize temperature values as the input parameters.

writing a program in matlab to calculate the entropy :-
%calculation of entropy
function S = entropy(a1,a2,a3,a4,a5,a7,b1,b2,b3,b4,b5,b7,T,R,global_mid_temp)

if (T<= global_mid_temp)

S = R*(a1.*log(T)+a2.*T+a3.*(T.^2)./2+a4.*(T.^3)./3+a5.*(T.^4)./4+ a7);

else
    S = (R*b1.*log(T)+b2.*T+b3.*(T.^2)./2+b4.*(T.^3)./3+b5.*(T.^4)./4+ b7);

end
end
WRITING A CODE OF MOLECULAR WEIGHT:-
%function of calculating molecular weight.

function MW = molecular_weight(name)

         atoms=['H','C','O','N','R'];
         fprintf('molecular weight of')
         fprintf(name);
         fprintf(' : ');

         atomic_weight = [1, 12, 16, 14, 40];

         MW = 0;

         for i= 1:length(name)
             for j  = 1:length(atoms)
                 if strcmp(name(i),atoms(j))
                 MW = MW+atomic_weight(j);
                 position = j;

                 end
             end
             n = str2double(name(i));
             if n>1
                 MW = MW+atomic_weight(position)*(n-1);
             end
         end
         fprintf('%d',MW);
         disp('  ');
end
WRITING A PROGRAM FOR PLOTTING:-
%creating plotting function
function plotting(cp,H,S,T,name)
cd(pwd)
dir_name = name;
mkdir(dir_name);

figure(1)
plot(T,cp,'linewidth',2,'color','b')
 title('specific heat vs temperature for %s',name)
xlabel('TEMPERATURE')
ylabel('SPECIFIC HEAT')

figure(2)
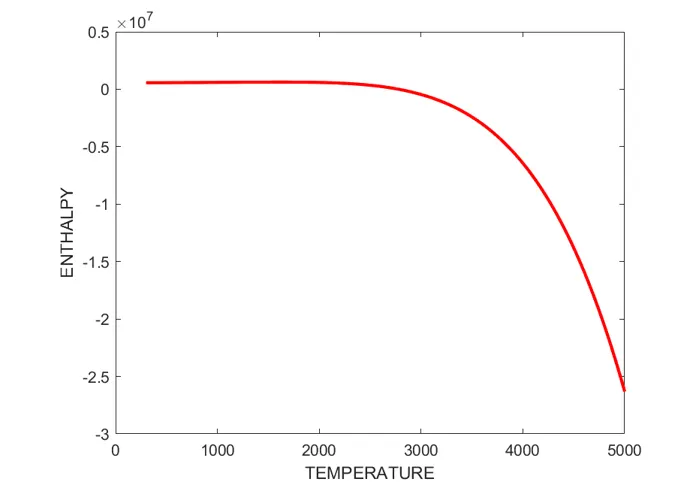
plot(T,H,'linewidth',2,'color','r')
title('enthalpy vs temperature for %s',name)
xlabel('TEMPERATURE')
ylabel('ENTHALPY')

figure(3)
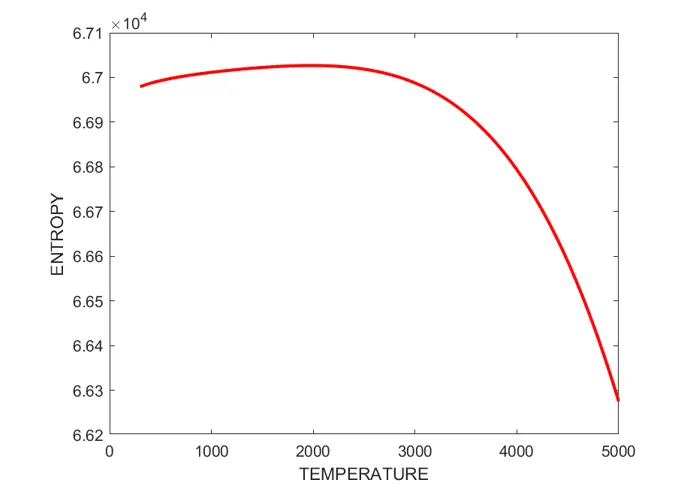
plot(T,S,'linewidth',2,'color','r')
title('entropy vs temperature for %s',name))
xlabel('TEMPERATURE')
ylabel('ENTROPY')

cd(dir_name)

saveas (1,'cp_vs_t.png')
saveas (2,'H_vs_t.png')
saveas (3,'S_vs_t.png')

cd ..
end
WRITING A WHOLE PROGRAM AT ONCE:-
clear all
close all
clc

%opening of NASA's thernodynamic data

f1 = fopen('THERMO.dat','r');
first_line = fgetl(f1);

%obtaining of global max,global min,global mid
global_temp = fgetl(f1);
temp_range = strsplit(global_temp,' ');
global_min_temp = str2num(temp_range{2})
global_mid_temp = str2num(temp_range{3})
global_max_temp = str2num(temp_range{4})

for i=1:3
    d=fgetl(f1);
end
%Range of tamperature
T = linspace(global_min_temp,global_max_temp,400);
R = 8.314;

%obtaining the coeffs of species
for i = 1:53

   %extracting line 1 and the name of species

   line1 = fgetl(f1);
   A=strsplit(line1, ' ');
%    name = strtok(line1);
name = (A{1});

   %extracting higher and lower temperature coeffs

   line2 = fgetl(f1);
   line3 = fgetl(f1);
   line4 = fgetl(f1);

   A = strfind(line2,'E')
   B = strfind(line3,'E')
   C = strfind(line4,'E')

   %extracting higher temperature coeffs

   a1 = str2num(line2(1:A(1)+3));
   a2 = str2num(line2(A(1)+4:A(2)+3));
   a3 = str2num(line2(A(2)+4:A(3)+3));
   a4 = str2num(line2(A(3)+4:A(4)+3));
   a5 = str2num(line2(A(4)+4:A(5)+3));
   a6 = str2num(line3(1:B(1)+3));
   a7 = str2num(line3(B(1)+4:B(2)+3));

   %extracting  lower temoerature coeffs

    b1 = str2num(line3(B(2)+4:B(3)+3));
    b2 = str2num(line3(B(3)+4:B(4)+3));
    b3 = str2num(line3(B(4)+4:B(5)+3));
    b4 = str2num(line4(1:C(1)+3));
    b5 = str2num(line4(C(1)+4:C(2)+3));
    b6 = str2num(line4(C(2)+4:C(3)+3));
    b7 = str2num(line4(C(3)+4:C(4)+3));


    %specific heat calculation

    cp = specific_heat(a1,a2,a3,a4,a5,b1,b2,b3,b4,b5,T,R,global_mid_temp);

    %enthalpy calculation

    H = enthalpy(a1,a2,a3,a4,a5,a6,b1,b2,b3,b4,b5,b6,T,R,global_mid_temp);

    %entropy calculation

    S = entropy(a1,a2,a3,a4,a5,a6,b1,b2,b3,b4,b5,b6,T,R,global_mid_temp);

    %calculating molecular weight of species

    MW = molecular_weight(name);

    %creating individual folder for each species and plotting

    plotting(cp,H,S,T,name)

end
RESULTS:-
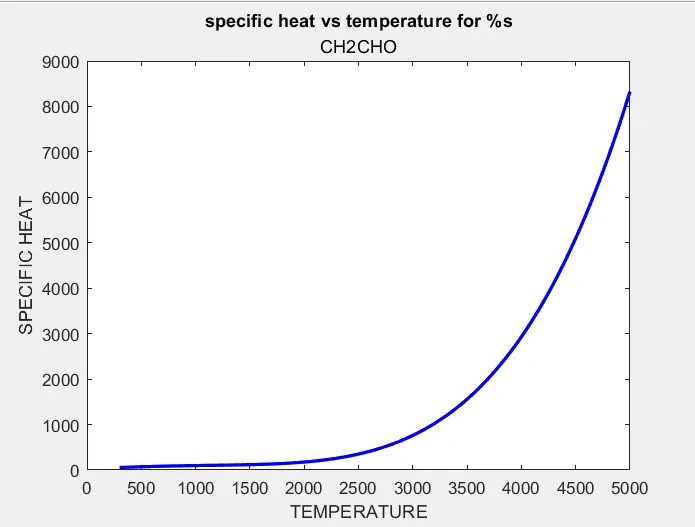
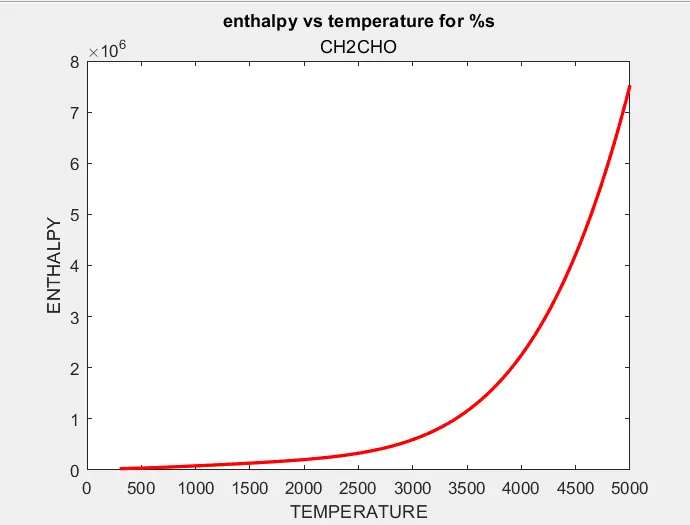
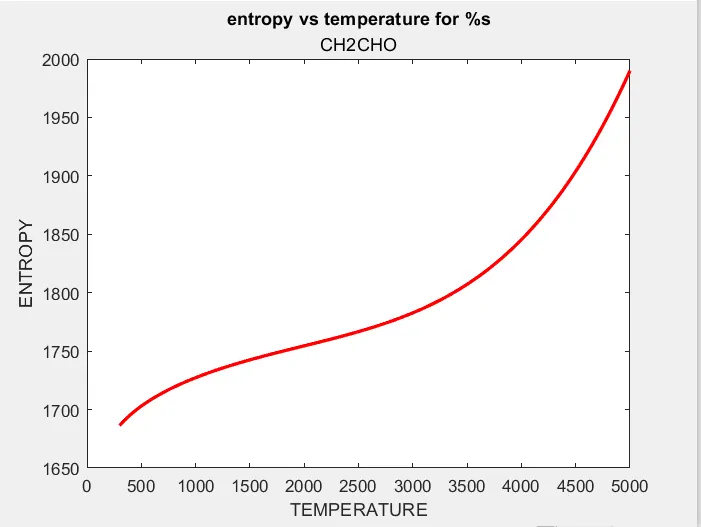
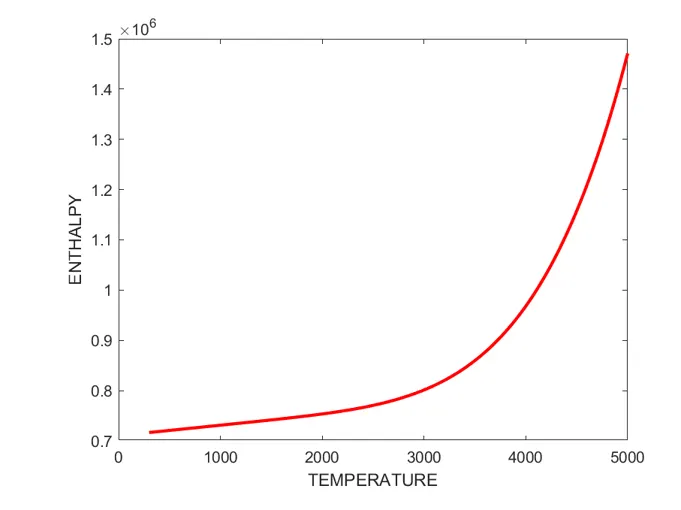
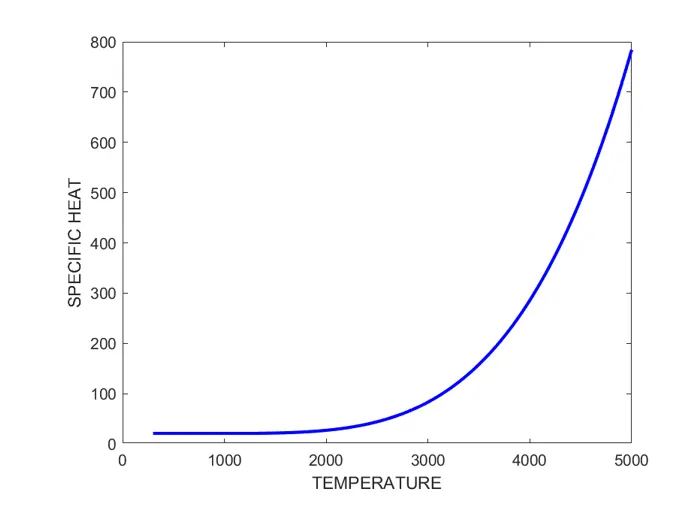
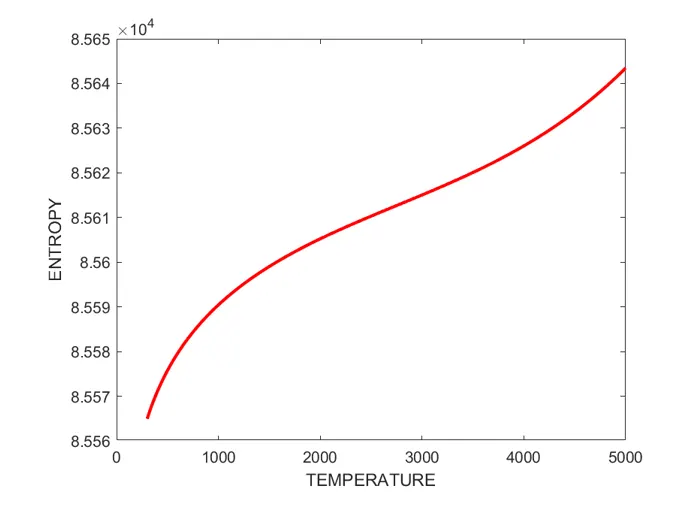
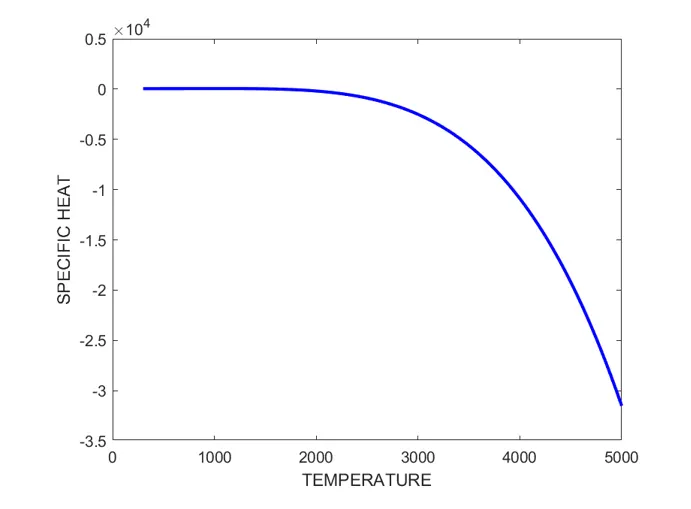
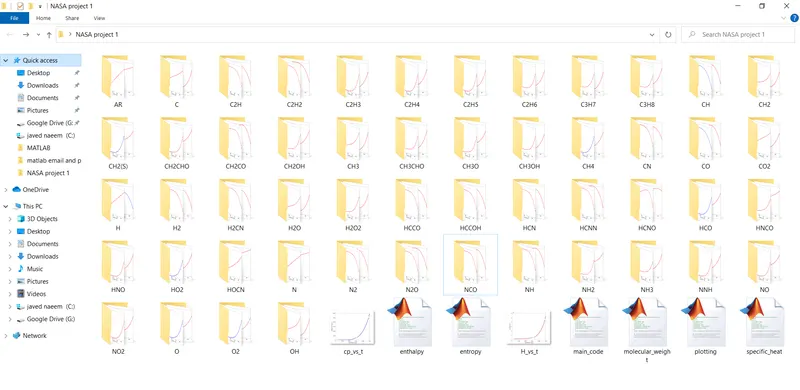
screenshot of separate folder where all code and plots are saved.