Project 1 - Parsing NASA thermodynamic data
AIM:-
To write a program in matlab to parse the nasa thermodynamic data file and then calculate the thermodynamic data file and then calculate the thermodynamic properties of various gas species.
OBJECTIVE:-
- To write a function that extracts the 14 co-efficients and calculates the enthalpy, entropy and specific heats for all the species in the data file.
- To calculate the molecular weight of each species and display it in the command window.
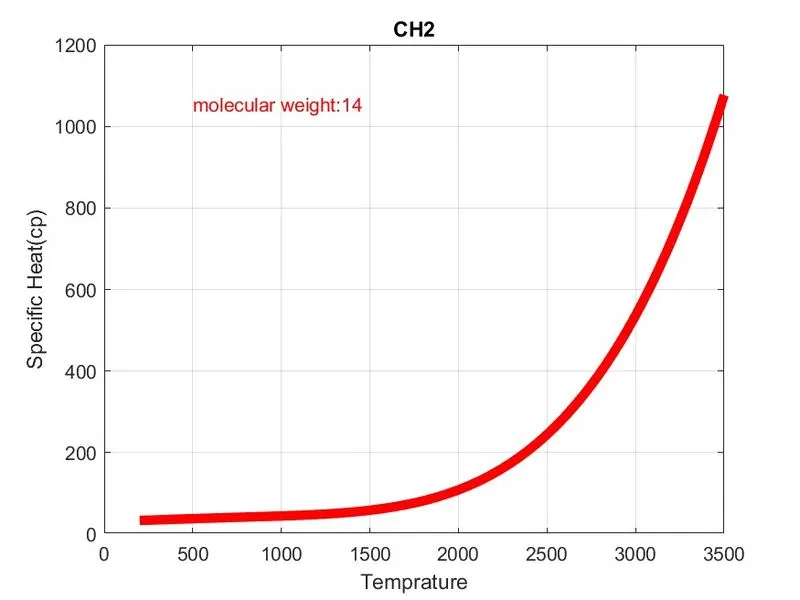
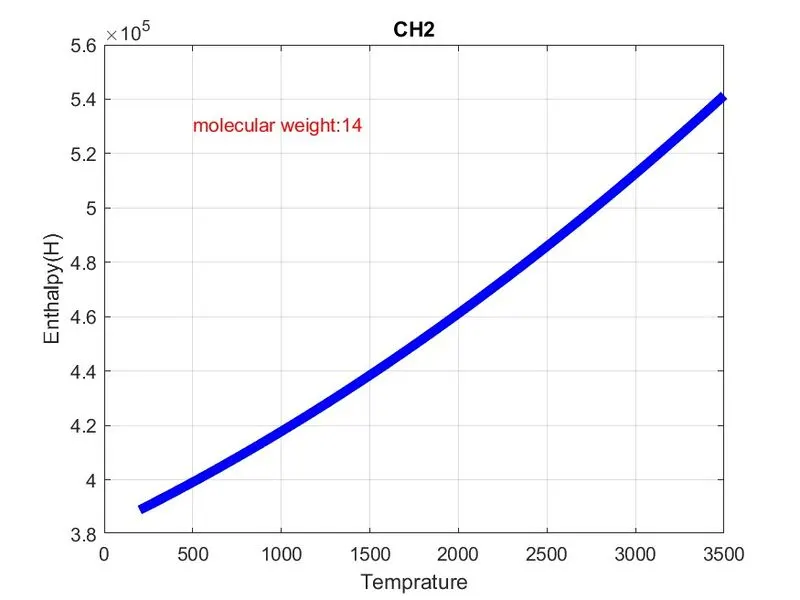
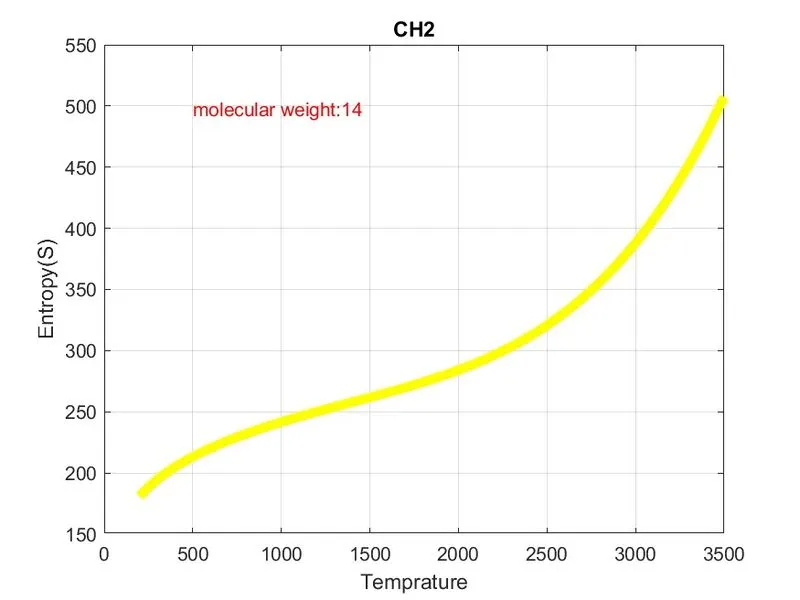
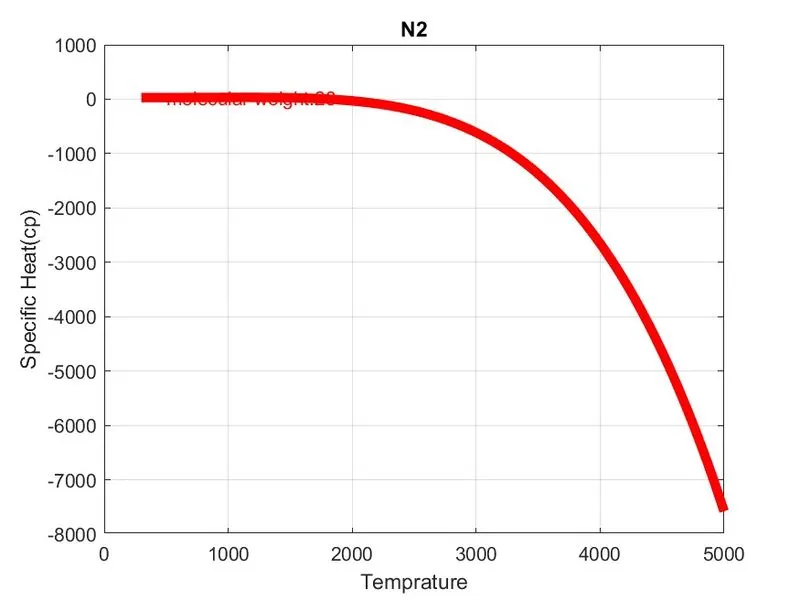
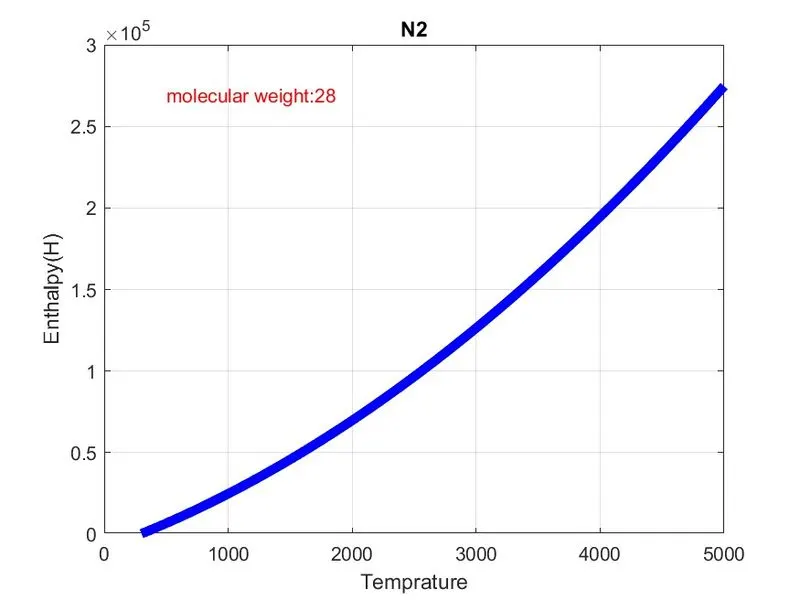
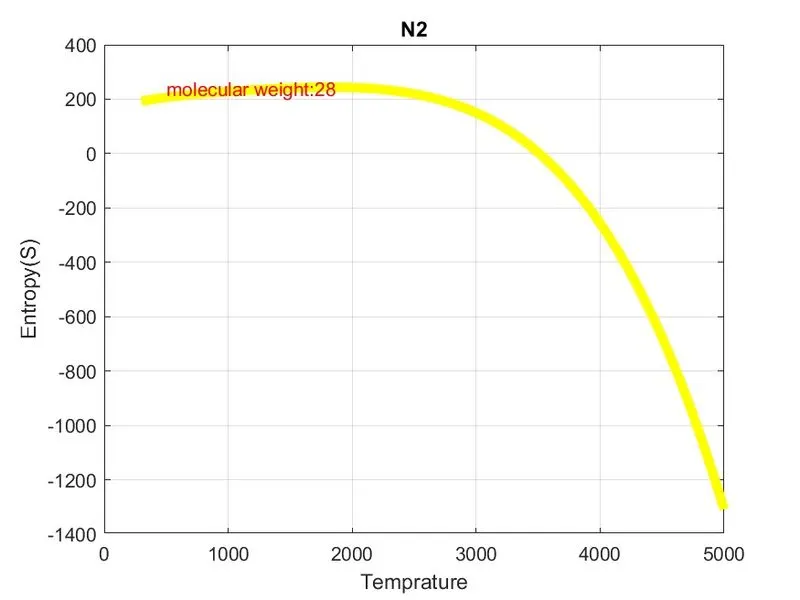
- To plot the Cp, Enthalpy and Entropy for the local temperature range (low temperature : high temperature) specific for each species.
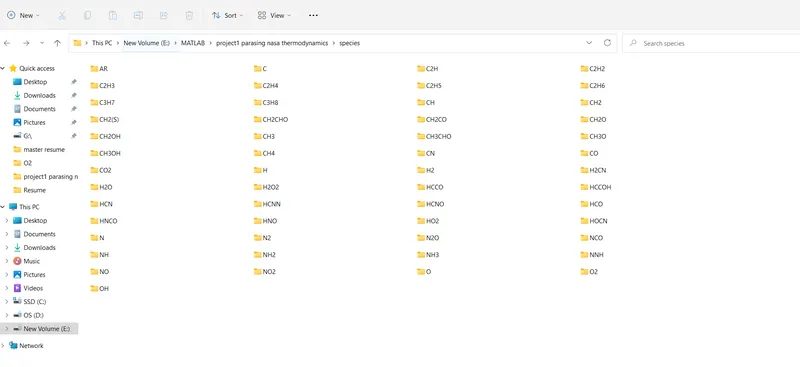
- To save the plots as images with appropriate names and dump them in separate folders for each species with suitable name. All these should be generated automatically.
INTRODUCTION:-
DATA PARSING:
Data parsing is the process of taking data in one format and transforming it to another format. You'll find parsers used everywhere. They are commonly used in compilers when we need to parse computer code and generate machine code.
TO BUILD DATA PARSER:
Regardless of what type of data parser you choose, a good parser will figure out what information from an HTML string is useful and based on pre-defined rules. There are usually two steps to the parsing process, lexical analysis and syntactic analysis.
Lexical analysis is the first step in data parsing. It basically creates tokens from a sequence of characters that come into the parser as a string of unstructured data, like HTML. The parser makes the tokens by using lexical units like keywords and delimiters. It also ignores irrelevant information like whitespaces and comments.
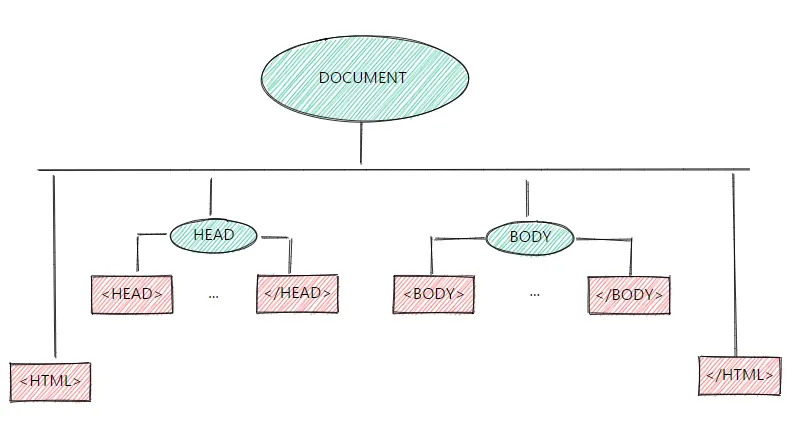
After the parser has separated the data between lexical units and the irrelevant information, it discards all of the irrelevant information and passes the relevant information to the next step.
The next part of the data parsing process is syntactic analysis. This is where parse tree building happens. The parser takes the relevant tokens from the lexical analysis step and arranges them into a tree. Any further irrelevant tokens, like semicolons and curly braces, are added to the nesting structure of the tree.
EQUATIONS USING FOR FUNCTIONS TO CALCULATE CP, H, S:

Cp = Specific Heat
R = Molar Gas Constant
T = Temprature
S = Entropy
H = Enthalpy
a = Coefficients
MATLAB CODE:-
clear all
close all
clc

% Opening thermo data file
f1 = fopen('THERMO.dat','r');


% To skip lines of file
l1=fgetl(f1);
l2=fgetl(f1);
l3=fgetl(f1);
l4=fgetl(f1);
l5=fgetl(f1);

for i=1:53
%to seprate the numbers
l=fgetl(f1);
numbers = strsplit(l,' ');
species=numbers{1};

%to get the Local temp in number from file

g = strfind(l,'G');
local_low_temp = str2double(l(g+3:g+10));
local_high_temp = str2double(l(g+12:g+20));
local_mid_temp = str2double(l(g+22:g+30));


%parsing the species block 7 higher cofficients and 7 lower cofficients

tline1 = fgetl(f1);
a = strfind(tline1,'E');

a1 = tline1(1:a(1)+3);
a1 = str2double(a1);
a2 = tline1(a(1)+4:a(2)+3);
a2 = str2double(a2);
a3 = tline1(a(2)+4:a(3)+3);
a3 = str2double(a3);
a4 = tline1(a(3)+4:a(4)+3);
a4 = str2double(a4);
a5 = tline1(a(4)+4:a(5)+3);
a5 = str2double(a5);

tline2 = fgetl(f1);
a = strfind(tline2,'E');

a6 = tline2(1:a(1)+3);
a6 = str2double(a6);
a7 = tline2(a(1)+4:a(2)+3);
a7 = str2double(a7);
a8 = tline2(a(2)+4:a(3)+3);
a8 = str2double(a8);
a9 = tline2(a(3)+4:a(4)+3);
a9 = str2double(a9);
a10 = tline2(a(4)+4:a(5)+3);
a10 = str2double(a10);

tline3 = fgetl(f1);
a = strfind(tline3,'E');

a11 = tline3(1:a(1)+3);
a11 = str2double(a11);
a12 = tline3(a(1)+4:a(2)+3);
a12 = str2double(a12);
a13 = tline3(a(2)+4:a(3)+3);
a13 = str2double(a13);
a14 = tline3(a(3)+4:a(4)+3);
a14 = str2double(a14);

% Molar gas constant
R = 8.314;

% Temprature range
T=linspace(local_low_temp,local_high_temp,1000);

%calculating specific heat(cp), Enthalpy(h) & Entropy(s)
if T>local_mid_temp
                cp = R.*(a1+a2.*T+a3.*T.^2+a4.*T.^3+a5.*T.^4);
                h = R.*T.*(a1+a2.*(T)./2+a3.*(T)./3+a4.*(T)./4+a5.*(T)./5+a6./T);
                s = R.*(a1.*log(T)+a2.*T+a3.*(T.^2)/2+a4.*(T.^3)/3+a5.*(T.^4)/4+a7);
else
                cp=R.*(a8+a9.*T+a10.*T.^2+a11.*T.^3+a12.*T.^4);
                h=R.*T.*(a8+a9.*(T)./2+a10.*(T)./3+a11.*(T)./4+a12.*(T)./5+a13./T);
                s=R.*(a8.*log(T)+a9.*T+a10.*(T.^2)/2+a11.*(T.^3)/3+a12.*(T.^4)/4+a14);
end


%Calculating the molecular weight of each species.
molecular_weight = mol_wt(species);
fprintf('molecular weight of the species %s is %f',species,molecular_weight);

%To make folder
mkdir(['E:\MATLAB\project1 parasing nasa thermodynamics\species\',species]);

%molecular weight
M = mol_wt(species)

%ploting T vs cp
figure(1)
plot(T,cp,'LineWidth',5,'Color','r');
txt1=['molecular weight:' num2str(M)];
text(500,max(cp)*0.98,txt1,'color','r')
xlabel('Temprature');
ylabel('Specific Heat(cp)');
title(species);
grid on

%ploting T vs H
figure(2)
plot(T,h,'LineWidth',5,'Color','b');
txt1=['molecular weight:' num2str(M)]
text(500,max(h)*0.98,txt1,'color','r')
xlabel('Temprature');
ylabel('Enthalpy(H)');
title(species);
grid on

%ploting T vs S
figure(3)
plot(T,s,'LineWidth',5,'Color','y');
txt1=['molecular weight:' num2str(M)]
text(500,max(s)*0.98,txt1,'color','r')
xlabel('Temprature');
ylabel('Entropy(S)');
title(species);
grid on

%to display the current folder
cd(['E:\MATLAB\project1 parasing nasa thermodynamics\species\',species]);

%to save the each plot
saveas(1,'cpvsT','jpg');

saveas(2,'HvsT','jpg');

saveas(3,'SvsT','jpg');
end
FUNCTION CODE FOR TO CACULATE MOLECULAR WEIGHT:
%function to calculate the molecular mass
function  mw = mol_wt(species)
% storing value
%compound_name = (species)
%creating an array of elements
elements = ['H','C','O','N','A','S'];
%storing atomic mass value in array
atomic_mass = [1,12,16,14,40,32];

mw=0;
%creating loop
for i = 1:length(species)
    for j = 1:length(elements)
   if strcmp(species(i),elements(j))
       mw=mw+atomic_mass(j);
       k=j;
   end
    end

%converging the string to number
n = str2double(species(i));

if(n>1)
    mw=mw+atomic_mass(k)*(n-1);
end
end


end
EXPLANATION OF CODE:-
- In the starting open the thermo data file.
- After that we read and skip the unwanted line by fgetl command.
- After skipping five line converting the string to number and get local low temp. , local mid temp. & local high temp.
- Then we use for loop to get 53 spices.
- Then write a code to parsing the 14 cofficients and get 7 higher cofficients and 7 lower cofficients.
- Then give the mollar constant value 'R'.
- Then write linspace command to get temprature range between local low temp to local high temp.
- Then write a code to find the specific heat(cp), Enthalpy(H), Entropy(S).
- Then write a function to calculate molecular weight and print the function.
- Then use mkdir command to create the seprate folder for each species figure.
- Then plot specific heat(Cp) vs temprature(t), Enthalpy(H) vs temprature(t), Entropy(S) vs temprature(t)
- Then use cd command to display the each folder.
- Then use the saveas command to save.
OUTPUTS:-
- PLOT OF Co2:
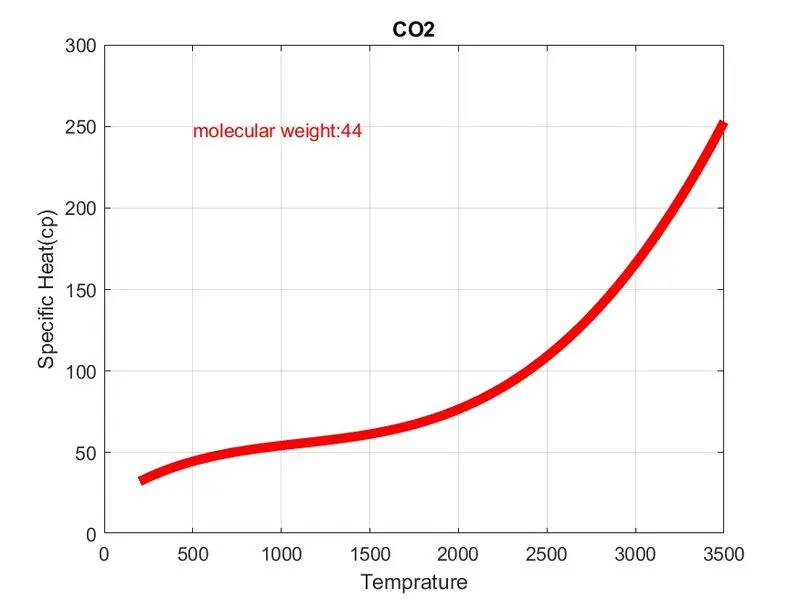
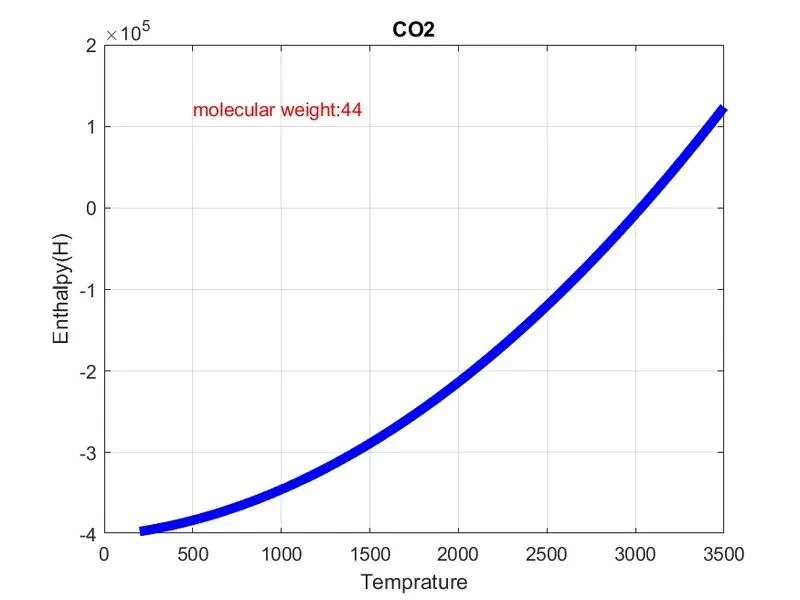
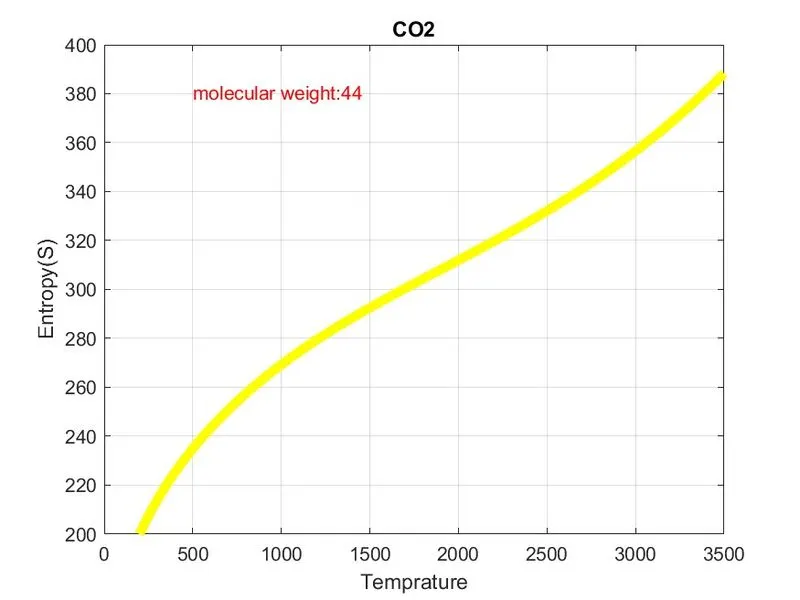
- PLOT FOR N2:
- PLOT FOR CH2: