Project 1 - Parsing NASA thermodynamic data
% Project 1 - Parsing NASA thermodynamic data
% Main code
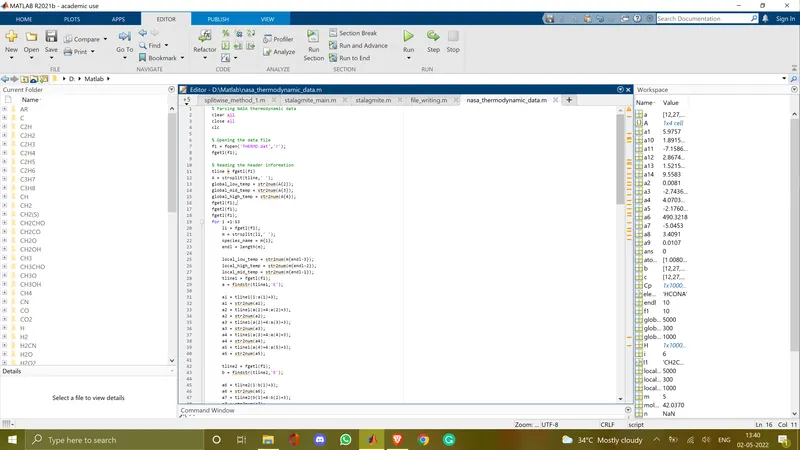
% Parsing NASA thermodynamic data
clear all
close all
clc

% Opening the data file
f1 = fopen('THERMO.dat','r');
fgetl(f1);

% Reading the header information
tline = fgetl(f1)
A = strsplit(tline,' ');
global_low_temp = str2num(A{2});
global_mid_temp = str2num(A{3});
global_high_temp = str2num(A{4});
fgetl(f1);
fgetl(f1);
fgetl(f1);
for i =1:53
    l1 = fgetl(f1);
    m = strsplit(l1,' ');
    species_name = m{1};
    endl = length(m);

    local_low_temp = str2num(m{endl-3});
    local_high_temp = str2num(m{endl-2});
    local_mid_temp = str2num(m{endl-1});
    tline1 = fgetl(f1);
    a = findstr(tline1,'E');

    a1 = tline1(1:a(1)+3);
    a1 = str2num(a1);
    a2 = tline1(a(1)+4:a(2)+3);
    a2 = str2num(a2);
    a3 = tline1(a(2)+4:a(3)+3);
    a3 = str2num(a3);
    a4 = tline1(a(3)+4:a(4)+3);
    a4 = str2num(a4);
    a5 = tline1(a(4)+4:a(5)+3);
    a5 = str2num(a5);

    tline2 = fgetl(f1);
    b = findstr(tline2,'E');

    a6 = tline2(1:b(1)+3);
    a6 = str2num(a6);
    a7 = tline2(b(1)+4:b(2)+3);
    a7 = str2num(a7);
    a8 = tline2(b(2)+4:b(3)+3);
    a8 = str2num(a8);
    a9 = tline2(b(3)+4:b(4)+3);
    a9 = str2num(a9);
    a10 = tline2(b(4)+4:b(5)+3);
    a10 = str2num(a10);

    tline3 = fgetl(f1);
    c = findstr(tline3,'E');

    a11 = tline3(1:c(1)+3);
    a11 = str2num(a11);
    a12 = tline3(c(1)+4:c(2)+3);
    a12 = str2num(a12);
    a13 = tline3(c(2)+4:c(3)+3);
    a13 = str2num(a13);
    a14 = tline3(c(3)+4:c(4)+3);
    a14 = str2num(a14);

    % Calculating Cp,H and S
    T = linspace(local_low_temp,local_high_temp,1000);
    R = 8.314;

    if(T>local_mid_temp)
        % High temperature coefficients
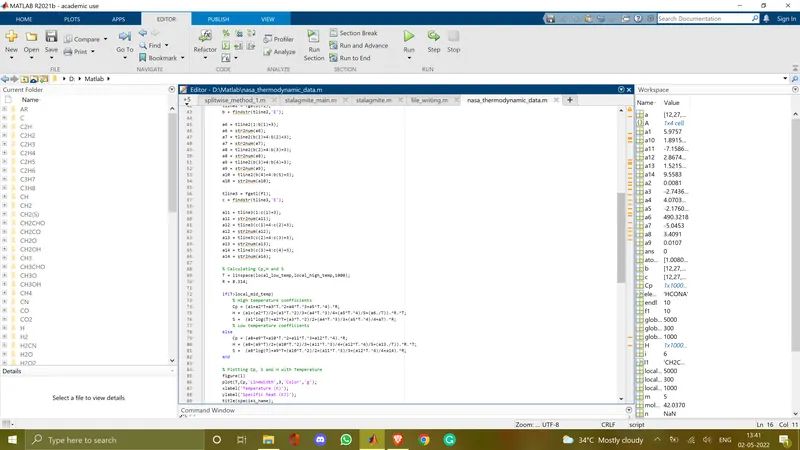
        Cp = (a1+a2*T+a3*T.^2+a4*T.^3+a5*T.^4).*R;
        H = (a1+(a2*T)/2+(a3*T.^2)/3+(a4*T.^3)/4+(a5*T.^4)/5+(a6./T)).*R.*T;
        S =  (a1*log(T)+a2*T+(a3*T.^2)/2+(a4*T.^3)/3+(a5*T.^4)/4+a7).*R;
        % Low temperature coefficients
    else
        Cp = (a8+a9*T+a10*T.^2+a11*T.^3+a12*T.^4).*R;
        H = (a8+(a9*T)/2+(a10*T.^2)/3+(a11*T.^3)/4+(a12*T.^4)/5+(a13./T)).*R.*T;
        S =  (a8*log(T)+a9*T+(a10*T.^2)/2+(a11*T.^3)/3+(a12*T.^4)/4+a14).*R;
    end

    % Plotting Cp, S and H with Temperature
    figure(1)
    plot(T,Cp,'LineWidth',3,'Color','g');
    xlabel('Temperature (K)');
    ylabel('Specific heat (KJ)');
    title(species_name);
    grid on
    figure(2)
    plot(T,S,'LineWidth',3,'Color','b');
    xlabel('Temperature (K)');
    ylabel('Entropy (KJ/mol-K)');
    title(species_name);
    grid on
    figure(3)
    plot(T,H,'linewidth',3,'Color','r');
    xlabel('Temperature (T)');
    ylabel('Enthalphy (kJ/mol)');
    title(species_name);
    grid on

    % Creating and saving in a folder
    mkdir(species_name);
    cd(species_name);
    saveas(1,'SpecificHeat','jpg');
    saveas(2,'Entropy','jpg');
    saveas(3,'Enthalpy','jpg');

    cd ..

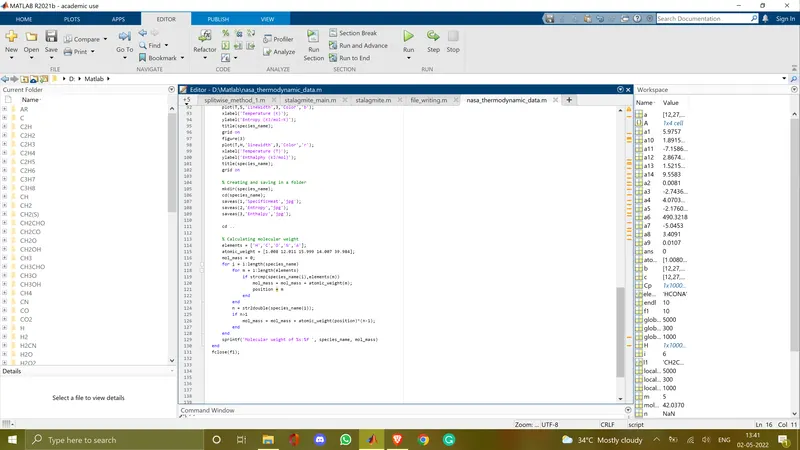
    % Calculating molecular weight
    elements = ['H','C','O','N','A'];
    atomic_weight = [1.008 12.011 15.999 14.007 39.984];
    mol_mass = 0;
    for i = 1:length(species_name)
        for m = 1:length(elements)
            if strcmp(species_name(i),elements(m))
                mol_mass = mol_mass + atomic_weight(m);
                position = m
            end
        end
        n = str2double(species_name(i));
        if n>1
            mol_mass = mol_mass + atomic_weight(position)*(n-1);
        end
    end
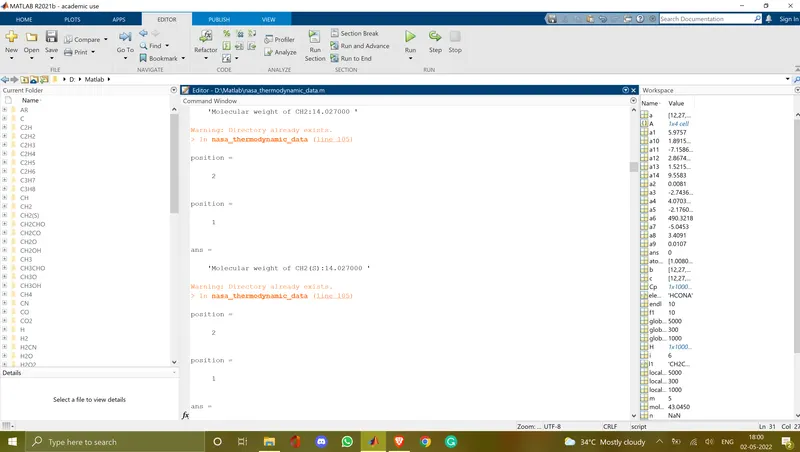
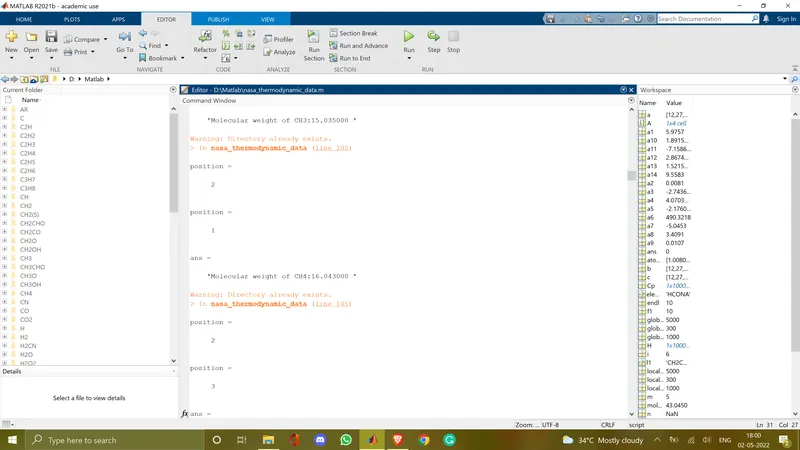
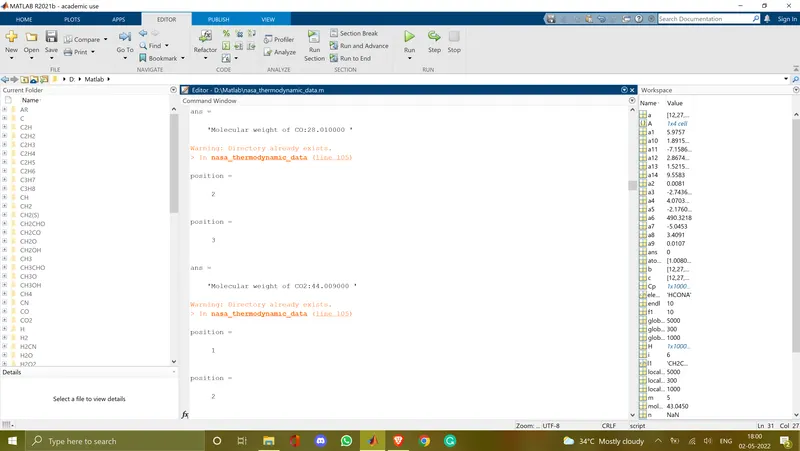
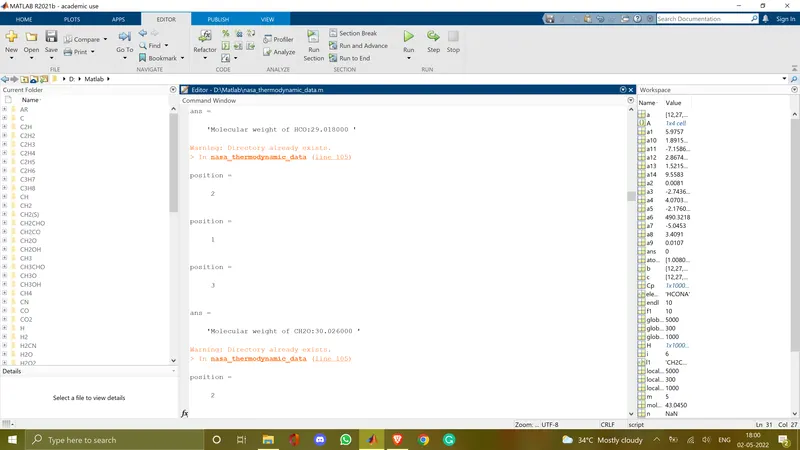
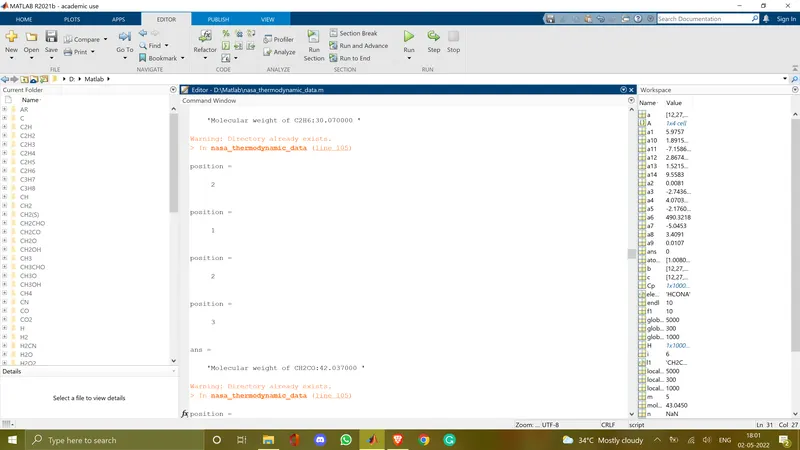
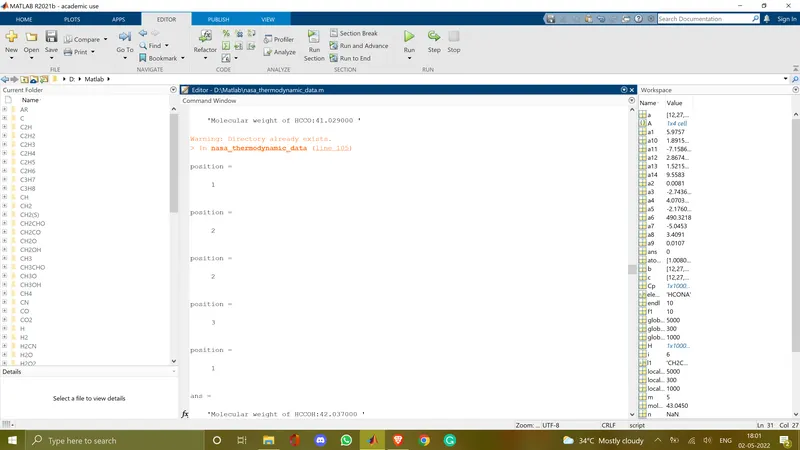
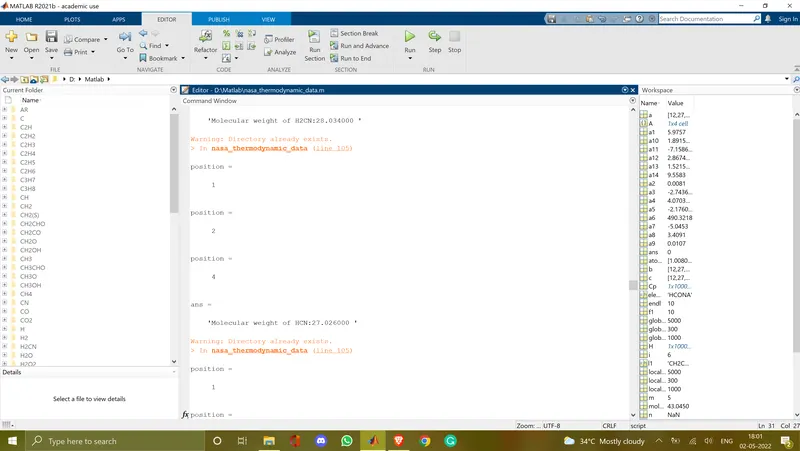
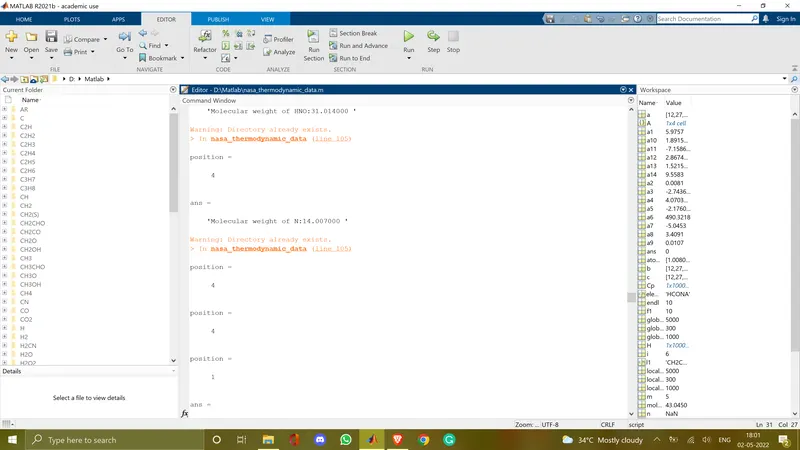
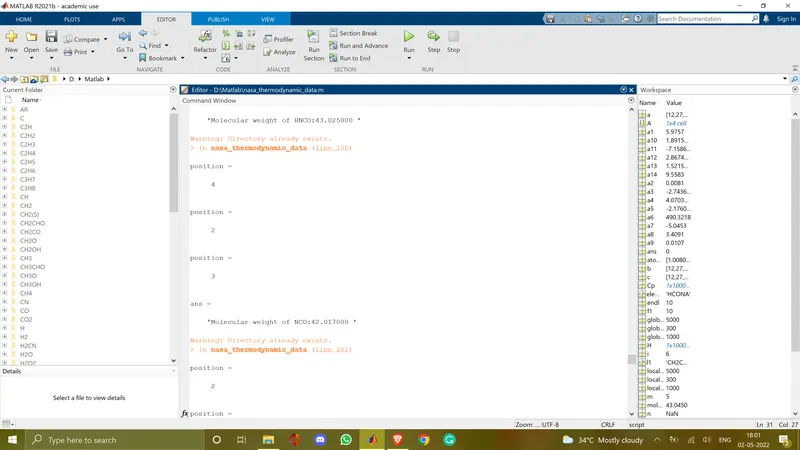
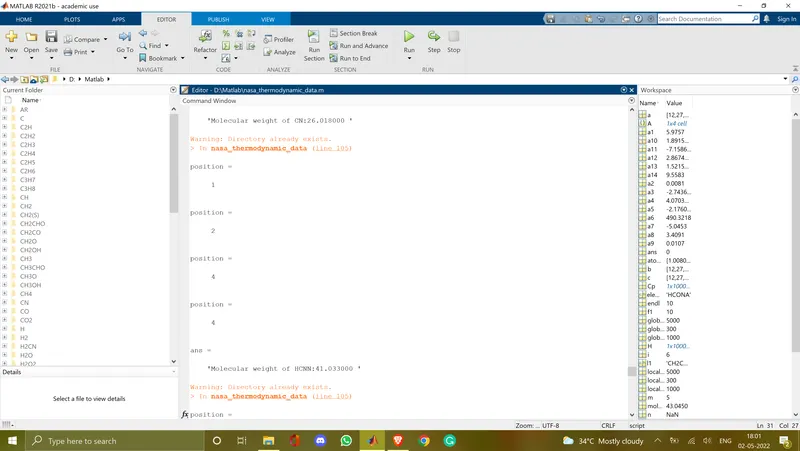
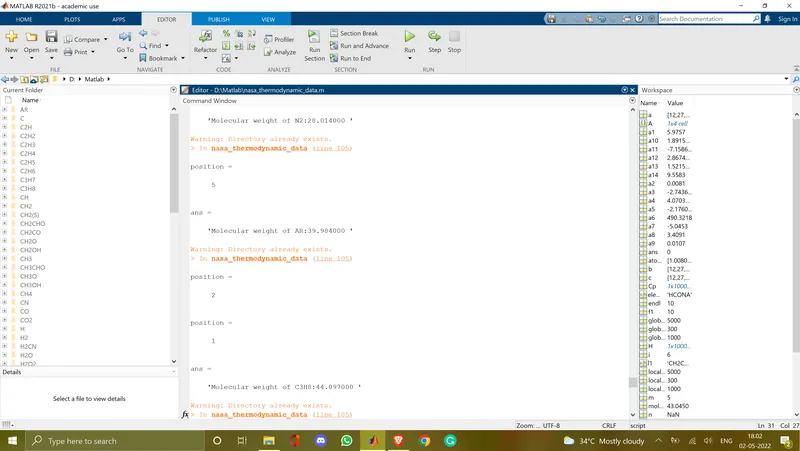
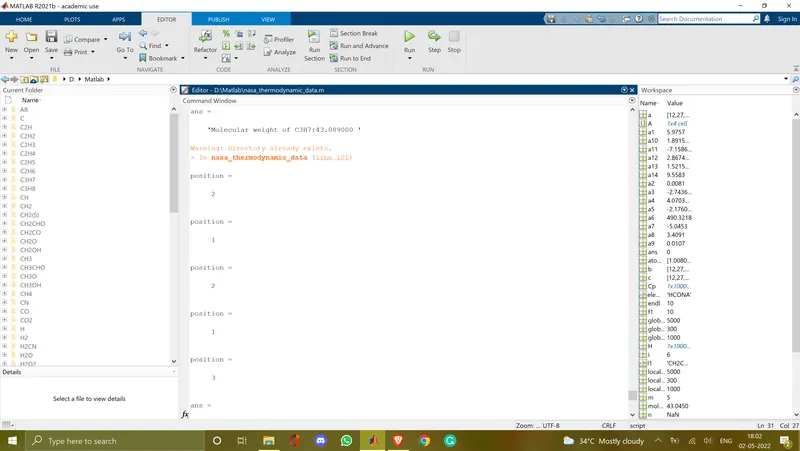
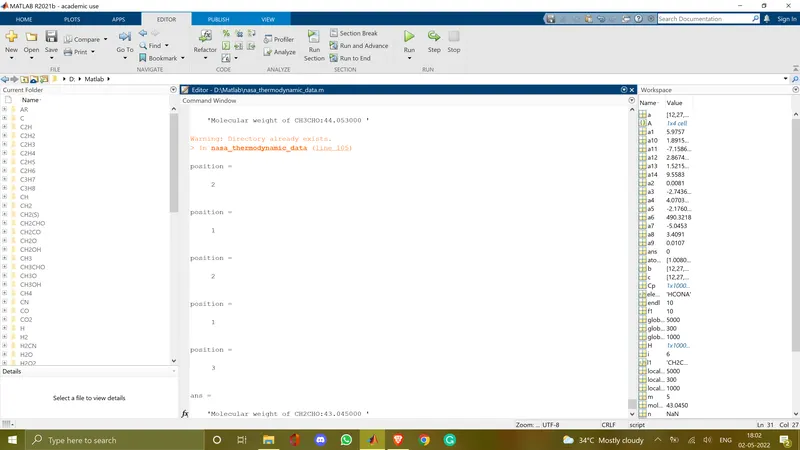
    sprintf('Molecular weight of %s:%f ', species_name, mol_mass)
end
fclose(f1);
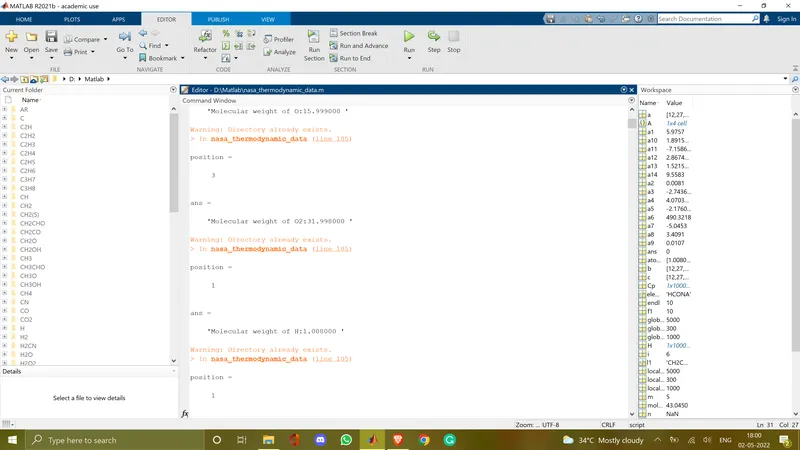
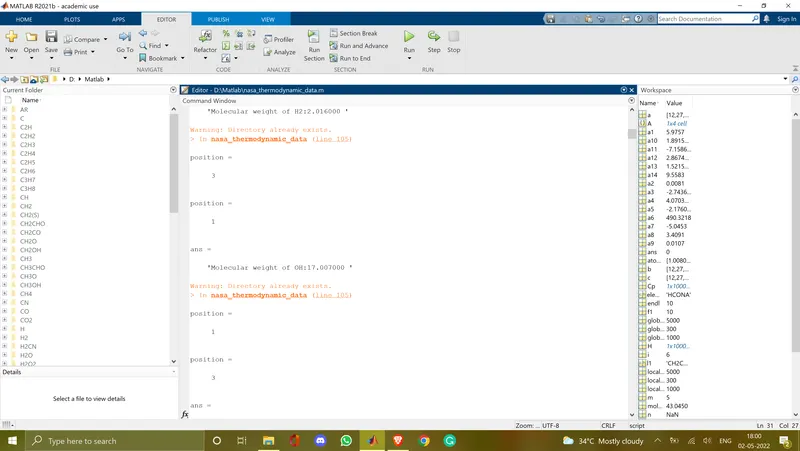
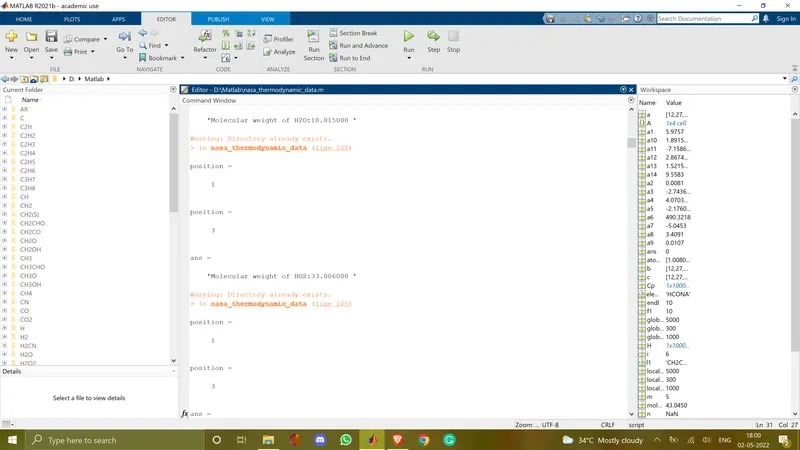
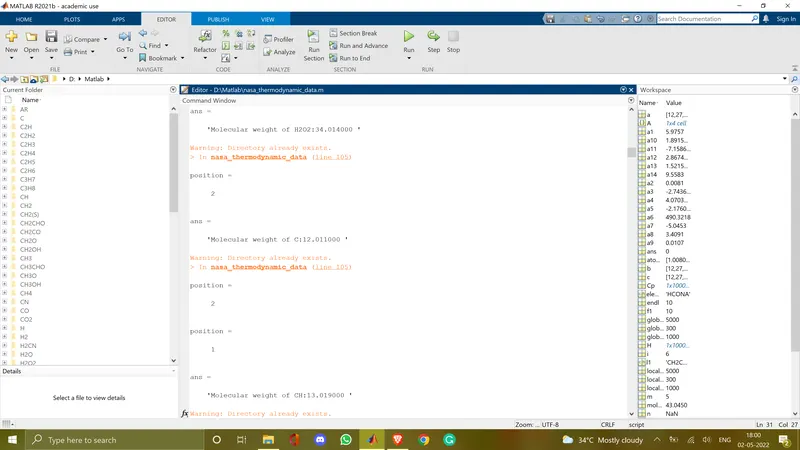
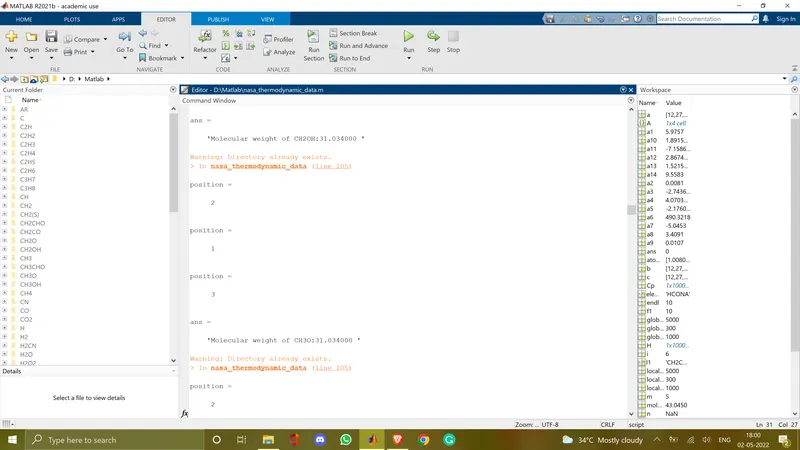
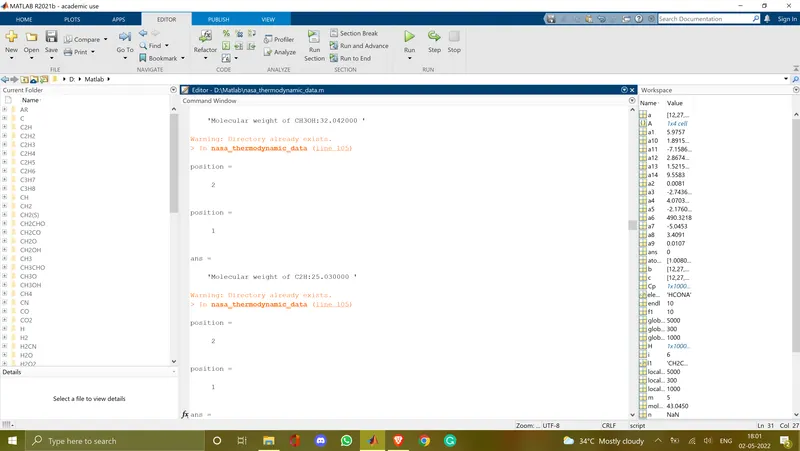
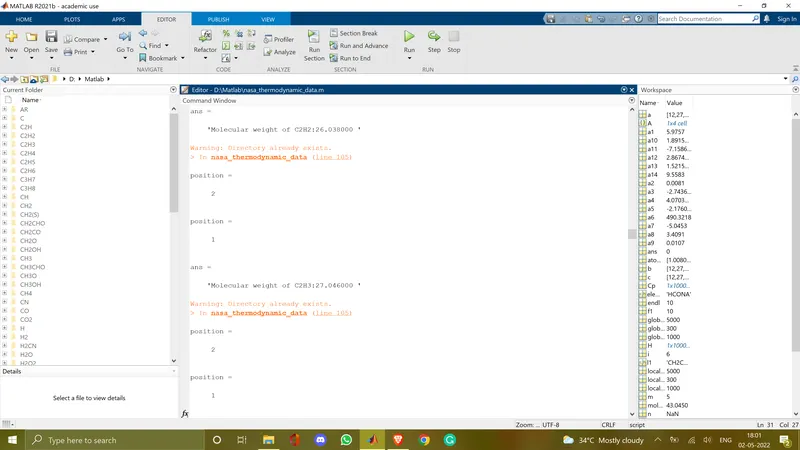
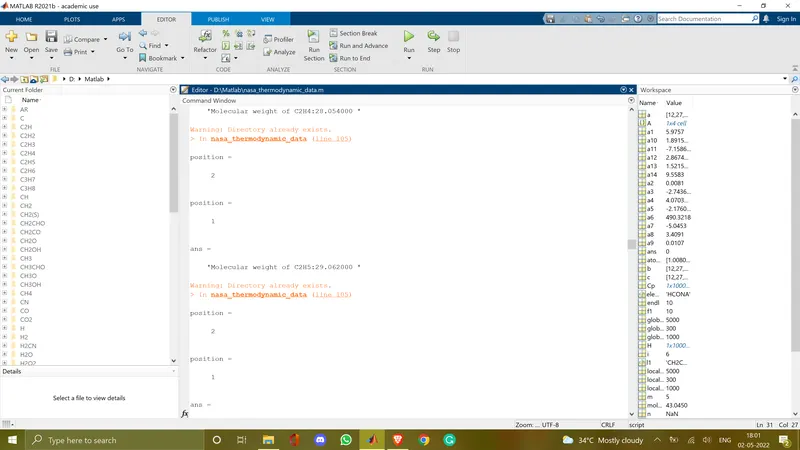
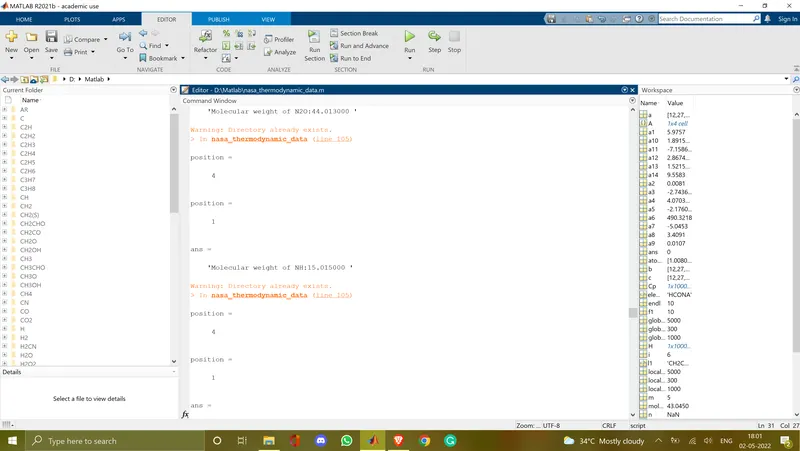
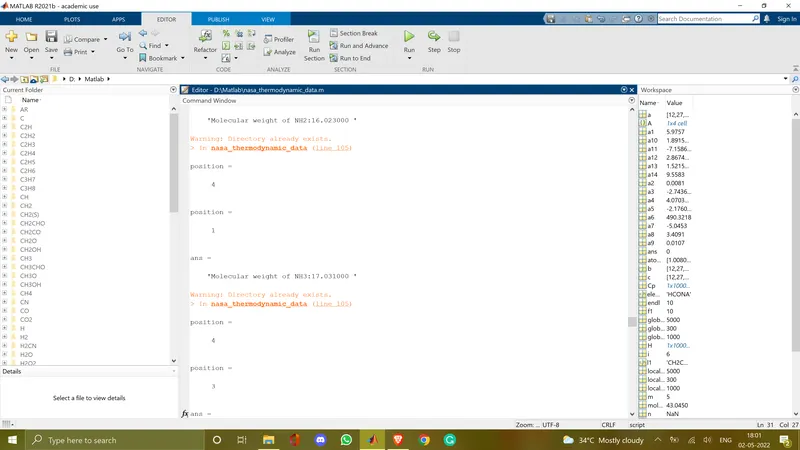
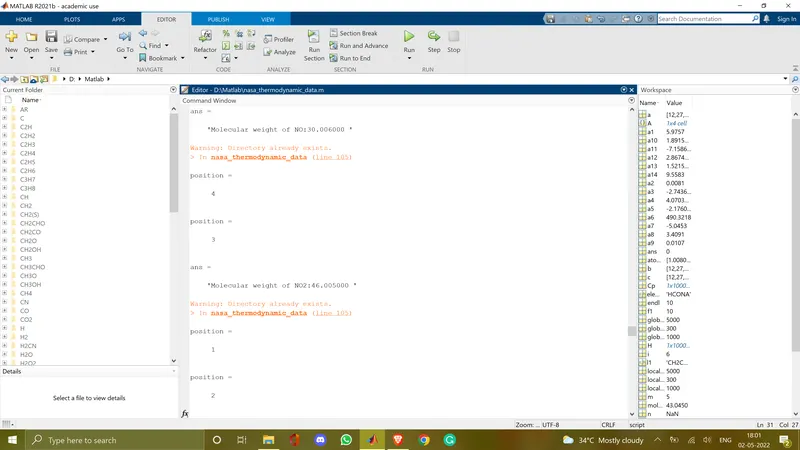
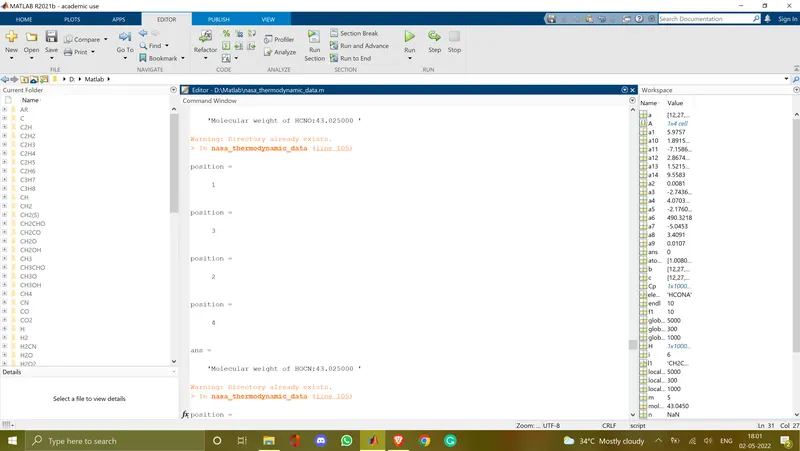
% Screenshots
% Explanation
- To start the program with clear all which clears the workspace, close all which closes all the previous plots, and clc which clears the command window.
- Now 'THERMO.dat' file is opened using fopen command. And the lines of this file were read and extracted using fgetl command.
- The strsplit command is used to split string on the element of delimeter. Global low, mid and high temperatures are read and stored in global_low_temp, global_mid_temp and global_high_temp. We use str2num command to convert strings into numbers.
- We have 53 species and 14 coefficients, using forloop the name of species and their coefficient is extracted.
- Next we calculate the values of Cp, H and S for high temperature coefficients and low temperature coefficients. We use if else condition to calculate it.
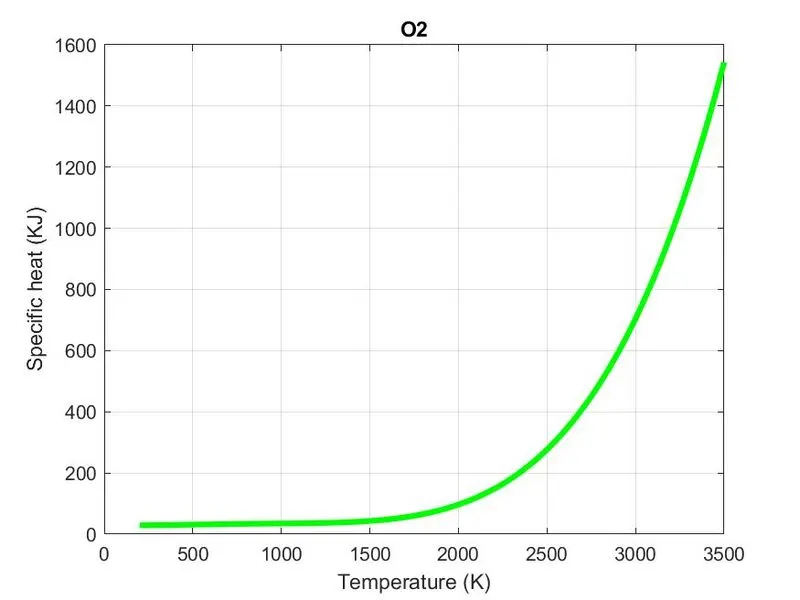
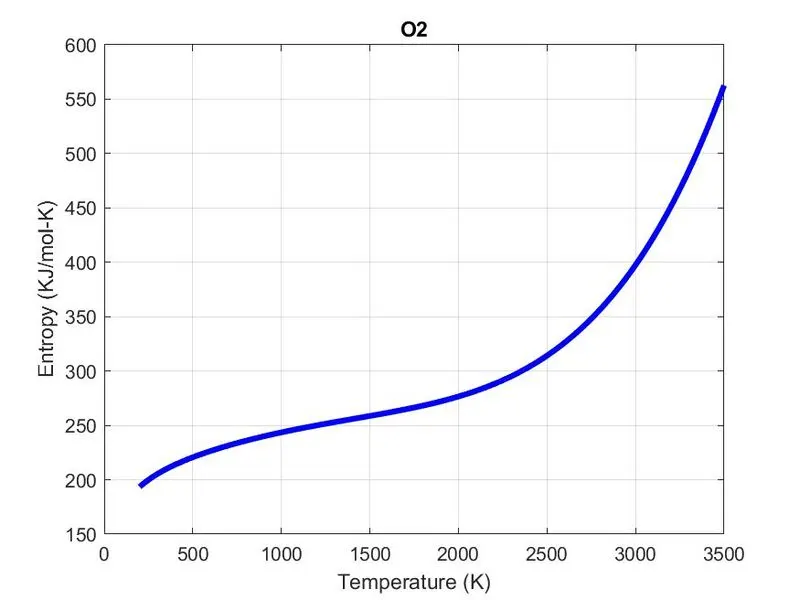
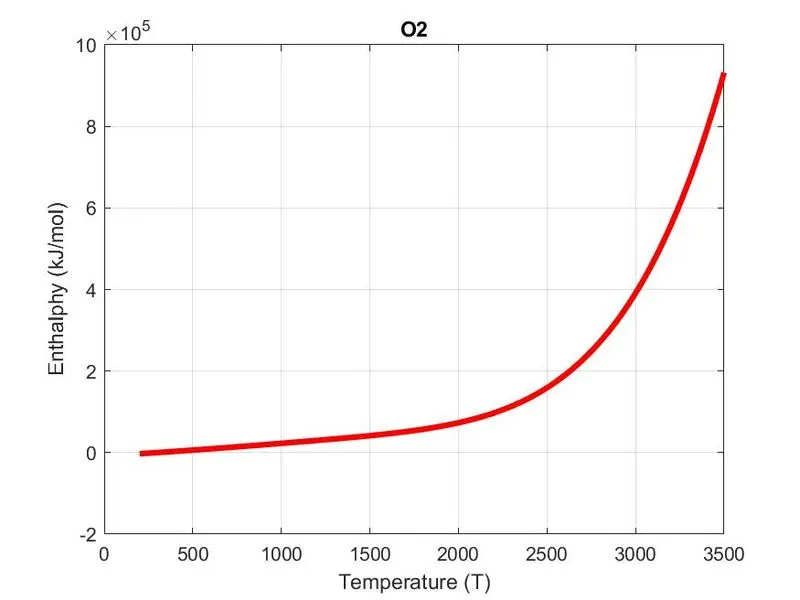
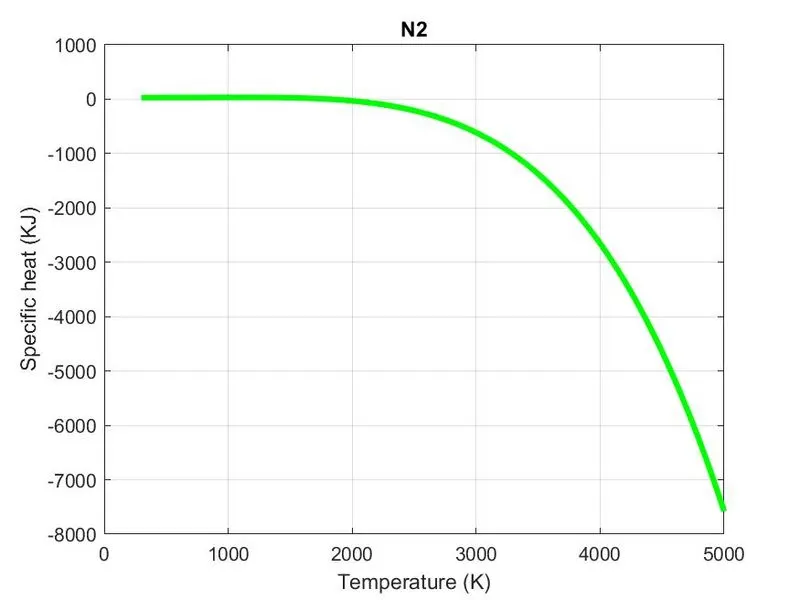
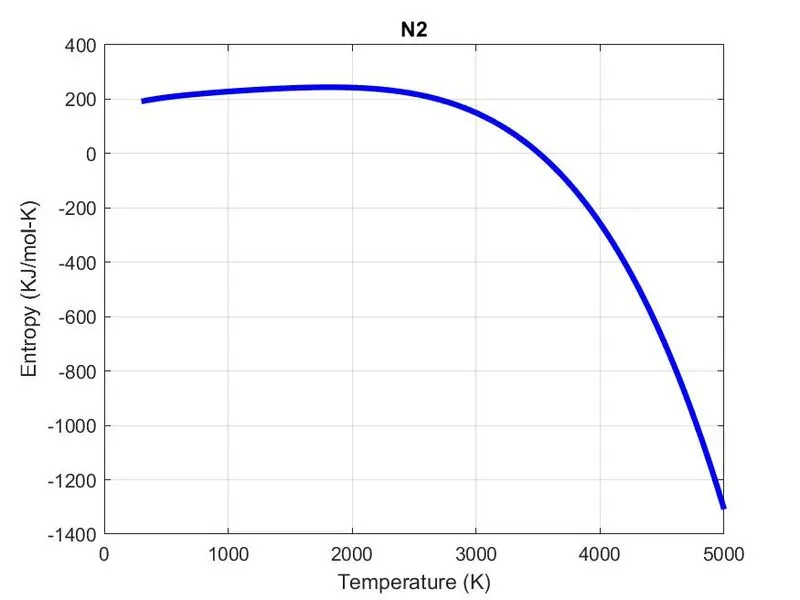
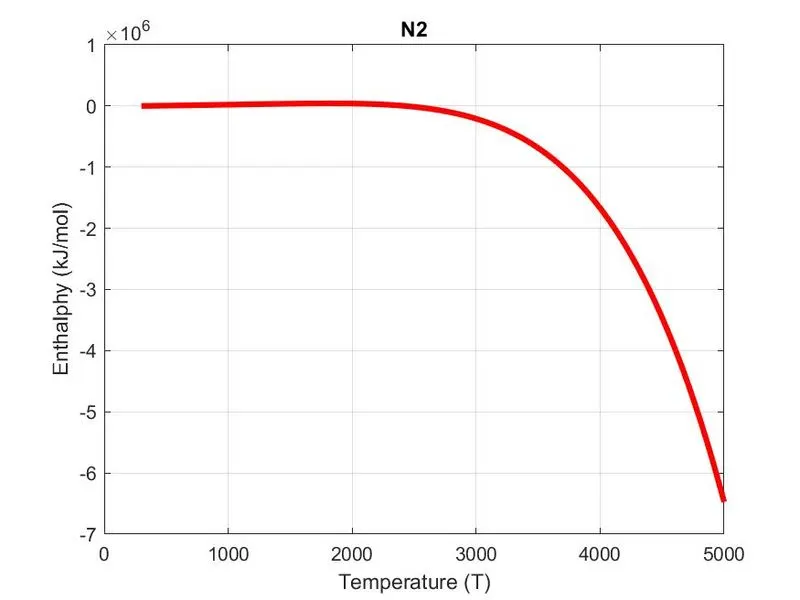
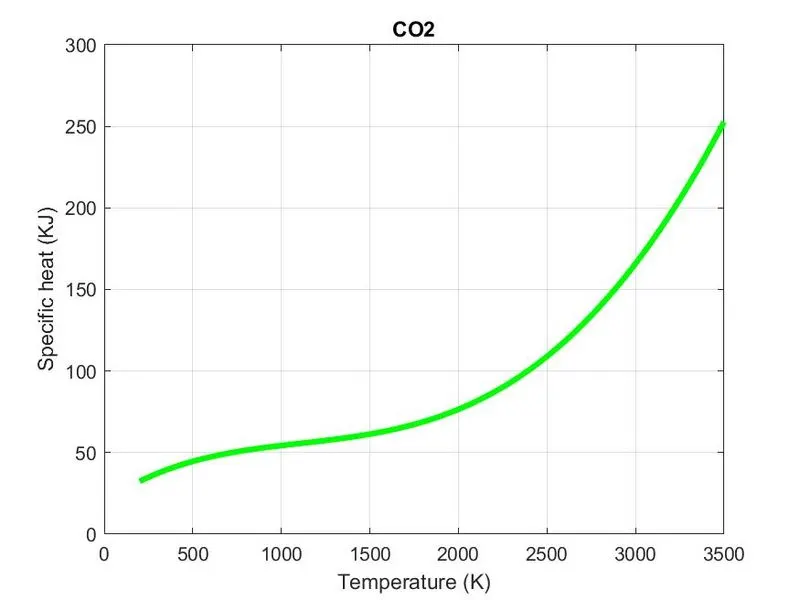
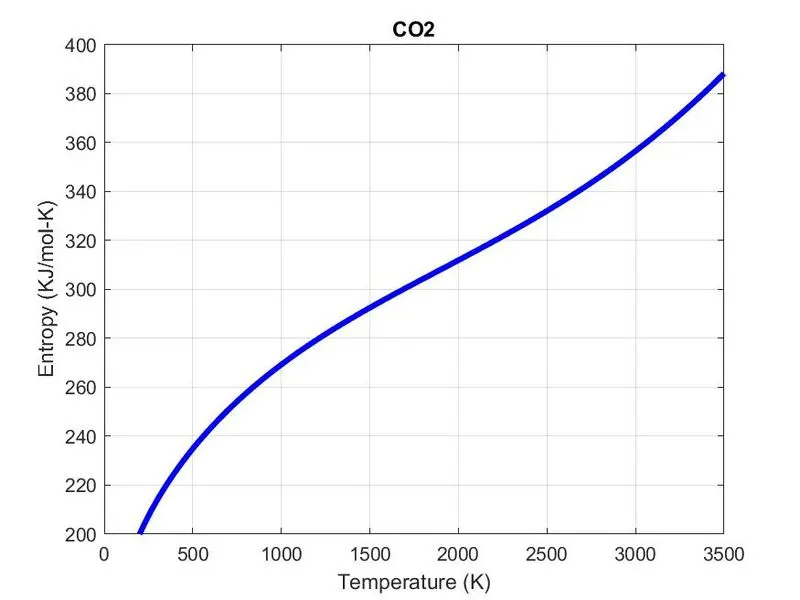
- Next we plot Cp, S and H with temperature with the help of plot command.
- Now we use mkdir command to create a new folder.
- cd command is used to change current folder.
- Saveas command is used to save figure for specific file format.
- Next we calculate molecular weight of the species. We define the main elements of all 53 species in an array elements that are - ' H C O N A'.
- Then by taking above main elements we will create their atomic_weight array that are - 1.008 12.011 15.999 14.007 39.948.
- Molecular weight initially set to 0. Then we create a for loop condition which runs to the length of the species_name and an another for loop is created by us which runs to the lenght of the string elements.
- Next we use if condition and strcmp command to compare the species_name and elements strings to calculate molecular mass, if by comparison both strings found same then we will assign its molecular weight.
- We use sprintf command to print the molecular weight .
% Plots of Cp, S and H with Temperature of the species O2 N2 CO2 respectively
% O2
% Specific Heat vs Temperature
% Entropy vs Temperature
% Enthalpy vs Temperature
% N2
% Specific Heat vs Temperature
% Entropy vs Temperature
% Enthalpy vs Temperature
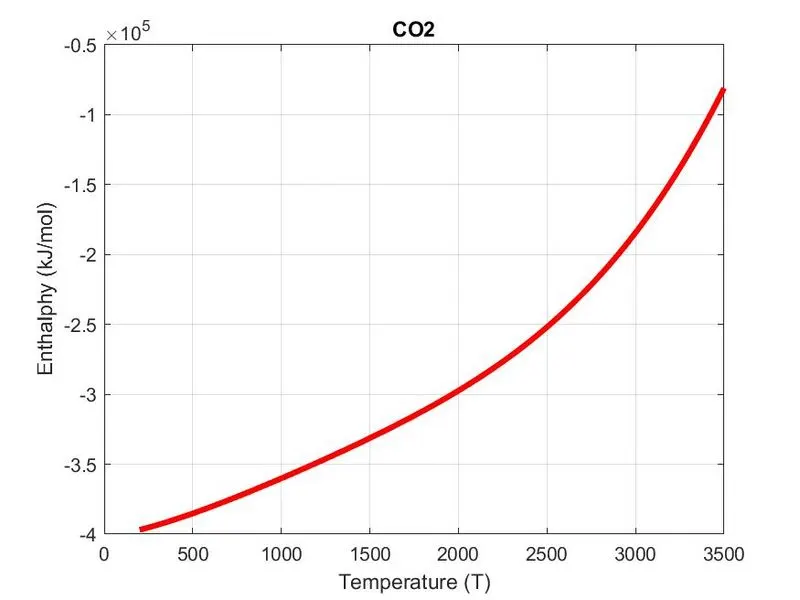
% CO2
% Specific Heat vs Temperature
% Entropy vs Temperature
% Enthalpy vs Temperature
% Window where all the species folders are saved

% Molecular weight of the species