AIM:
To write a code in matlab to parsing NASA thermodynamic data file and calculate the thermodynamic properties of various gas species.
FILE PARSING:
File parsing refers to how information can be read from a particular text file or any type of file and how that information can be used in a computer program.
FORMULA:
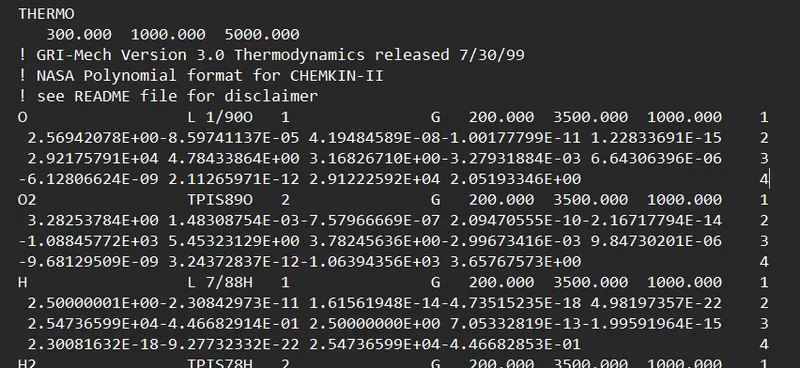
This formula to calculate the specific heat, enthalpy and entropy.

NASA THERMO. DATA FILE
SPECIFIC HEAT:
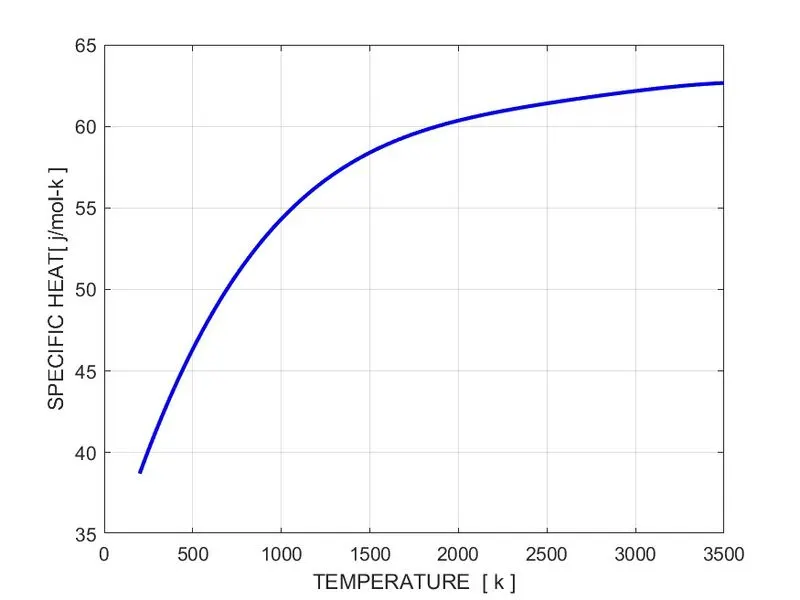
Specific heat, the quantity of heat required to rise the temperature of one gram of substance by one celsius degree. The units of specific heat are usally calories or joules per gram per celsius degree.
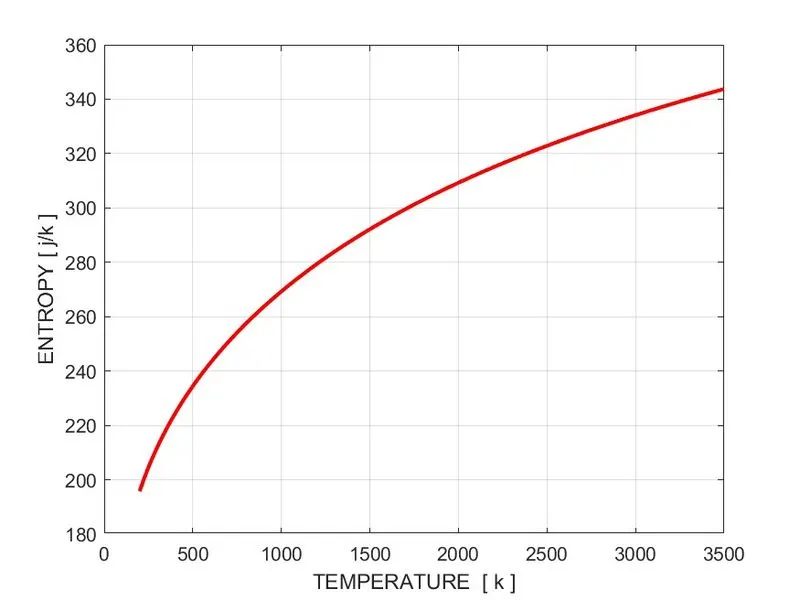
ENTROPY:
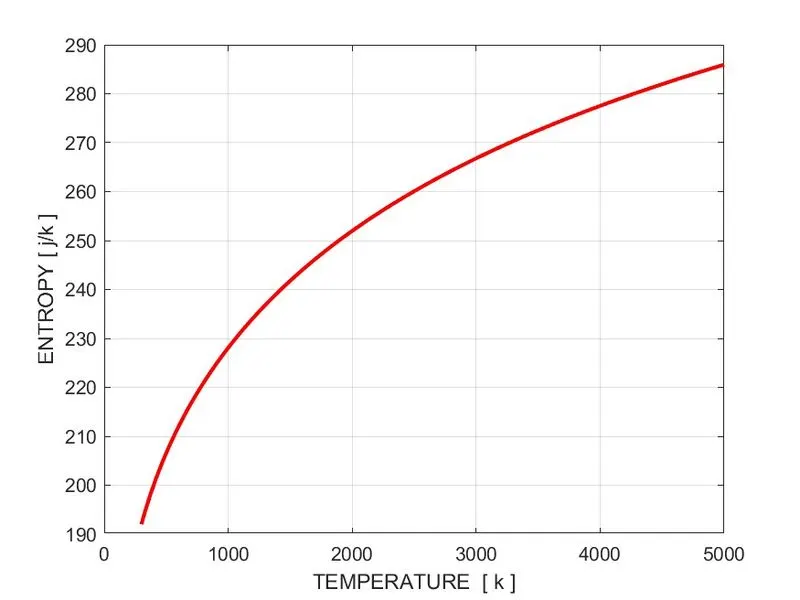
Entropy, the measure of a system's thermal energy per unit temperature that is unavailable for doing useful work. Because work is obtained from ordered molecular motion, the amount of entropy is also a molecular of the molecular dis order, or randomness of a system,
ENTHALPY:
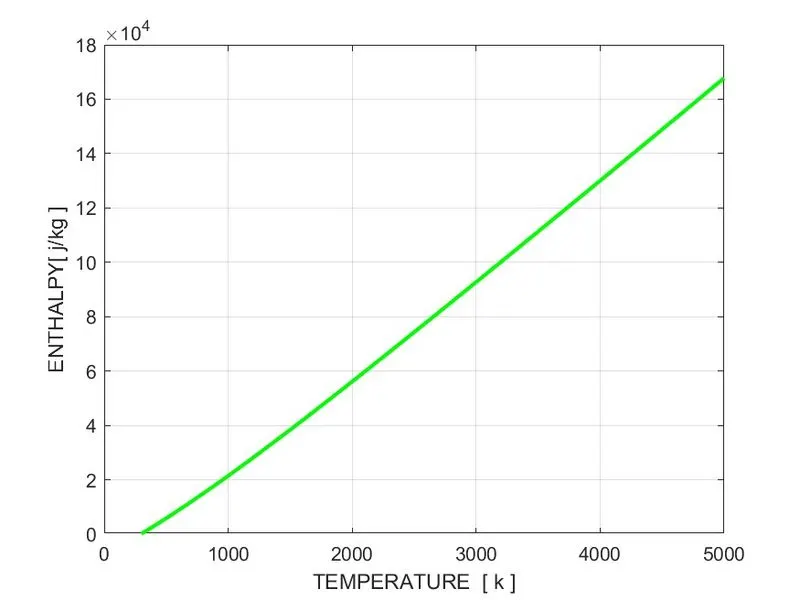
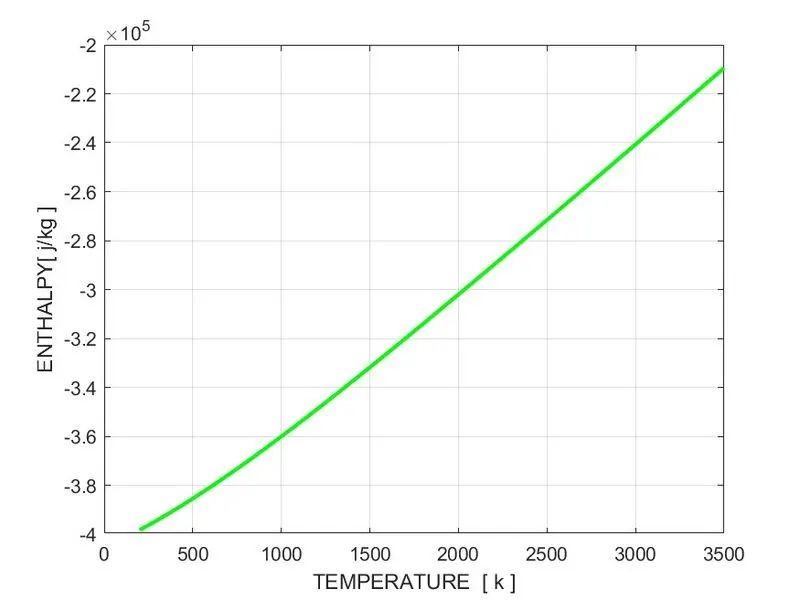
Enthalpy change of a system is equal to the heat absorbed or evolved by the system at constant pressure. A alomst of the reaction are carried out at constant pressure, the measured value of the heat evolved or absorbed is the enthalpy change entalpy.
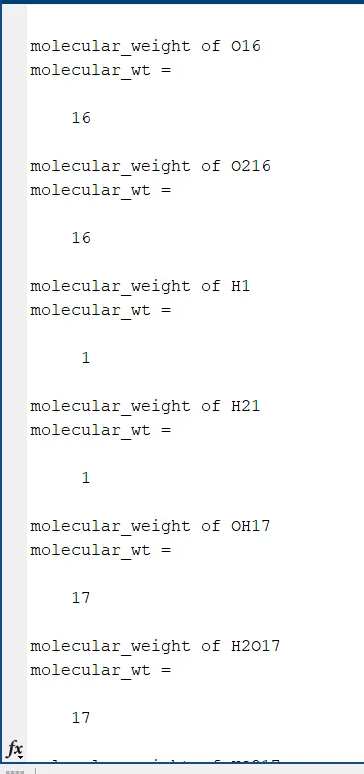
MOLECULAR WEIGHT:
Molecular weight is the measure of the sumof the atomic weight values of the atoms in a melecular. Molecular weight is used in chemistry to detemine stoichiomerty in chemical reactions and equations. Molecular weight is either unitless or expressed in terms of atomic mass units (amu) or Daltons (Da).
PROCEDURE:
- since the program is made with parameters such as gas constant coefficient and temperature values.
- The main program, gas constant is defind as the file THERMO.dat is opend using fopen command.
- Then use fgetl is used to read each and every line as per requirement for parsing.
- Next use the strsplit command, split the values after reading through fgetl.
- Then srtdouble is used to convert the str to numbers with double precision.
- A for loop is used to skip the commands.
- An another for loop used to read the values from as per the convinience.
- then use mkdir command is used to create new directory.
- Temperature is discretized using linspace and function call is made.
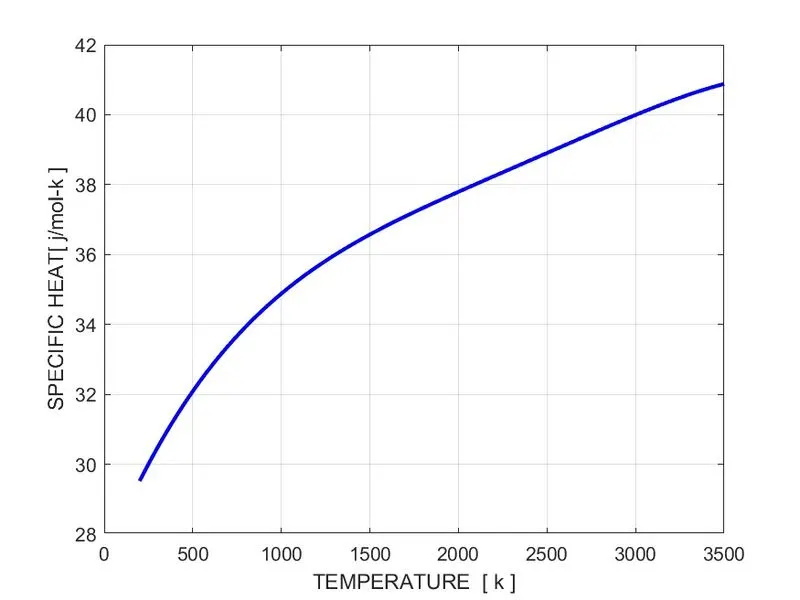
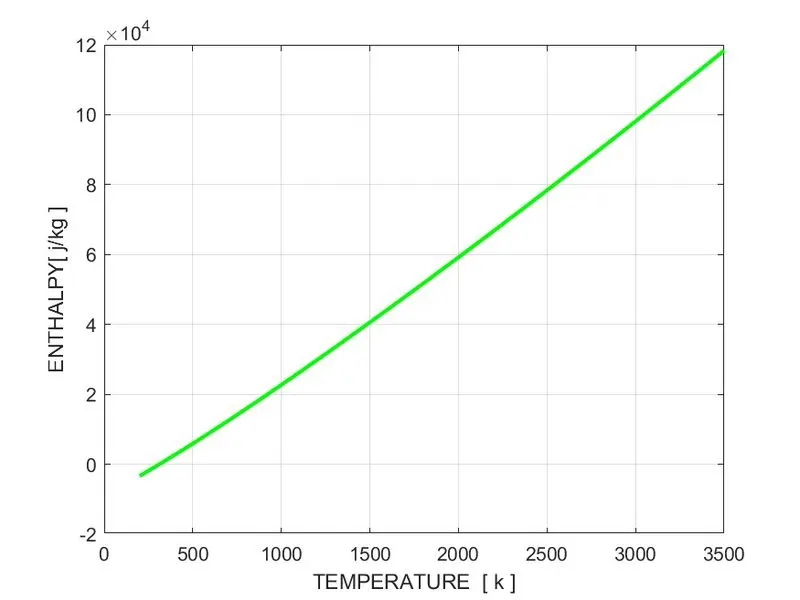
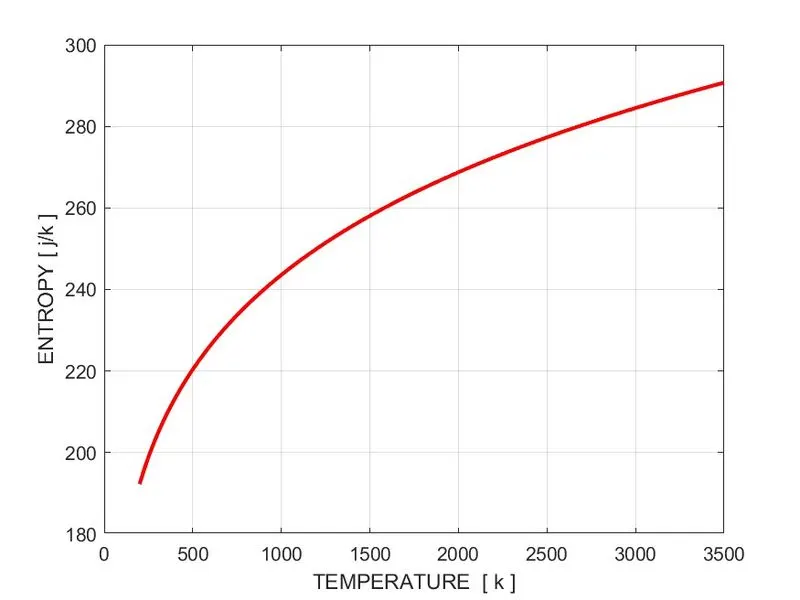
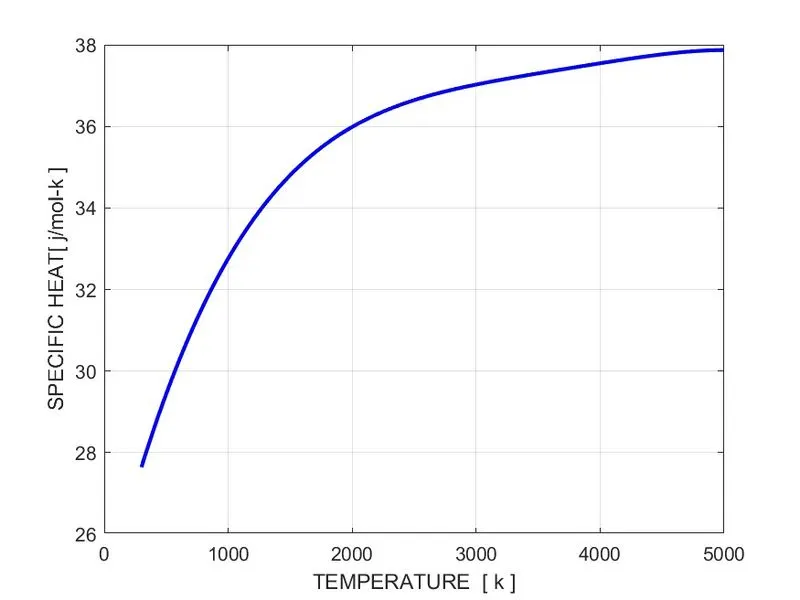
- Plotting is done for specific heat, enthalpy, entropy.
- Now molecular weight is calculated for each species.
PROGRAM CODE:
MAIN CODE;
clear all
close all
clc
% Reading the data file
file = fopen("THERMO .dat","r")
tline=fgetl(file);
% input gas constant
R = 8.314
% Getting temp
tline1 = fgetl(file);
temp= strsplit(tline1,' ');
%global temp
global_low_temp = str2double(temp{2});
global_mid_temp = str2double(temp{3});
global_high_temp = str2double(temp{4});
% skip the command
for i = 1:3
comment=fgetl(file);
end
% Reading the species
for j = 1:53
tline2 = fgetl(file);
A = strsplit(tline2,' ');
species = (A{1});
a = strfind(tline2,'G');
loctemp = tline2(a+4:length(tline2));
ltemp = strsplit(loctemp,' ');
l_low_temp = str2double(ltemp{end-3});
l_mid_temp = str2double(ltemp{end-1});
l_high_temp = str2double(ltemp{end-2});
line1 = fgetl(file);
a = strfind(line1,'E');
a1 = str2double(line1(1:(a(1)+3)));
a2 = str2double((line1(a(1)+4:a(2)+3)));
a3 = str2double((line1(a(2)+4:a(3)+3)));
a4 = str2double((line1(a(3)+4:a(4)+3)));
a5 = str2double((line1(a(4)+4:a(5)+3)));
line2 = fgetl(file);
b = strfind(line2,'E');
a6 = str2double(line2(1:(b(1)+3)));
a7 = str2double((line2(b(1)+4:b(2)+3)));
a8 = str2double((line2(b(2)+4:b(3)+3)));
a9 = str2double((line2(b(3)+4:b(4)+3)));
a10 = str2double((line2(b(4)+4:b(5)+3)));
line3 = fgetl(file);
c = strfind(line3,'E');
a11 = str2double(line3(1:(c(1)+3)));
a12 = str2double((line2(c(1)+4:c(2)+3)));
a13 = str2double((line2(c(2)+4:c(3)+3)));
a14 = str2double((line2(c(3)+4:c(4)+3)));
T = linspace(l_low_temp,l_high_temp,1000);
[cp, H, S] =file_parsing (R,a1,a2,a3,a4,a5,a6,a7,a8,a9,a10,a11,a12,a13,a14,T,l_mid_temp);
% Saving floder
cd('C:\Users\VIGNESH\Documents\MATLAB\thermo');
mkdir(species);
cd(species);
%plotting
figure(1)
plot(T,cp,'LineWidth',2,'Color','b');
xlabel('TEMPERATURE [ k ]' );
ylabel('SPECIFIC HEAT[ j/mol-k ]');
grid on
saveas(figure(1),'cp.jpg');
figure(2)
plot(T,H,'LineWidth',2,'Color','g');
xlabel('TEMPERATURE [ k ]' );
ylabel('ENTHALPY[ j/kg ]');
grid on
saveas(figure(2),'H.jpg');
figure(3)
plot(T,S,'LineWidth',2,'Color','r');
xlabel('TEMPERATURE [ k ]' );
ylabel('ENTROPY [ j/k ]');
grid on
saveas(figure(3),'S.jpg');
cd('C:\Users\VIGNESH\Documents\MATLAB\thermo');
molecular_wt = molecular_weight(species)
end
fclose(file)
FUNCTION CODE FOR CP, H, S:
function [cp, H, S] =file_parsing (R,a1,a2,a3,a4,a5,a6,a7,a8,a9,a10,a11,a12,a13,a14,T,l_mid_temp);
if T<=l_mid_temp
cp = (a8 + a9.*T + a10.*T.^2 + a11.*T.^3 + a12.*T.^4).*R;
H = (a8 + a9.*T./2 + a10.*T.^2./3 + a11.*T.^3./4 + a12.*T.^4./5 + a13./T).*R.*T;
S = (a8.*log(T) + a9.*T + a10.*T.^2/2 + a11.*T.^3/3 + a12.*T.^4/4 + a14).*R;
else
cp = (a1 + a2.*T + a3.*T.^2 + a4.*T.^3 + a5.*T.^4).*R;
H = (a1 + a2.*T./2 + a3.*T.^2./3 + a4.*T.^3./4 + a5.*T.^4./5 + a6./T).*R.*T;
S = (a1.*log(T) + a2.*T + a3.*T.^2/2 + a4.*T.^3/3 + a5.*T.^4/4 + a7).*R;
end
end
FUNCTION CODE FOR MOLECULAR WEIGHT:
function [w] = molecular_weight(species)
atomic_name =['O','H','C','N','A'];
atomic_weight = [16 1 12 14 40];
%molecuar_mass
w = 0;
for i = 1:length(species)
for j = 1:length(atomic_name)
if strcmp(species(i),atomic_name(j))
w = w + atomic_weight(j);
location = j;
end
end
n = str2double(species);
if n>1
w = w + atomic_weight(location) *(n-1);
end
end
fprintf('molecular_weight of %s',species);
fprintf('%d',w);
end
OUTPUTS PLOTS :
O2 PLOTS
PLOTS FOR N2
PLOTS FOR CO2
MOLECULAR WEIGHT: