Project 1 - Parsing NASA thermodynamic data
FILE PRASING:
It is the method of breaking down the file into pieces of data and can be stored and easily manipulated.In our project we are breaking down the strings from the given dat file and converting it into the required data like numbers.
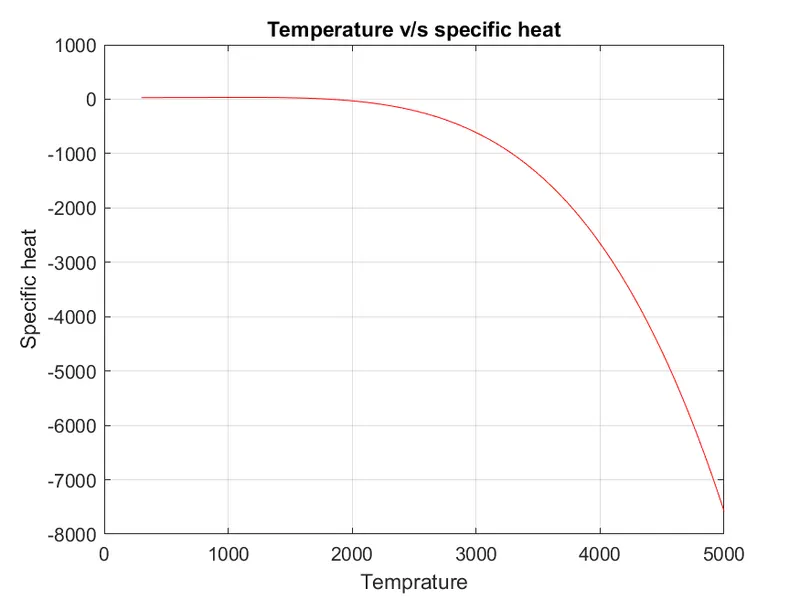
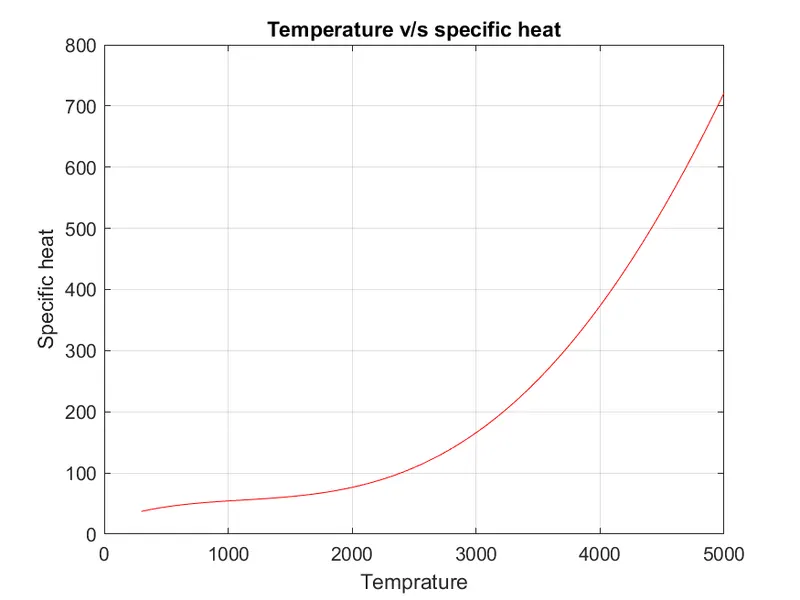
Specific heat:It is the amount of heat required to raise the temperature of body per unit mass.

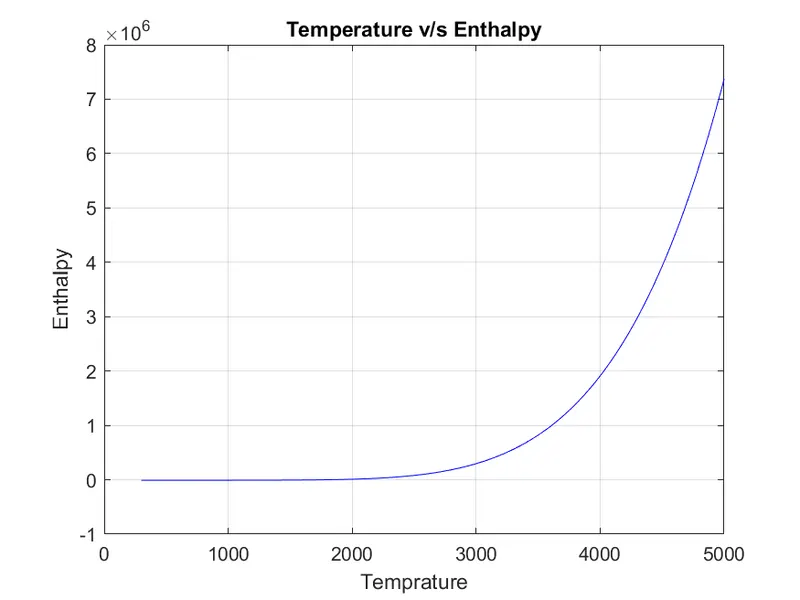
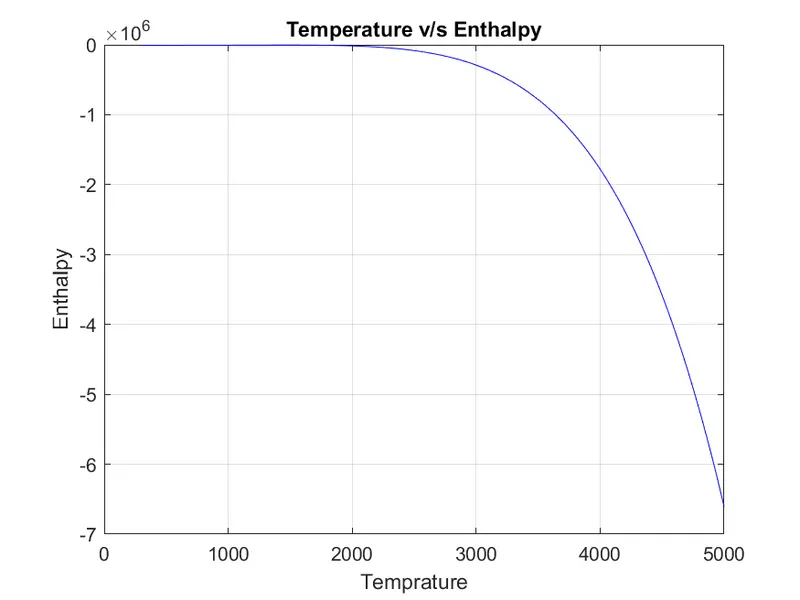
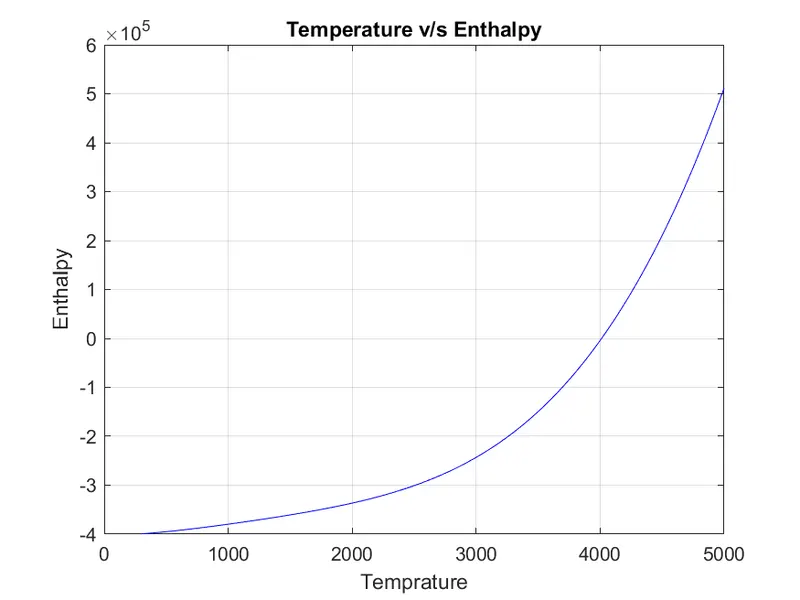
Enthalpy:Measure of energy in the thermodynamic system.Thermodynamic quantity equivalent to the total heat content of a system.
H=U+PV

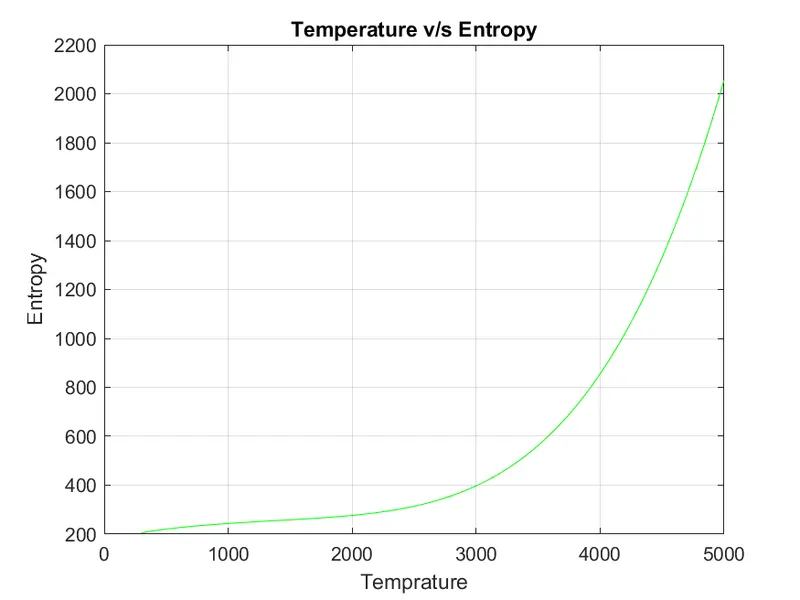
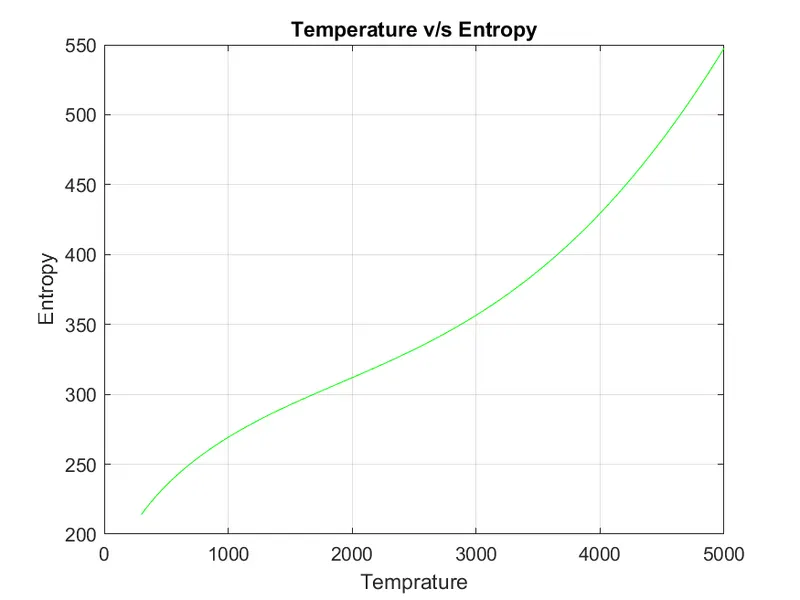
Entropy: It is the degree of randomness of a perticular material /object

1.Step-wise explanation of your code.
- Use of the command 'clear all','close all','clc' is used to erase all the previously programmed workspace,graphs & command window.
- opening the available file in read mode using the command fopen and assining it to the pointer f1.
- reading the first line of the file using fgetl command
- Extracting the global temperatures using fgetl command from the line2
- Breaking down the lines to individual variable using 'strsplit' command.
- Converting the splitted character into numbers using 'str2num' command and storing the individual global temperature.
- Mention of the universal gas constant
- Omitting the comment lines by using fgetl in the for loop
- Fetching the next line using 'fgetl' and reading the species name using 'strtok'
- Extracting the coefficients from the next 3 lines and finding the element 'E' position in the line so, as to get the character using 'strfind' command
- Converting those character into number using 'str2num' and assigning it to pointers like a1,a2....a14.
- Calling the functions of specific heat,Enthalpy,Entropy & Molecular Weight in the current program.These functions are previously programmed.
- Plotting the graphs of the formulated specific heat,enthalpy & entropy with respect to temperature for each species mentioned in the file.
- Saving the formed graphs in a folder in such a way that graphs of the perticular species is put in a folder and name the folder with the element name .
- The commands used during above process are : 'cd'-To create new folders for every iteration, 'mkdir'-To provide name for folder created, 'saveas'-To save in png formet.
Main CODE :
clear all
close all
clc
f1=fopen('THERMO.dat','r')
%reading first line
fgetl(f1);
%extracting global tempratures
line2=fgetl(f1);
GT=strsplit(line2,' '); % Breaking down the lines with individual variable
%converting characters to numbers using string
GT_max=str2num(GT{2});
GT_mid=str2num(GT{3});
GT_min=str2num(GT{4});
R=8.314;%universal gas constant
temperature=linspace(GT_min,GT_max,500);
%Getting comments
for i=1:3
    fgetl(f1)
end
for i=1:53
tline=fgetl(f1);
element=strtok(tline); %getting the element name

%extracting the coefficients from data
co_line1=fgetl(f1) ;
x=strfind(co_line1,'E');
co_line2=fgetl(f1);
y=strfind(co_line2,'E');
co_line3=fgetl(f1);
z=strfind(co_line3,'E');
%converting character to number and assigning the coefficients
%high temprature coefficients
a1=str2num(co_line1(1:x(1)+3));
a2=str2num(co_line1(x(1)+4:x(2)+3));
a3=str2num(co_line1(x(2)+4:x(3)+3));
a4=str2num(co_line1(x(3)+4:x(4)+3));
a5=str2num(co_line1(x(4)+4:x(5)+3));  %co_line1 ends
a6=str2num(co_line2(1:y(1)+3));
a7=str2num(co_line2(y(1)+4:y(2)+3));
%low temperature coefficients
a8=str2num(co_line2(y(2)+4:y(3)+3));
a9=str2num(co_line2(y(3)+4:y(4)+3));
a10=str2num(co_line2(y(4)+4:y(5)+3)); %co_line2 ends
a11=str2num(co_line3(1:z(1)+3));
a12=str2num(co_line3(z(1)+4:z(2)+3));
a13=str2num(co_line3(z(2)+4:z(3)+3));
a14=str2num(co_line3(z(3)+4:z(4)+3)); %all coefficients are assigned
%Performing the calculation
%specific haet
cp=c_p(a1,a2,a3,a4,a5,a8,a9,a10,a11,a12,temperature,R,GT_mid);
%Enthalpy
H=e_p(a1,a2,a3,a4,a5,a6,a8,a9,a10,a11,a12,a13,temperature,R,GT_mid);
%Entropy
s=s_p(a1,a2,a3,a4,a5,a7,a8,a9,a10,a11,a12,a14,temperature,R,GT_mid);
%molecular weigth
mwt(i)=molecular_weight(element);
%saving
cd('E:\matlab\NASA')
mkdir(element)
cd(element)
%plotting
%For temperature v/s specific heat
figure(1)
plot(temperature,cp,'Color','r')
title('Temperature v/s specific heat');
xlabel('Temprature');
ylabel('Specific heat');
grid on;
%saving 1st plot
saveas(figure(1),'cp.png')
%For temperature v/s Enthalpy
figure(2)
plot(temperature,H,'Color','b')
title('Temperature v/s Enthalpy')
xlabel('Temprature')
ylabel('Enthalpy')
grid on
%saving 2nd plot
saveas(figure(2),'H.png')
%For temperature v/s Entropy
figure(3)
plot(temperature,s,'Color','g')
title('Temperature v/s Entropy')
xlabel('Temprature')
ylabel('Entropy')
grid on
%saving 3rd plot
saveas(figure(3),'S.png')
%Returning back to the folder
cd('E:\matlab\NASA')
end
fclose(f1);
Specific heat function:
- Function is created which is accessed by assining the proper input variables like coefficients,temperature,gas constant,global temperature.
- The inputs are comming from main code as shown above.
- Based on higher and lower temperatures the calculations are made using above mentioned formula in specific heat and the formula is written in the language that is understandable to Matlab.
- By using 'if' & 'else' statements higher & lower temperatures are differentated.
SPECIFIC HEAT CODE:
function cp=c_p(a1,a2,a3,a4,a5,a8,a9,a10,a11,a12,temperature,R,GT_mid)
% specific heat calculation
%Based on higher and lower temperatures
if temperature>GT_mid
    cp=R*(a1+(a2*temperature)+(a3*(temperature.^2))+(a4*temperature.^3)+(a5*temperature.^4));
else
    cp=R*(a8+(a9*temperature)+(a10*(temperature.^2))+(a11*temperature.^3)+(a12*temperature.^4));
end
Enthalpy function:
- Function is created which is accessed by assining the proper input variables like coefficients,temperature,gas constant,global temperature.
- The inputs are comming from main code as shown above.
- Based on higher and lower temperatures the calculations are made using above mentioned formula in specific heat and the formula is written in the language that is understandable to Matlab.
- By using 'if' & 'else' statements higher & lower temperatures are differentated.
ENTHALPY CODE:
function H=e_p(a1,a2,a3,a4,a5,a6,a8,a9,a10,a11,a12,a13,temperature,R,GT_mid)
% Enthalpy calculation
%Based on higher and lower temperatures
if temperature>GT_mid
    H=R*(a1+(a2*temperature.^2)./2+(a3*(temperature.^3))./3+(a4*temperature.^4)./4+(a5*temperature.^5)./5+a6);
else
    H=R*(a8+(a9*temperature.^2)./2+(a10*(temperature.^3))./3+(a11*temperature.^4)./4+(a12*temperature.^5)./5+a13);
end
Entropy function:
- Function is created which is accessed by assining the proper input variables like coefficients,temperature,gas constant,global temperature.
- The inputs are comming from main code as shown above.
- Based on higher and lower temperatures the calculations are made using above mentioned formula in specific heat and the formula is written in the language that is understandable to Matlab.
- By using 'if' & 'else' statements higher & lower temperatures are differentated.
ENTROPY CODE:
function s=s_p(a1,a2,a3,a4,a5,a7,a8,a9,a10,a11,a12,a14,temperature,R,GT_mid)
% Entropy calculation
%Based on higher and lower temperatures
if temperature>=GT_mid
    s=R*((a1*log(temperature))+(a2*temperature)+(a3*(temperature.^2))./2+(a4*temperature.^3)./3+(a5*temperature.^4)./4+(a7));
else
    s=R*((a8*log(temperature))+(a9*temperature)+(a10*(temperature.^2))./2+(a11*temperature.^3)./3+(a12*temperature.^4)./4+(a14));
end
Molecular Weight:
- Function is created which has weights of Hydrogen,Nitrogen,Carbon,Oxygen,Argon,Sulphur as inputs.
- In the loop we are comparing elements with atoms using 'strcmp' command.If both are same then molecular weight is calculated.
- By taking the element name string and position to find weight.
- n=number of atoms of the perticular element.
MOLECULAR WEIGHT CODE:
function mwt=molecular_weight(element)
mwt=0;
atoms=['H','C','N','O','A','S'];
fprintf('molecular weight of ');
fprintf(element);
fprintf(' : ');
atom_wt=[1 12 14 16 39 32];
for q=1:length(element)
    for j=1:length(atoms)
        if strcmp(element(q),atoms(j))
            mwt=mwt+atom_wt(j);
            position=j;
        end
    end
    n=str2num(element(q));
    if n>1
        mwt=mwt+atom_wt(position)*(n-1);
    end
end
fprintf('%d',mwt)
disp(' ')
end
Errors faced while programming.
During execution there were no errors ,but i was unable to save which was rectified by the support engineer by one-on-one section.
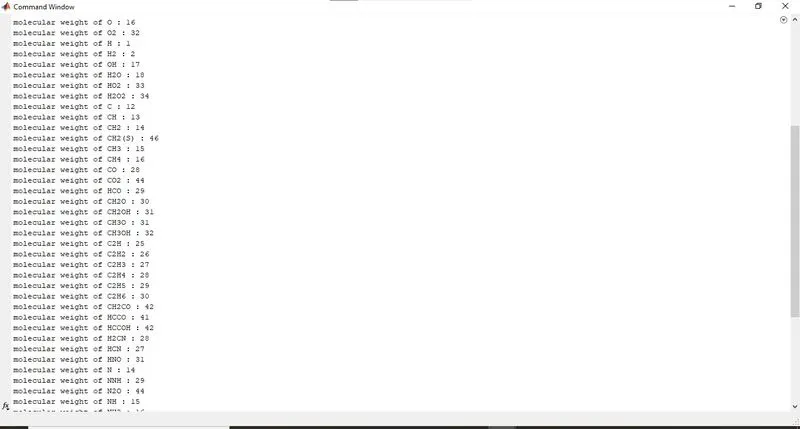
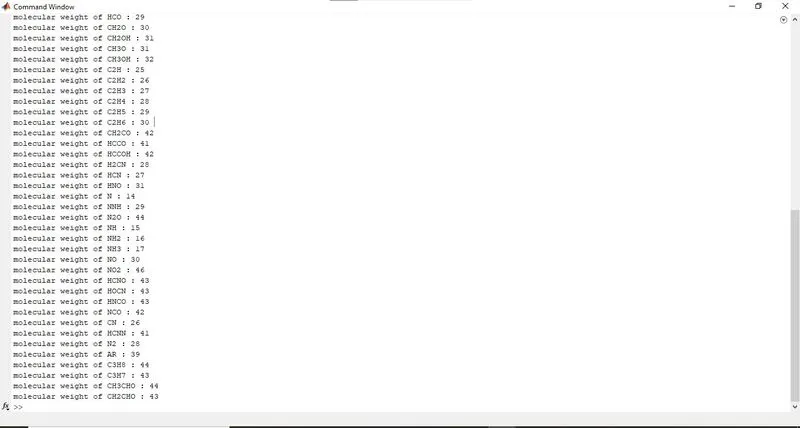
Command window after successful execution:
1.
2.
Attachments needed:
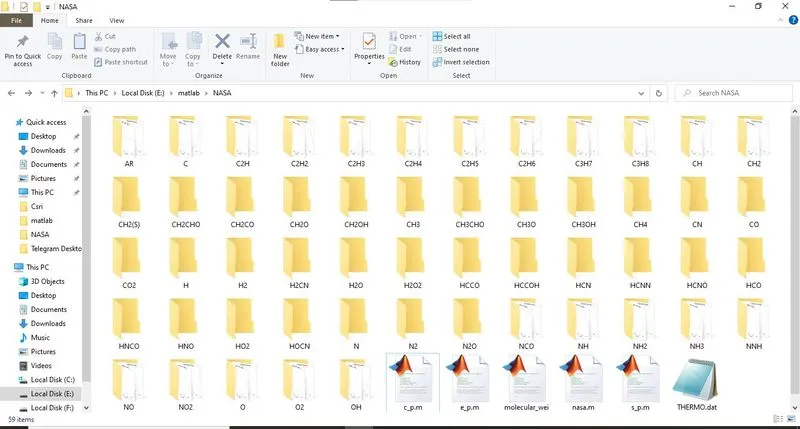
- Screenshot of the window where all the folders are saved including matlab files.
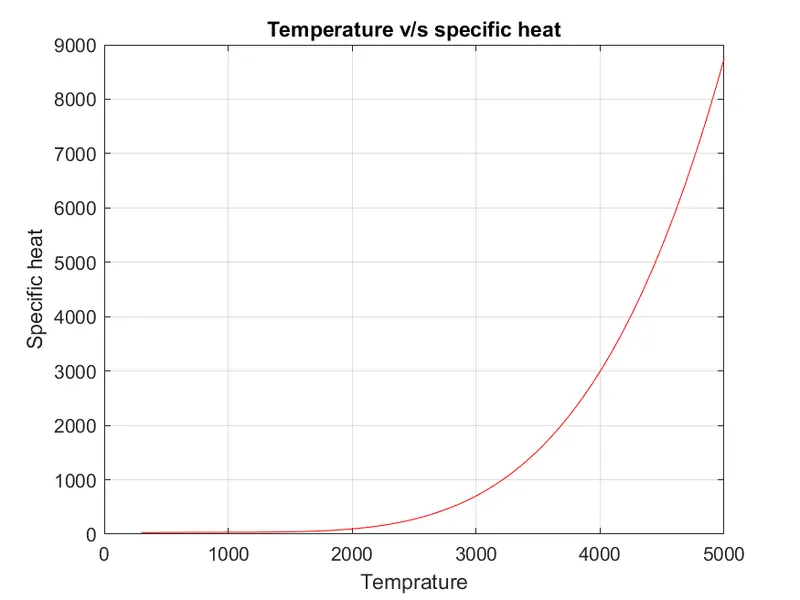
- Plots for o2, N2 and Co2 species
o2:
N2:
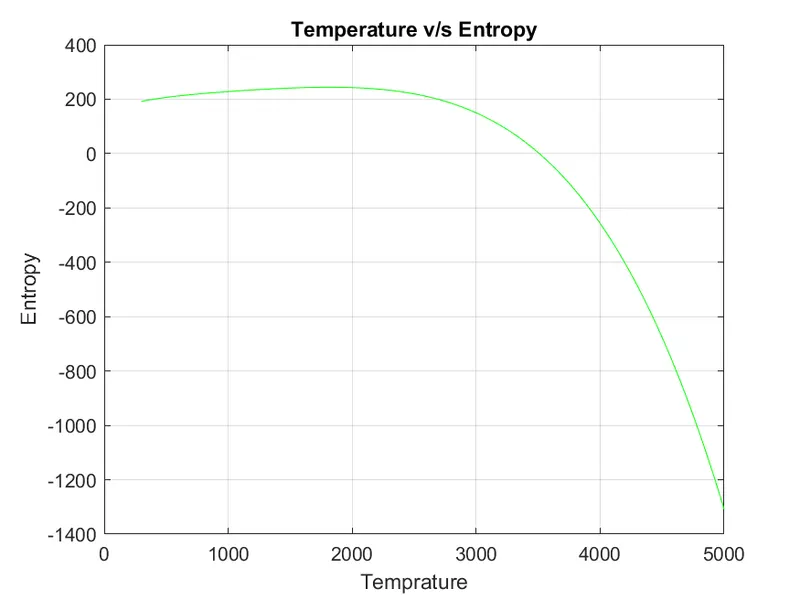
Co2:
.