Project 1 - Parsing NASA thermodynamic data
REPORT
Aim
To do a project in Praising Thermodynamic data of NASA.
Objective
- Write a function that extracts the 14 co-efficients and calculates the enthalpy, entropy and specific heats for all the species in the data file.
- Calculate the molecular weight of each species and display it in the command window.
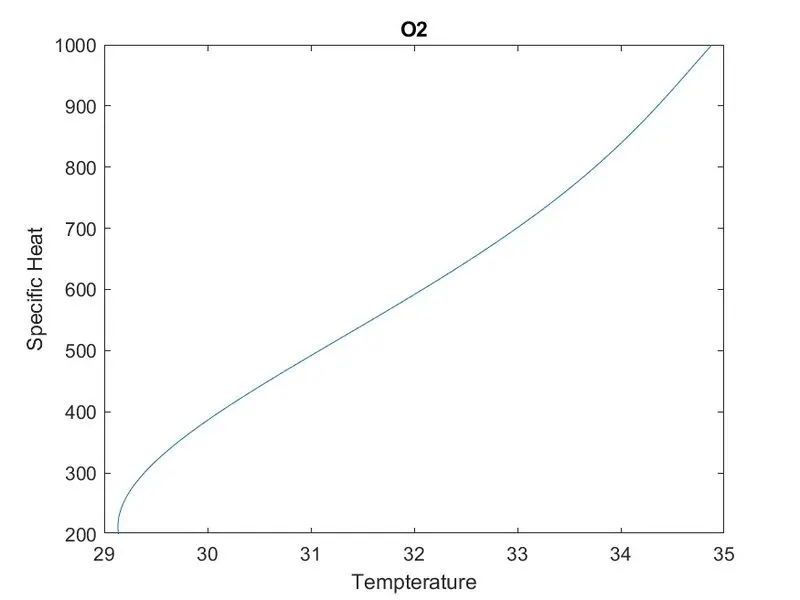
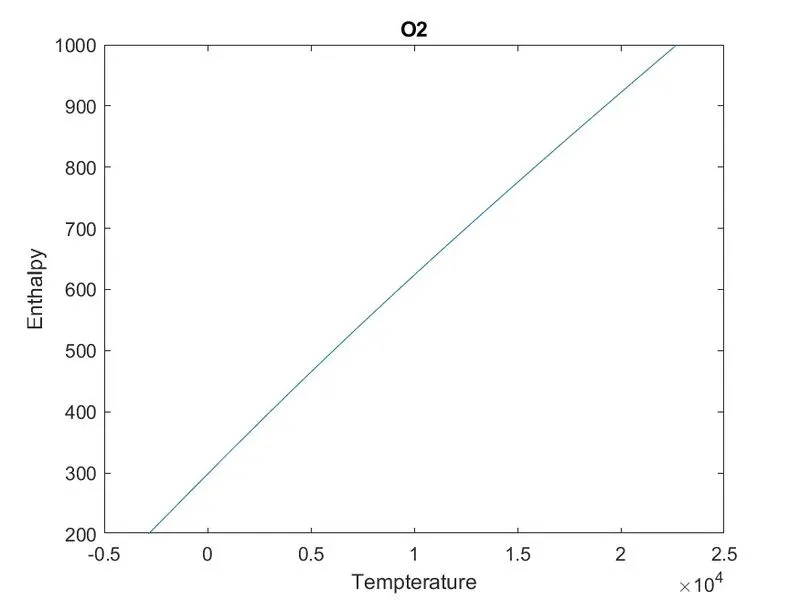
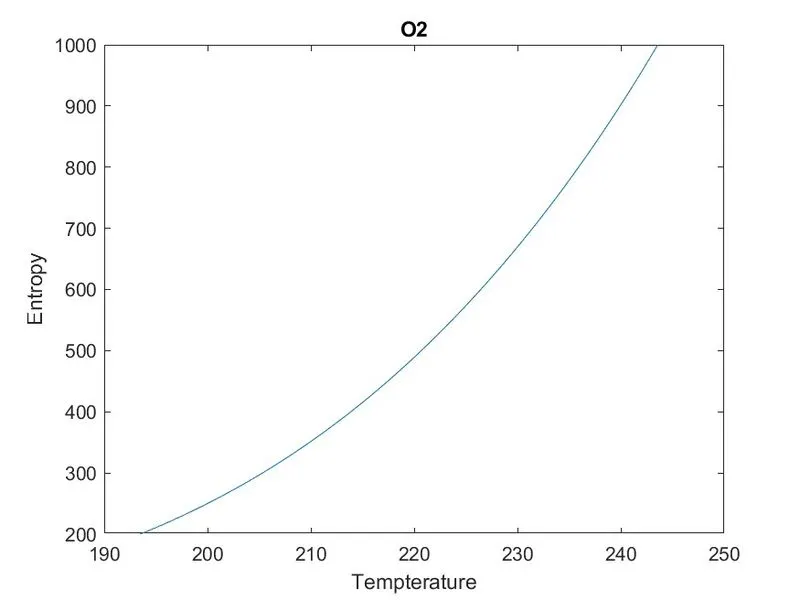
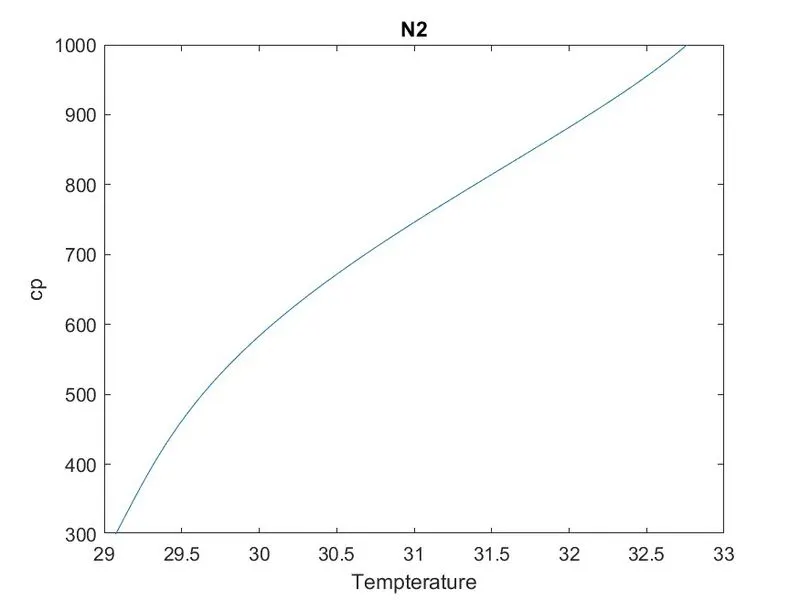
- Plot the Cp, Enthalpy and Entropy for the local temperature range (low temperature : high temperature) specific for each species.
- Save the plots as images with appropriate names and dump them in separate folders for each species with suitable name. All these should be generated automatically.
- The main program that you will submit will just take the "THERMO.dat" file as an input and generate Cp, H and S plots.
- Please write a detailed report to describe your logic.
Formula used
- CP = (a1+ a2*T + a3*T^2 + a4*T^3 + a5*T^4) * R
- H = (a1 + a2*T/2 + a3*T^2/3 + a4*T^3/4 +a5*T^4/5+ a6/T)*R*T
- S = (a1 ln T + a2*T + a3*T^2/2 + a4*T^3/3 + a5*T^4/4 + a7)* R
Main Code
% Project No 1
clear
close
clc
%Loading data from File
f1 = fopen('THERMO.dat','r');
% Neglecting the first 5 line using For loop
for i = 1:5
b = fgetl(f1);
end
% Loading the Low, Medium, High temperature for all species.
for j= 1:53
header = fgetl(f1);
a = strsplit(header, ' ');
speciesness = a{1};
llt = str2double(a{end-3});
lmt = str2double(a{end-2});
lht = str2double(a{end-1});
T = linspace(llt,lht,500);
R = 8.314;
% Coefficient of 1 Species
% from line One
line_1 = fgetl(f1);
e1 = strfind(line_1,'E');
a1 = str2double(line_1(1:e1(1)+3));
a2 = str2double(line_1(e1(1)+4:e1(2)+3));
a3 = str2double(line_1(e1(2)+4:e1(3)+3));
a4 = str2double(line_1(e1(3)+4:e1(4)+3));
a5 = str2double(line_1(e1(4)+4:e1(5)+3));
% form Line Two
line_2 = fgetl(f1);
e2 = strfind(line_2,'E');
a6 = str2double(line_2(1:e2(1)+3));
a7 = str2double(line_2(e2(1)+4:e2(2)+3));
a8 = str2double(line_2(e2(2)+4:e2(3)+3));
a9 = str2double(line_2(e2(3)+4:e2(4)+3));
a10 = str2double(line_2(e2(4)+4:e2(5)+3));
% from Line Three
line_3 = fgetl(f1);
e3 = strfind(line_3,'E');
a11 = str2double(line_3(1:e3(1)+3));
a12 = str2double(line_3(e3(1)+4:e3(2)+3));
a13 = str2double(line_3(e3(2)+4:e3(3)+3));
a14 = str2double(line_3(e3(3)+4:e3(4)+3));
% Calculation of Cp, Enthalpy and Entropy
mkdir(['C:\Users\PRIYA SARAN\OneDrive\Documents\MATLAB\Project data parsing\output\',speciesness])
Cp = specific_heat(a1,a2,a3,a4,a5,a8,a9,a10,a11,a12,T,R,lmt);
H = enthalpy(a1,a2,a3,a4,a5,a6,a8,a9,a10,a11,a12,a13,T,R,lmt);
S = entropy(a1,a2,a3,a4,a5,a7,a8,a9,a10,a11,a12,a14,T,R,lmt);
% Plotting
figure(1)
plot(Cp,T)
xlabel('Tempterature')
ylabel('Specific Heat')
title(speciesness)
figure(2)
plot(H,T)
xlabel('Tempterature')
ylabel('Enthalpy')
title(speciesness)
figure(3)
plot(S,T)
xlabel('Tempterature')
ylabel('Entropy')
title(speciesness)
cd(['C:\Users\PRIYA SARAN\OneDrive\Documents\MATLAB\Project data parsing\output\',speciesness])
saveas(1,'Cp vs Temp','jpg')
saveas(2,'H vs Temp','jpg')
saveas(3,'S vs Temp','jpg')
cd('C:\Users\PRIYA SARAN\OneDrive\Documents\MATLAB\Project data parsing\')
[MW] = molecular_weight(speciesness);
end
Function code for CP
function [Cp] = specific_heat(a1,a2,a3,a4,a5,a8,a9,a10,a11,a12,T,R,lmt)
if T<= lmt
Cp = (a8 + (a9*T) + (a10*T.^2) + (a11*T.^3) + (a12*T.^4) )* R;
else
Cp= (a1+(a2*T)+(a3*T.^2)+(a4*T.^3)+(a5*T.^4))* R;
end
end
Function code for H
function [H] = enthalpy(a1,a2,a3,a4,a5,a6,a8,a9,a10,a11,a12,a13,T,R,lmt)
if T<=lmt
H = (a8 +(a9*T./2)+(a10*(T.^2)./3)+(a11*(T.^3)./4)+(a12*(T.^4)./5)+(a13./T)) .*(T*R);
else
H = (a1 +(a2*T./2)+(a3*(T.^2)./3)+(a4*(T.^3)./4)+(a5*(T.^4)./5)+(a6./T)) .*(T*R);
end
end
Function code for S
function [S] = entropy(a1,a2,a3,a4,a5,a7,a8,a9,a10,a11,a12,a14,T,R,lmt)
if T <= lmt
S= ((a8 *log(T))+(a9*T)+(a10*(T.^2)./2)+(a11*(T.^3)./3)+(a12*(T.^4)./4)+(a14))*R;
else
S= ((a1 *log(T))+(a2*T)+(a3*(T.^2)./2)+(a4*(T.^3)./3)+(a5*(T.^4)./4)+(a7))*R;
end
end
Function code for Molecular weight calculation
function [W] = molecular_weight(speciesness)
atomic_name = ['H','C','O','N','Ar'];
atomic_weight = [1.00784, 12.0107, 15.999, 14.0067, 39.948];
W = 0;
for i=1:length(speciesness)
for j = 1:length(atomic_name)
if speciesness(i) == atomic_name(j)
W = W+atomic_weight(j);
position = (j);
end
end
n=str2num(speciesness(i));
if n>1
W = W+atomic_weight(position)*(n-1);
end
end
fprintf('Molecular weight %s = %f',speciesness,W)
disp(' ')
end
Explanation
- For loading the data from file we use the command ‘f1 = fopen(‘THERMO.dat’,’r’). Here ‘r’ denoted to read the existing data if we write we use ‘w’ for write the data. ‘THERMO.dat’ is the name of the given file.
- After the reading the data we are going to extract the data from the file in following steps.
- The first 5 lines in the file is the command or a label that is not containing the data that we going to make a calculations. So we are going to neglecting that data by using the for loop as
for i = 1:5
b = fgetl(f1);
end
- We are opening the for loop here because we are going to extract the coefficient of all specimen so we use for loop here.
- After the negation of first five line we are going to extract the data of low, medium, high temperature of species by using the command ‘llt = str2double(a{end-3})’, ‘lmt = str2double(a{end-2})’ and ‘lht = str2double(a{end-1})’. We get the global temperature of species.
- After the we are going to get ’T’ by using the ‘linspace’ command. By using the command we going to get fifty random in between llt and lht.
- Then we are going to extract the coefficient from the data by using following commands or code
line_1 = fgetl(f1);
e1 = strfind(line_1,'E');
a1 = str2double(line_1(1:e1(1)+3));
a2 = str2double(line_1(e1(1)+4:e1(2)+3));
a3 = str2double(line_1(e1(2)+4:e1(3)+3));
a4 = str2double(line_1(e1(3)+4:e1(4)+3));
a5 = str2double(line_1(e1(4)+4:e1(5)+3));
% form Line Two
line_2 = fgetl(f1);
e2 = strfind(line_2,'E');
a6 = str2double(line_2(1:e2(1)+3));
a7 = str2double(line_2(e2(1)+4:e2(2)+3));
a8 = str2double(line_2(e2(2)+4:e2(3)+3));
a9 = str2double(line_2(e2(3)+4:e2(4)+3));
a10 = str2double(line_2(e2(4)+4:e2(5)+3));
% from Line Three
line_3 = fgetl(f1);
e3 = strfind(line_3,'E');
a11 = str2double(line_3(1:e3(1)+3));
a12 = str2double(line_3(e3(1)+4:e3(2)+3));
a13 = str2double(line_3(e3(2)+4:e3(3)+3));
a14 = str2double(line_3(e3(3)+4:e3(4)+3));
- In the above code we use the command ‘fgetl(f1)’ to find or determine the line_1 and to denote ‘e1’ we use the command ‘strfind(line_1,’E’)’ in this command we are saying that find ‘E’ in the line_1 and save that data in ‘e1’
- In this data E is the common variable that paced in all coefficient so we make use of that and extract the required data by addition the variable with it.
- And we did the same for line_2 and line_3 also but we denote line_2’s ‘E’ as e2 and line_3’s ‘E’ as e3.
- After the extraction of all 14 coefficients from the data by using the above steps. Now we are going to make a calculation to find the Cp,H and S.
- For that we are going to make a functions for each formula given to find the Cp, H and S.
- We are going to name the functions as specific_heat, enthalpy and entropy.
- In the given question have a criteria that the first coefficients are high-temperature coefficients and the second 7 coefficients are low-temperature coefficients.
- So we are going to make a if else code in the function to obtain the exact data and use in the formula. By using the medium temperature as
if T<= lmt
Cp = (a8 + (a9*T) + (a10*T.^2) + (a11*T.^3) + (a12*T.^4) )* R;
else
Cp= (a1+(a2*T)+(a3*T.^2)+(a4*T.^3)+(a5*T.^4))* R;
- We use this same method for enthalpy and entropy also.
- In entropy formula there is a ‘ln’ that means ‘log’ so we use log there.
- After calculating all the data we are going to make a plot for Cp,H and S between Temperature. By using the following command.
figure(1)
plot(Cp,T)
xlabel('Tempterature')
ylabel('Specific Heat')
title(speciesness)
figure(2)
plot(H,T)
xlabel('Tempterature')
ylabel('Enthalpy')
title(speciesness)
figure(3)
plot(S,T)
xlabel('Tempterature')
ylabel('Entropy')
title(speciesness)
- We name this three figures as ‘figure 1’, ‘figure 2’ and ‘figure 3’
- For figure 1 give xlabel as ‘Temperature’, ylabel as ‘Specific Heat’ and title as ‘speciesness’.
- For figure 2 give xlabel as ‘Temperature’, ylabel as ‘Enthalpy’ and title as ‘speciesness’.
- For figure 3 give xlabel as ‘Temperature’, ylabel as ‘Entropy’ and title as ‘speciesness’.
- Before this plot we use the command ‘mkdir’ this command is used to make a folder in with a name of speciesness. While using this command we denote the location also as example ‘
- Here we use ‘speciesness’ in this command because it will automatically change the name as per the material when the code run.
- After the plot is done we use the ‘cd’ command to determine where we have to save the plot.
- Then we use ‘saveas’ command to determine the name and format of the plot. We use this ‘saveas’ command for all three plot.
- Once again we use command cd here because this cd command is instruct the mallab to come out of the output folder and run code and save the data in the specified location.
- Then we have to calculate the molecular weight for that we are going to make function to calculate the molecular weight.
- We name the function as ‘molecular_weight’ after that in the data given to us as only 5 individual molecules others are just a combination of that 5 molecules.
- So here we are going to make array that determine the name of molecule as ‘atomic_name’ and it is consists of H, C, O, N and Ar.
- Then we have to determine the atomic weight of each molecule in different array as ‘atomic_weight’ and it is consists the values 1.00784, 12.0107, 15.999, 14.0067 and 39.948.
- We are going to use two for loop and if command to determine the molecular weight one is for to determine the weight of molecule that consist of unique molecules only example ‘NH,O,CO etc.’ like it will not give an exact value for ‘CO2, NO2 etc.’ with a formulas as W = W + atomic_weigth(j). That look as
function [W] = molecular_weight(speciesness)
atomic_name = ['H','C','O','N','Ar'];
atomic_weight = [1.00784, 12.0107, 15.999, 14.0067, 39.948];
W = 0;
for i=1:length(speciesness)
for j = 1:length(atomic_name)
if speciesness(i) == atomic_name(j)
W = W+atomic_weight(j);
position = (j);
end
end
n=str2num(speciesness(i));
if n>1
W = W+atomic_weight(position)*(n-1);
end
end
fprintf('Molecular weight %s = %f',speciesness,W)
disp(' ')
end
- The set of loop that is saying the if the ’n’ is greater then the one then this formula is used to determine the molecular weight.
- After the completion of the code we can able to obtain the molecular weight in the command window as per the instruction given.
OUTPUT ATTACHMENT
- Screenshot of the Window

- Plots of O2
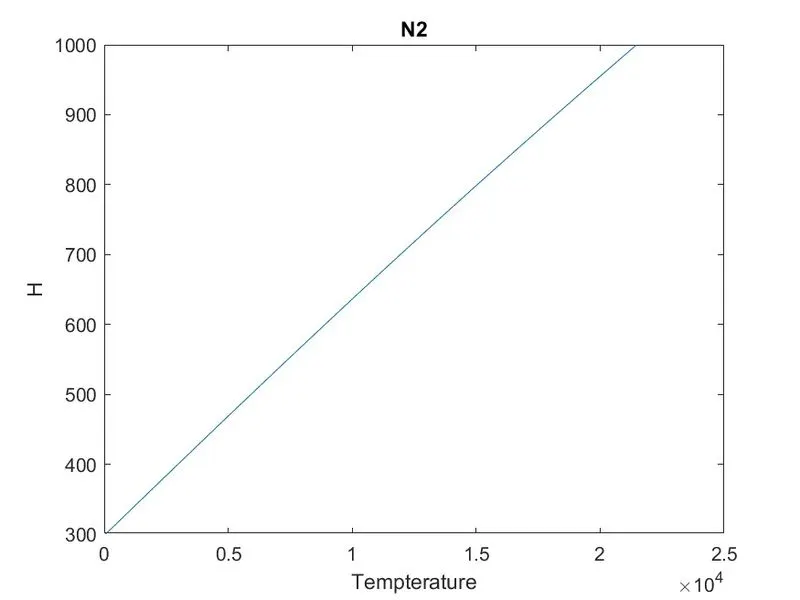
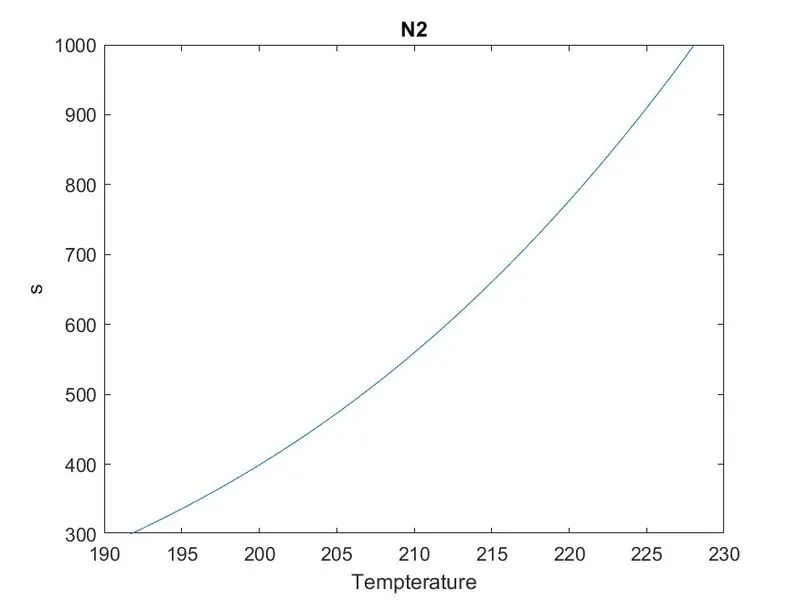
- Plots of N2
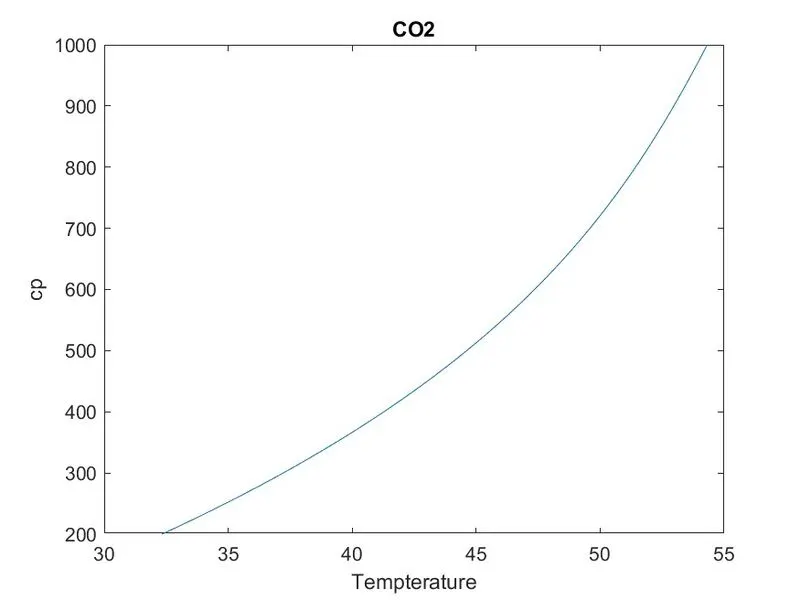
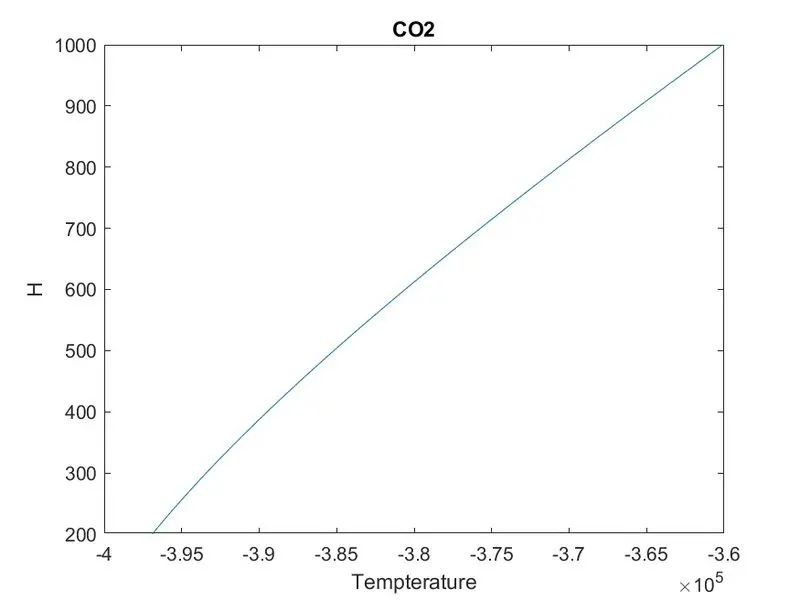
- Plots of Co2
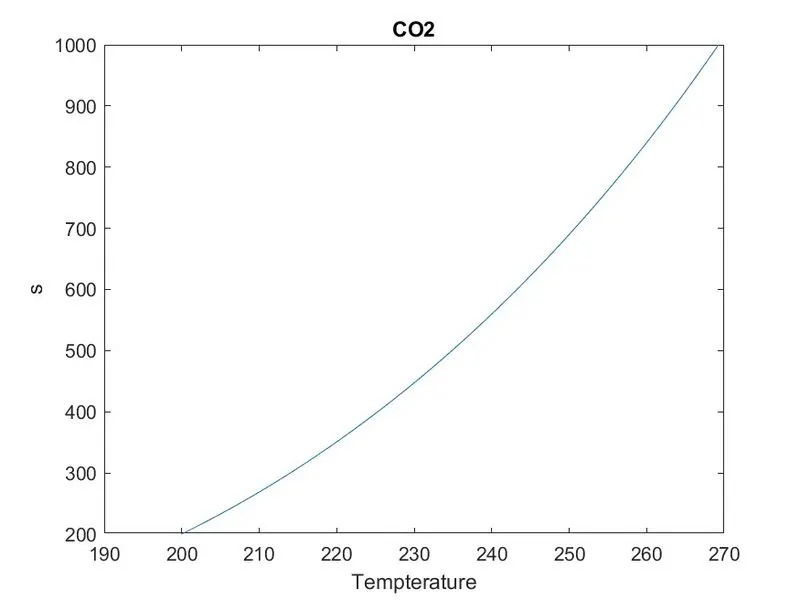
ERROR
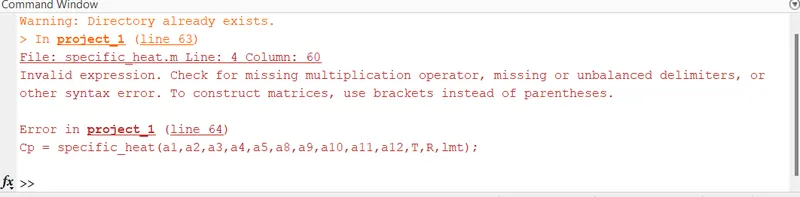
- Error 1 - Forget to put a mutiplication symbol '*' in the specific heat function in between R and formula.
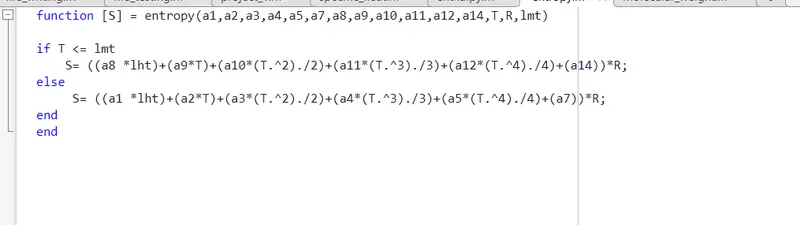
- Error 2 - In Entropy function I put 'lht' instead of 'log'.
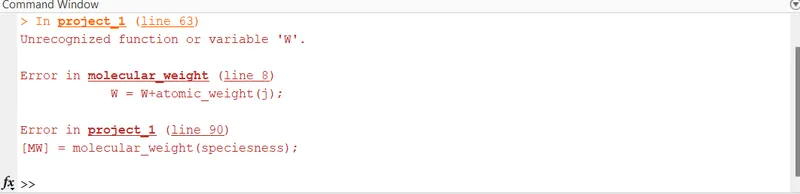
- Error 3 - In molecular_weight funtion i forget to put the W = 0
ERROR IMAGE
- Error 1
- Error 2
- Error 3
ERROR OVERCOME
- Error 1 - I make change in the function after the error pop up.
- Error 2 - I didn't know about that answer is came but is not correct I make a one- one session after that I replace the lht with log.
- Error 3 - After the error came I create 'W' and give a value as '0'.