Project 1 - Parsing NASA thermodynamic data
Aim:
The main aim of the program is to create a code to parse the NASA thermo data file and to calculate its properties with nesessory plots.
Formula used:
File parsing:
Data parsing is used for crawling information from large datasets and structuring it in a way humans can understand. Traditional data parsing is done on HTML files where the parser converts HTML text into readable data. However, not all parsers work the same and there are distinct differences in parsing technologies. There are numerous benefits of data parsing for businesses ranging from automated data extraction, improved visibility, cutting costs, and boosting employee productivity.
Data parsing is a process in which a string of data is converted from one format to another. If you are reading data in raw HTML, a data parser will help you convert it into a more readable format such as plain text. Not all the information is converted during the parsing process and programs have their own sets of rules when it comes to parsing information.
maincode:
clear all
close all
clc

%reading the thermo file
file=fopen('THERMO.dat','r')

%Adding heading
line_1=fgetl(file)

%GT values
line_2=fgetl(file)
global_temperature = strsplit(line_2,' ')
Global_low_temperature = str2num(global_temperature{2})
Global_mid_temperature = str2num(global_temperature{3})
Global_high_temperature = str2num(global_temperature{4})

%skippping 3 lines
fgetl(file)
fgetl(file)
fgetl(file)

%for loop to extract coefficients and calculation of Cp,H and S
for i=1:53
    species=fgetl(file)
    A=strsplit(species,'')
    species_name=A{1}

   %obtaining local temperature

   l_temperature=species(49:75)
   local=strsplit(l_temperature,' ')
   l_temperature=str2num(local{1})
   h_temperature=str2num(local{2})
   m_temperature=str2num(local{3})

   %extracting the coefficients

   %first line coefficients
   line1_coefficient=fgetl(file)
   C=findstr(line1_coefficient,'E')
   c1=str2num(line1_coefficient(1:C(1)+3))
   c2=str2num(line1_coefficient(C(1)+4:C(2)+3))
   c3=str2num(line1_coefficient(C(2)+4:C(3)+3))
   c4=str2num(line1_coefficient(C(3)+4:C(4)+3))
   c5=str2num(line1_coefficient(C(4)+4:C(5)+3))

   %ssecomd line coefficients
   line2_coefficient=fgetl(file)
   D=findstr(line2_coefficient,'E')
   c6=str2num(line2_coefficient(1:D(1)+3))
   c7=str2num(line2_coefficient(D(1)+4:D(2)+3))
   c8=str2num(line2_coefficient(D(2)+4:D(3)+3))
   c9=str2num(line2_coefficient(D(3)+4:D(4)+3))
   c10=str2num(line2_coefficient(D(4)+4:D(5)+3))

   %third line coefficients
    line3_coefficient=fgetl(file)
    T=findstr(line3_coefficient,'E')
   c11=str2num(line3_coefficient(1:T(1)+3))
   c12=str2num(line3_coefficient(T(1)+4:T(2)+3))
   c13=str2num(line3_coefficient(T(2)+4:T(3)+3))
   c14=str2num(line3_coefficient(T(3)+4:T(4)+3))


   L=linspace(l_temperature,h_temperature,1000)
   R=8.314


   for j=1:length(L)
      if L>m_temperature
           Cp=(c1+c2.*(L)+c3.*(L.^2)+c4.*(L.^3)+c5.*(L.^4))*R
           H=(c1+(c2.*L)./2+(c3.*L.^2)./3+(c4.*L.^3)./4+(c5.*L.^4)./5+(c6./L)).*L*R
           S=(c1*log(L)+(c2.*L)+(c3.*L.^2)./2+(c4.*L.^3)./3+(c5.*L.^4)./4+c7)*R
      else
           Cp=(c8+c9.*(L)+c10.*(L.^2)+c11.*(L.^3)+c12.*(L.^4))*R
           H=(c8+(c9.*L)./2+(c10.*L.^2)./3+(c11.*L.^3)./4+(c12.*L.^4)./5+(c13./L)).*L*R
           S=(c8*log(L)+(c9.*L)+(c10.*L.^2)./2+(c11.*L.^3)./3+(c12.*L.^4)./4+c14)*R

      end
   end

   %creating the folder

   cd(species_name)
   mkdir(species_name)


   %plotting
  %Temperature vs Specific heat
figure(1);
plot(L,Cp)
xlabel('Temperature(K)');
ylabel('Specific Heat (kJ/Kmol-K)');
title('species_name')
saveas(1,'cp.png')

%Temperature vs Enthalpy
figure(2);
plot(L,H)
xlabel('Temperature(K)');
ylabel('Enthalpy (J)');
title('species_name');
saveas(2,'enthalpy.png')


%Temperature vs Entropy
figure(3);
plot(L,S)
xlabel('Temperature(K)');
ylabel('Entropy(J/K)')
title('species_name');
saveas(3,'entropy.png')

cd('C:/Users/BLACKBOX/parsing data')

M_WEIGHT=mw(species_name)
sprintf('The molecular mass of %s is %d,species_name,M_WEIGHT')


end

fclose(file)
Code Explaination:
1. The coding gets started with the command
clear all
close all
clc
then the THERMO.dat file is readed with the command
file=fopen('THERMO.dat','r')
2.Then the extraction of global temperature is done by the command
line_2=fgetl(file)
global_temperature = strsplit(line_2,' ')
Global_low_temperature = str2num(global_temperature{2})
Global_mid_temperature = str2num(global_temperature{3})
Global_high_temperature = str2num(global_temperature{4})
3.The for loop is used to extract the coefficients and the calculation of all 53 species,the code used is mentioned below
line1_coefficient=fgetl(file)
C=findstr(line1_coefficient,'E')
c1=str2num(line1_coefficient(1:C(1)+3))
c2=str2num(line1_coefficient(C(1)+4:C(2)+3))
c3=str2num(line1_coefficient(C(2)+4:C(3)+3))
c4=str2num(line1_coefficient(C(3)+4:C(4)+3))
c5=str2num(line1_coefficient(C(4)+4:C(5)+3))
%ssecomd line coefficients
line2_coefficient=fgetl(file)
D=findstr(line2_coefficient,'E')
c6=str2num(line2_coefficient(1:D(1)+3))
c7=str2num(line2_coefficient(D(1)+4:D(2)+3))
c8=str2num(line2_coefficient(D(2)+4:D(3)+3))
c9=str2num(line2_coefficient(D(3)+4:D(4)+3))
c10=str2num(line2_coefficient(D(4)+4:D(5)+3))
%third line coefficients
line3_coefficient=fgetl(file)
T=findstr(line3_coefficient,'E')
c11=str2num(line3_coefficient(1:T(1)+3))
c12=str2num(line3_coefficient(T(1)+4:T(2)+3))
c13=str2num(line3_coefficient(T(2)+4:T(3)+3))
c14=str2num(line3_coefficient(T(3)+4:T(4)+3))
4.The linspace command is used to generate the values.
L=linspace(l_temperature,h_temperature,1000)
5. The for loop command amd the if-else command is to add some conditions.
for j=1:length(L)
if L>m_temperature
Cp=(c1+c2.*(L)+c3.*(L.^2)+c4.*(L.^3)+c5.*(L.^4))*R
H=(c1+(c2.*L)./2+(c3.*L.^2)./3+(c4.*L.^3)./4+(c5.*L.^4)./5+(c6./L)).*L*R
S=(c1*log(L)+(c2.*L)+(c3.*L.^2)./2+(c4.*L.^3)./3+(c5.*L.^4)./4+c7)*R
else
Cp=(c8+c9.*(L)+c10.*(L.^2)+c11.*(L.^3)+c12.*(L.^4))*R
H=(c8+(c9.*L)./2+(c10.*L.^2)./3+(c11.*L.^3)./4+(c12.*L.^4)./5+(c13./L)).*L*R
S=(c8*log(L)+(c9.*L)+(c10.*L.^2)./2+(c11.*L.^3)./3+(c12.*L.^4)./4+c14)*R
end
end
6.Then the folder gets created and the plotting is done for
%Temperature vs Specific heat
%Temperature vs Enthalpy
%Temperature vs Entropy
withe the necessary plots including necessory xlabels and ylabels'
and then the file gets closed using the command fclose(file) .
Code2:Function code for calculating molecular mass:
function[mol_wt]=mw( species_name)

%calculating molecular mass
M = upper(species_name);
E = ['H','C', 'N','0', 'AR'];
At_wt = [1,12,14,16,40];
mol_wt = 0;

for k = 1:length(M)
for n = 1:length(E)
if strcmp(M(K), E(n));
mol_wt = mol_wt + At
p = n;
end
end
y = str2num (M(K));
if y>1
mol_wt=mol_wt + At_wt(p)*(y-1)
end
end

end
Result:
*Screenshot where all folders gets saved.

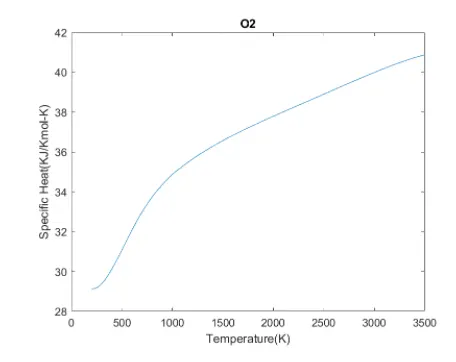
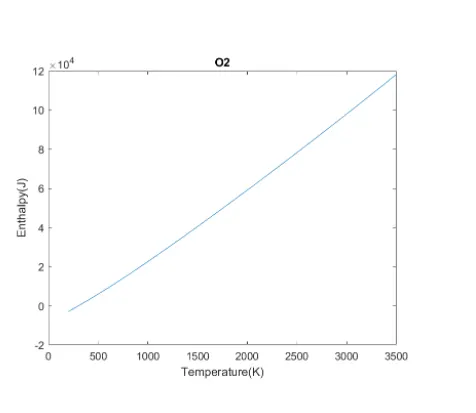
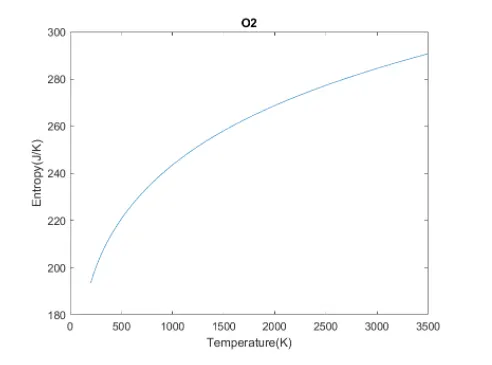
Graphs for O2:
%Temperature vs Specific Heat
%Temperature vs Enthalpy
%Temperature vs Entropy
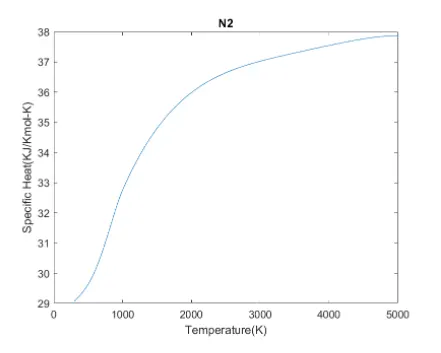
Graphs for N2:
%Temperature vs Specific Heat
%Temperature vs Enthalpy
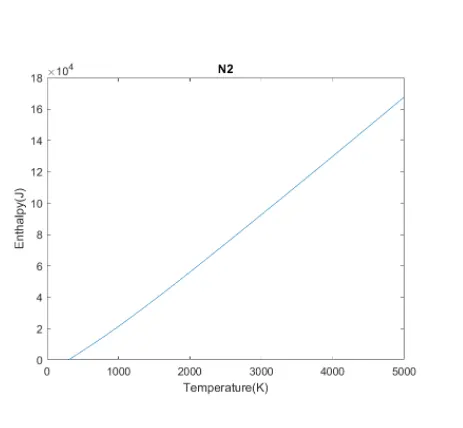
%Temperature vs Entropy
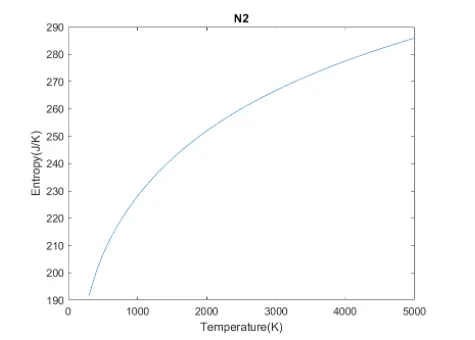
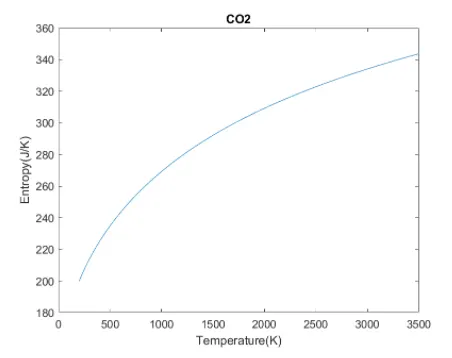
Graphs for CO2:
%Temperature vs Specific Heat
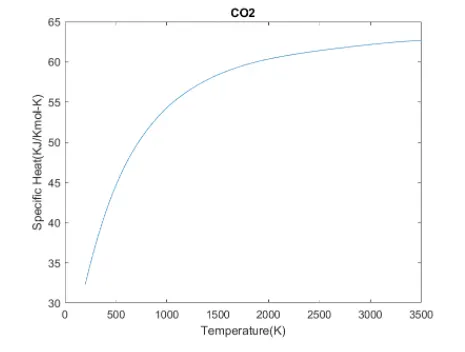
%Temperature vs Enthalpy
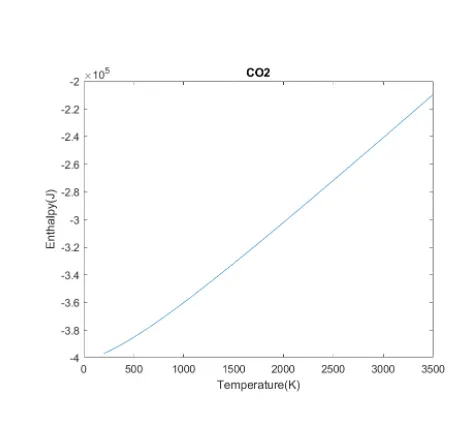
%Temperature vs Entropy
Thus the given NASA thermo data file have parsed and the respective graphs are plotted for
%Temperature vs Specific Heat
%Temperature vs Enthalpy
%Temperature vs Entropy
And the screenshot is shared where all the folders are saved.