Project 1 - Parsing NASA thermodynamic data
Aim:
To read and calculate specific-heat,enthalpy,entropy from all the species from the given NASA thermodynamic
data file.
Objectives:
1. To write a function that extracts the 14 co-efficients and calculates the specific-heat,enthalpy & entropy.
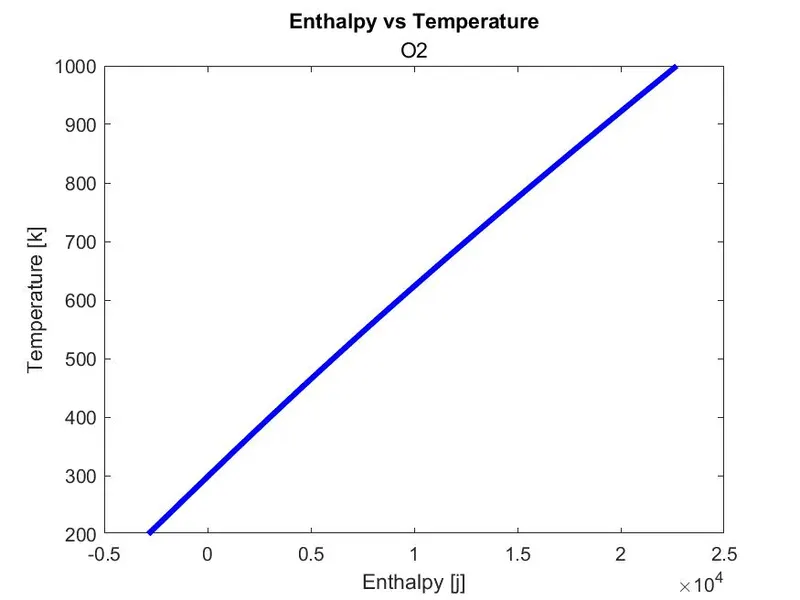
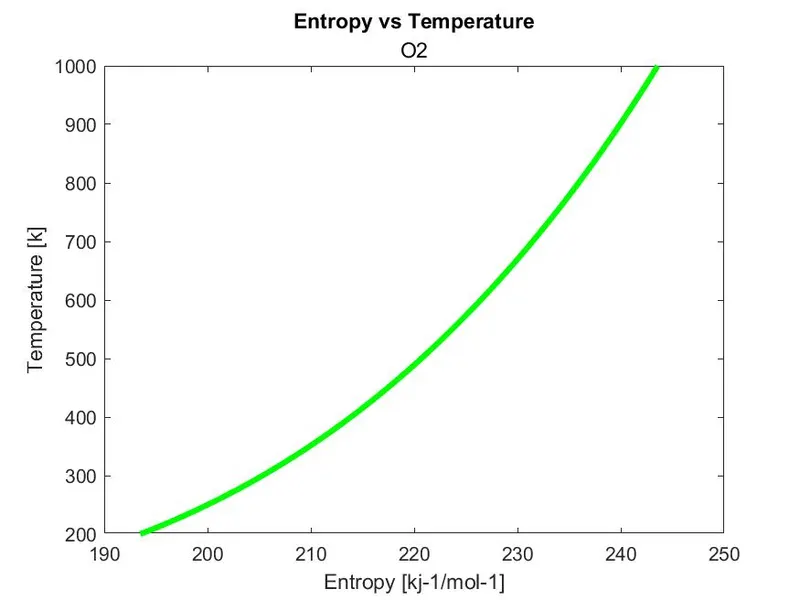
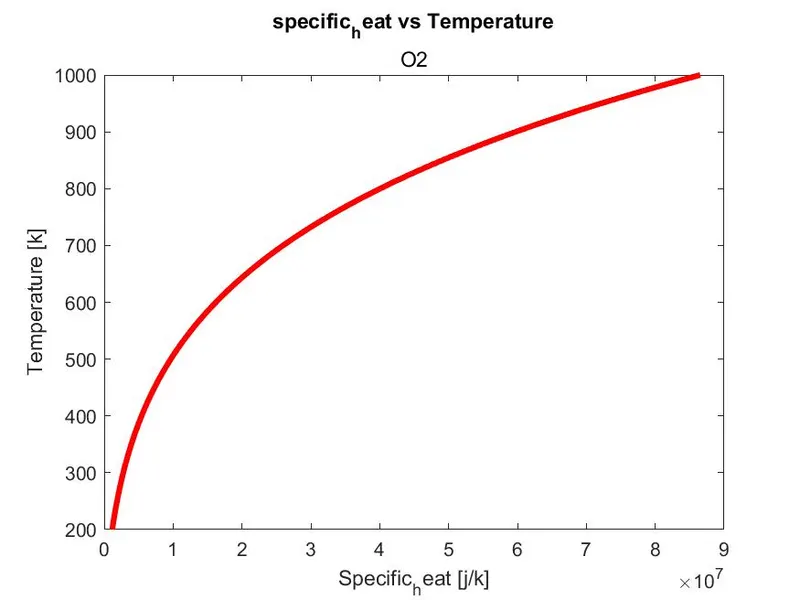
2. To plot the cp,entropy,enthalpy for the local temperature range of each species.
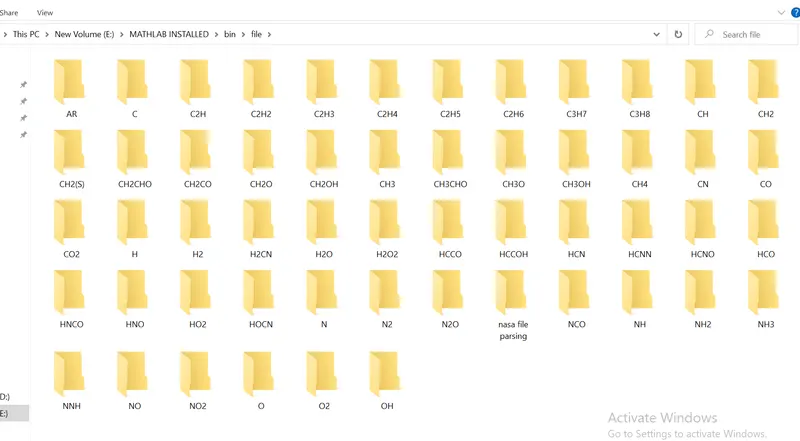
3. Saving the plots as images with approprite name and dump them in seperate folders for each species with
suitable name.
what is entropy?
Entropy, the measure of a system's thermal energy per unit temperature that is unavailable for doing useful work.
what is specific heat?
Specific heat, the quantity of heat required to raise the temperature of one gram of a substance by one Celsius
degree. The units of specific heat are usually calories or joules per gram per Celsius degree
What is Enthalpy?
Enthalpy is the sum of the internal energy. and pressure times volume. We cannot measure the
enthalpy of a system, but we can look at changes in enthalpy.
What does Parsing means in Matlab?
Parsing a file means reading in a data stream and building a memory model of the content of that data. This aims at facilitating perfoming some kind of transformation on the data. Parsing splits a file or other input into pieces of data that can be easily stored or manipulated.
CODE
Main Code


% NASA Thermodynamic data and calculating the molecular weight
clear all
clear all
clc

% Opening the data from the folder
f1=fopen('THERMO.DAT','r');

% getting the header data
fgetl(f1);

% getting the global temp data
header_global_temp=fgetl(f1);

% split the global string data
A=strsplit(header_global_temp,' ');

% string data is converted into number and used for evaluation
global_low_temp=str2num(A{2});
global_mid_temp=str2num(A{3});
global_high_temp=str2num(A{4});

% Reading header theoritical data
for i=1:3
    fgetl(f1)
end

% reading all line data

for i=1:53
    tline1=fgetl(f1)
    tline2=fgetl(f1);
    tline3=fgetl(f1);
    tline4=fgetl(f1);

% Finding string for tline_2
loc_temp=strsplit(tline1,' ');
species_name=(loc_temp{1});
loc_low_temp=str2num(loc_temp{end-3});
loc_mid_temp=str2num(loc_temp{end-2});
loc_high_temp=str2num(loc_temp{end-1});
% finding the strings line 2
%  Finding the co_efficients
% finded string lines converted into numbers

a=findstr(tline2,'E');

a1=tline2(1:a(1)+3);
a1=str2num(a1);

a2=tline2(a(1)+4:a(2)+3);
a2=str2num(a2);

a3=tline2(a(2)+4:a(3)+3);
a3=str2num(a3);

a4=tline2(a(3)+4:a(4)+3);
a4=str2num(a4);

a5=tline2(a(4)+4:a(5)+3);
a5=str2num(a5);

% finding the strings line 3
%  Finding the co_efficients
% finded string lines converted into numbers
a=findstr(tline3,'E');

a6=tline3(1:a(1)+3);
a6=str2num(a6);

a7=tline3(a(1)+4:a(2)+3);
a7=str2num(a7);

a8=tline3(a(2)+4:a(3)+3);
a8=str2num(a8);

a9=tline3(a(3)+4:a(4)+3);
a9=str2num(a9);

a10=tline3(a(4)+4:a(5)+3);
a10=str2num(a10);

% finding the strings line 4
%  Finding the co_efficients
% finded string lines converted into numbers

a=strfind(tline4,'E');

a11=tline4(1:a(1)+3);
a11=str2num(a11);

a12=tline4(a(1)+4:a(2)+3);
a12=str2num(a12);

a13=tline4(a(2)+4:a(3)+3);
a13=str2num(a13);

a14=tline4(a(3)+4:a(4)+3);
a14=str2num(a14);

%  subsuite the values of a1 to a14 to calculate the enthalpy,entropy & specific_heat
% Applying the universal gas constant
R=8.134;
T=linspace(loc_low_temp,loc_high_temp,300);
% calling the function's of cp,H,S
cp=specific_heat(a1,a2,a3,a4,a5,a6,a7,a8,a9,a10,R,T,loc_mid_temp);
H=enthalpy(a1,a2,a3,a4,a5,a6,a8,a9,a10,a11,a12,a13,loc_mid_temp,T);
S=entropy(a1,a2,a3,a4,a5,a7,a8,a9,a10,a11,a12,a14,loc_mid_temp,T);


% plotting
% creating a folder 'SPECIES' to save all the species_name

mkdir('E:\MATHLAB INSTALLED\bin\file')

% plotting Cp vs T
figure(1);
plot(cp,T,'linewidth',3,'Color','r');
title('specific_heat vs temperature');
xlabel('Specific_heat [j/k]');
ylabel('Temperature [k]');
saveas(1,'cp_vs_t.jpeg');
grid on

% plotting H vs T
figure(2);
plot(H,T,'linewidth',3,'Color','b');
title('enthalpy vs temperature');
xlabel('Enthalpy [j]');
ylabel('Temperature [k]');
saveas(2,'H_vs_T.jpeg');
grid on

% plotting S vs T
figure(3);
plot(S,T,'LineWidth',3,'Color','g');
title('entropy vs temperature');
xlabel('Entropy [kj-1/mol-1]');
ylabel('Temperature [k]');
saveas(3,'S_vs_T.jpeg');
cd ('E:\MATHLAB INSTALLED\bin\file') ;
grid on

molecular_weight= mol_weight(species_name)

end
Code Explanation
- Firstly, we will Input the parameter R and we will open a file THERMO.DAT file and reading this file using fopen
command. - Then, we will read first THERMO using fgetl command and then we read temperature file and we will split the
temperatures using strsplit command to convert it into cell array and then we will convert this string to numbe
using str2num command to find low, high and mid temperatures. - Then we will assign temperature range using linspace command. Then we run loop to skip command lines the
data file using fgetl command inside the loop. - Now, we will run the loop to find 53 element in the data file by assigning fgetl command and then spliting into
the cell array to find the species line and then find the species name and then find the number of the
temperatures in the species line. - Then we read the new line. In order to read the coefficient in the data file we will first find the’ string using
strfind command to find before and after numbers of the coefficients then we will find remaining 14 coefficient
and convert them to numbers from strings. - Out of which we will find first 7 Coefficients which are for Higher temperature and then Second 7 Coefficients
which are for Lower temperature. - Now we will specify Specific heat Cp, Entropy S, Enthalpy H functions to find these parameters using these 14
coefficients for Lower and higher Temperature. then we will specify molecular weight W function to find the
Molecular weight of the different species. - Now we will write the Molecular weighttxt file and fprintf all the molecular weights of the species. and then
close the txt file using felose command. - Now we change the directory using ed command and then creating directory folder where we have to save ou
files using mkdir command and then we will change the directory to this created folder. - Now, we will plot Specific heat, Entropy and Enthalpy with the Temperature for different species. We we will
use scanf command to in the title command to create different species title.
Then we will use saveas command to save the plots of different species in the directory folder. Now we will
change the directory to which our main code file runs in the MATLAB.
New command learned in this program:
fopen-This command is used to open the data from the folder.
fgetl-This command is used to read the required data and also used to skip the data
strsplit-This command is used to split of group of words into seperate words.
str2num-This command is used for convert the string in to numbers for further purpose.
findstr-This command is used to find a letter or number in a line
mkdir-This command is used to create a folder.
saveas-This command is used to save the plots as images
Function codes
%function to find specific heat:

function [cp]=specific_heat(al,a2,a3,a4,a5,a6,a7,a8,a9,a10,R,T,loc_mid_temp);

if T>=loc_mid_temp

cp=(al+a2.*(T) +a3.* (T.^2)+a4.* (T.^3)+a5.* (T.^4))*R;

else

[cp]=(a6+a7.*(T)+a8.* (T.^2)+a9.* (T.^3)+a10.* (T.^4))*R;

end

end


%function code to find the entropy

function[S] = entropy(a1,a2,a3,a4,a5,a7,a8,a9,a10,a11,a12,a14,loc_mid_temp,T)
R = 8.314;
if (T>loc_mid_temp)
S = R*(a1*logT)+(a2*T)+((a3*(T.^2))/2)+((a4*(T.^3)/3)+(a5*(T.^4)/4)+a7);
else
S = R*((a8*log(T)+(a9*T)+(a10*(T.^2)/2)+(a11*(T.^3))/3)+(a12*(T.^4)/4)+a14);
end


function[H] = enthalpy(a1,a2,a3,a4,a5,a6,a8,a9,a10,a11,a12,a13,loc_mid_temp,T)
R = 8.314;
if (T>loc_mid_temp)
H = ((a1+((a2*T)/2)+(a3*(T.^2))/3)+((a4*(T.^3))/4)+((a5*(T.^4))/5)+(a6./T)).*T*R;
else
H = ((a8+((a9*T)/2)+((a10*T.^2))/3)+((a11*(T.^3))/4)+((a12*(T.^4))/5)+(a13./T)).*T*R;
end


function [w]=mol_weight(species_name)
atomic_names=['H', 'C', 'o', 'N', 'A'];
atomic_weights=[1.00784,12.0107,15.999,14.0067,39.948];
w=0;

for i=1:length(species_name)

for j=1:length(atomic_names)
if strcmpi(species_name(i), atomic_names (j))
    w=w+atomic_weights(j)

pos=j;

end
end
n=str2double(species_name(i));


if n>1

    w =w+atomic_weights(pos)*(n-1);

end
end
fprintf('Molecular weight of %s = %f', species_name, w);

end
Molcular weight for each species is calculated listing down few species below.
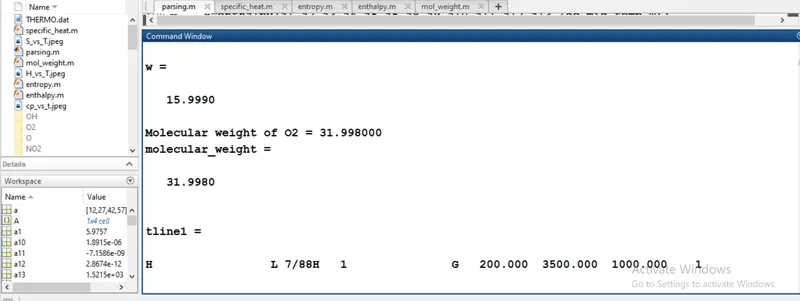
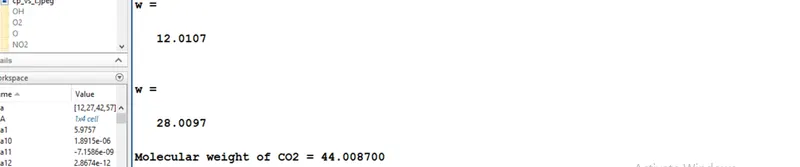
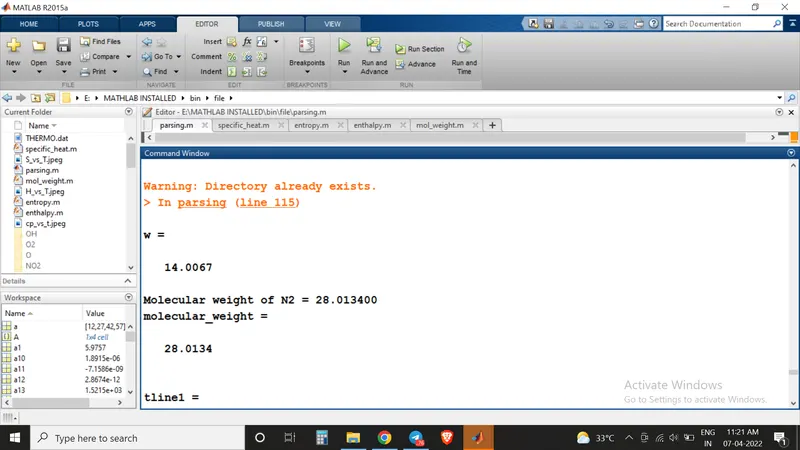
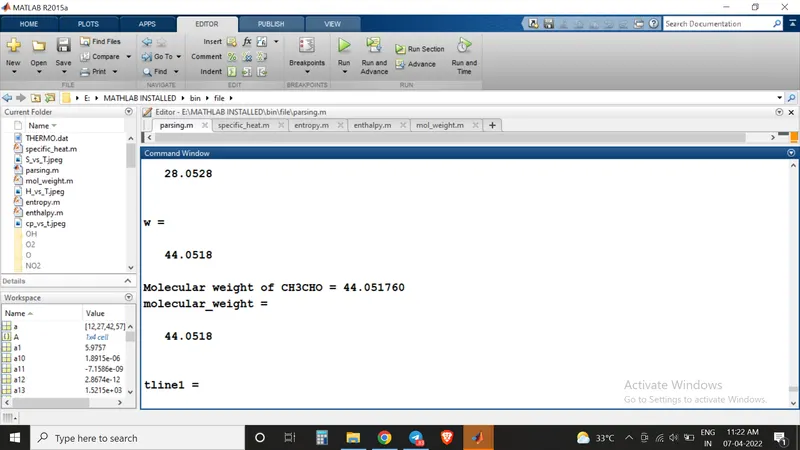
Figure displaying saved folder of various species
Plot for O2 species
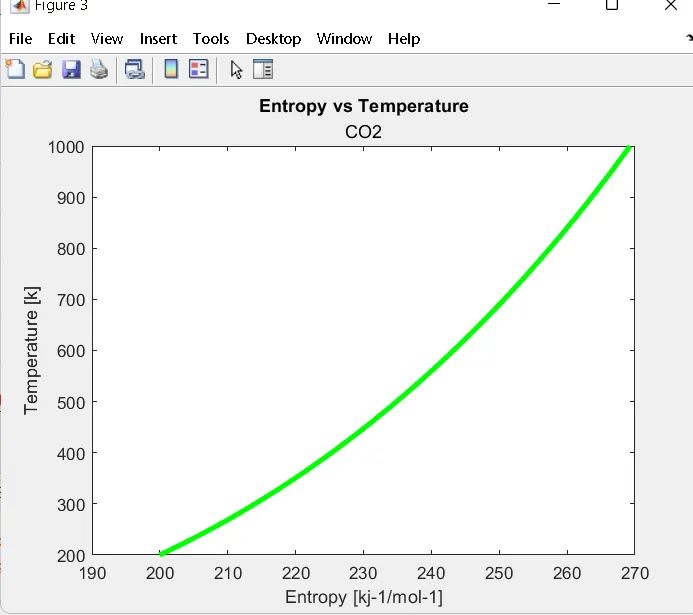
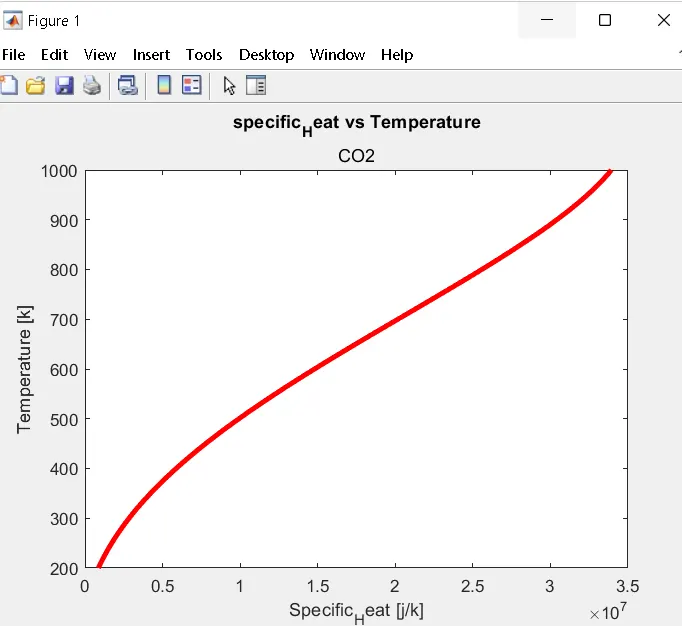
Plot for CO2 species
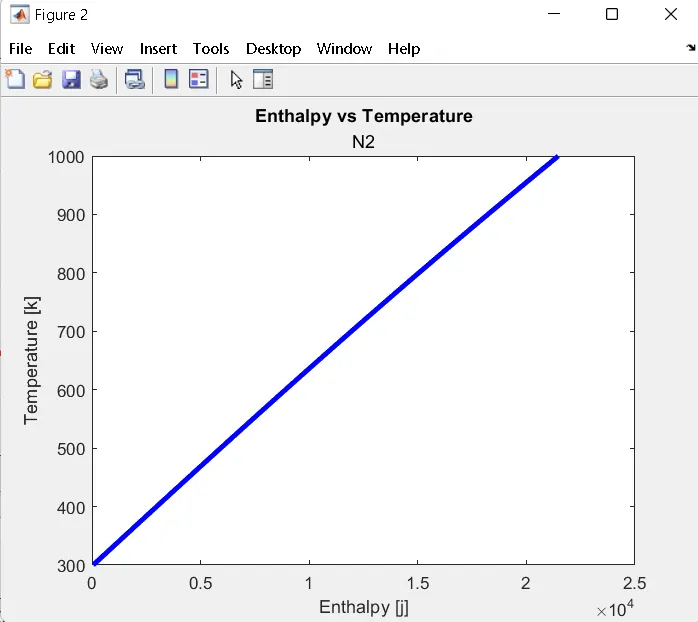
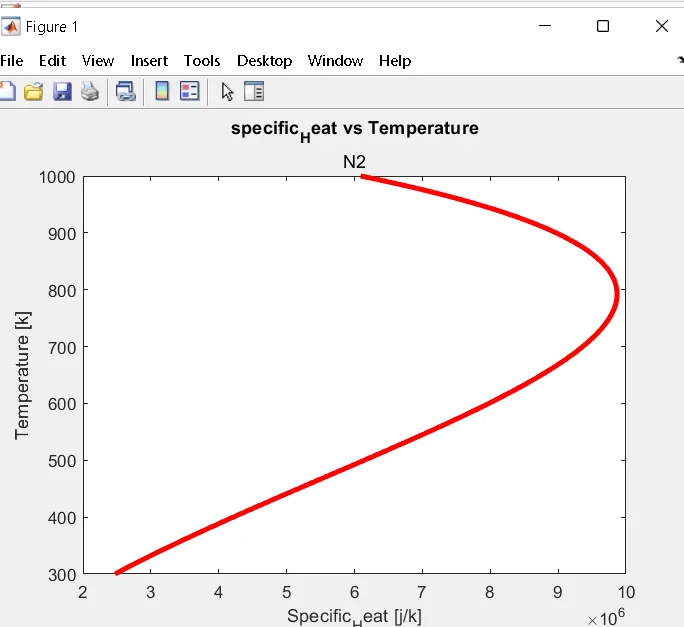
Plot for N2 species
Error
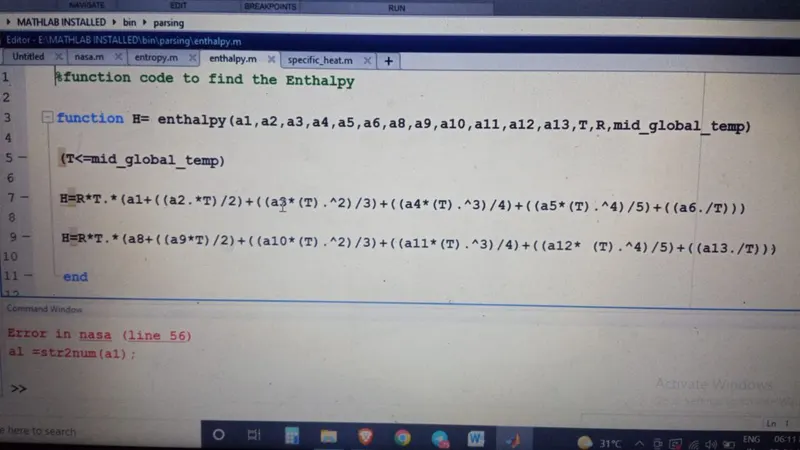
I got many typing errors, but the major error was I didn't save the Thermo.dat file in a correct folder and made lot of errors in function codes
Conclusion
Thus using Matlab,the specific-heat,enthalpy,entropy from all the species from the given NASA thermodynamic
data file had been read and calculated.