Project 1 - Parsing NASA thermodynamic data
Aim:- To Parsing NASA thermodynamic data using MATLAB.
Governing Equations:-

where,
Cp = Specific heat
H = Enthapy
S = Entropy
R = Universal gas constant (8.314 J/mol.k)
* The first 7 coefficients are high temperature coefficients and the second 7 coefficients are low temperature coefficients.
Objective:-
1. Write a function that extracts the 14 co-efficients and calculates the enthalpy, entropy and specific heats for all the species in the data file.
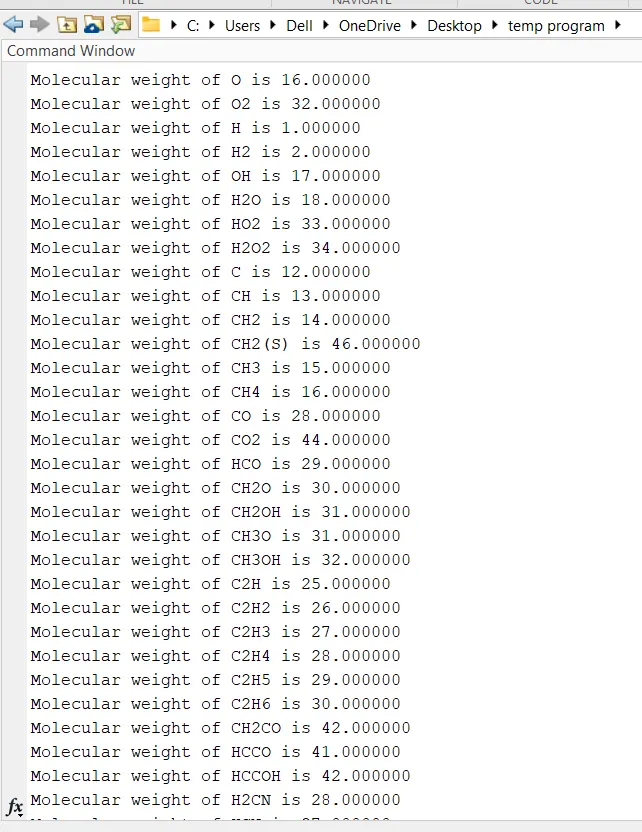
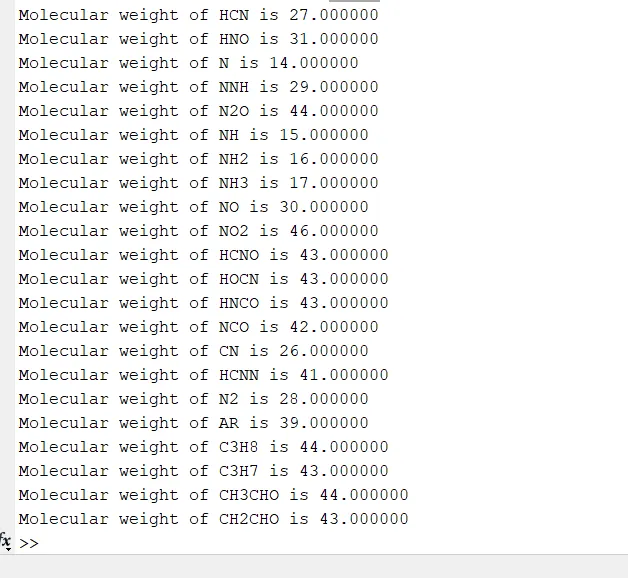
2. Calculate the molecular weight of each species and display it in the command window.
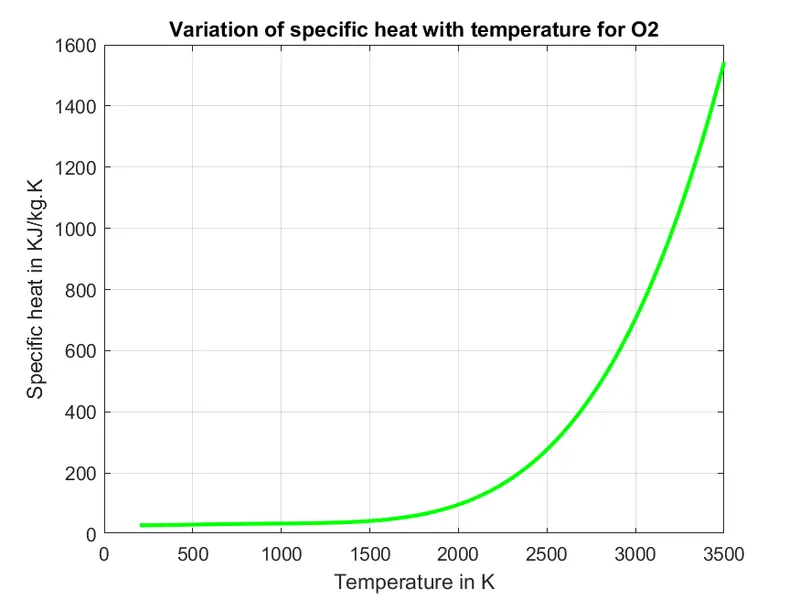
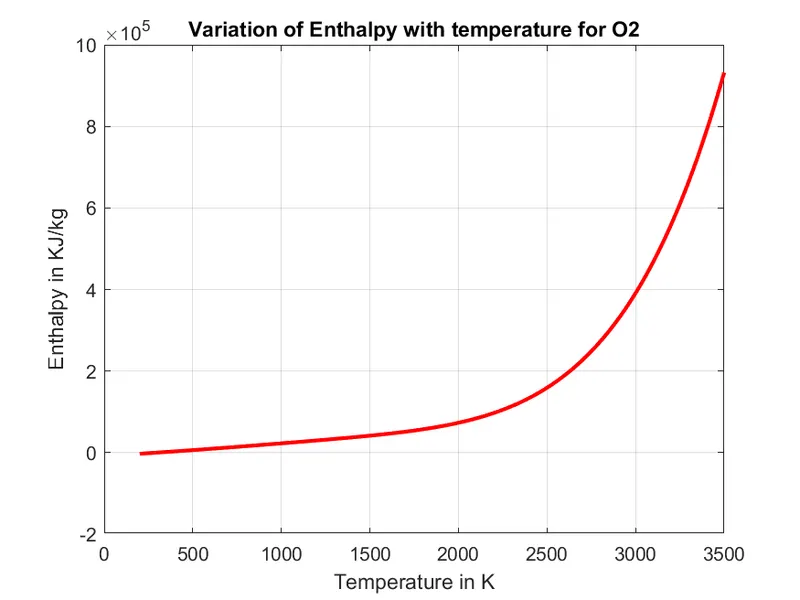
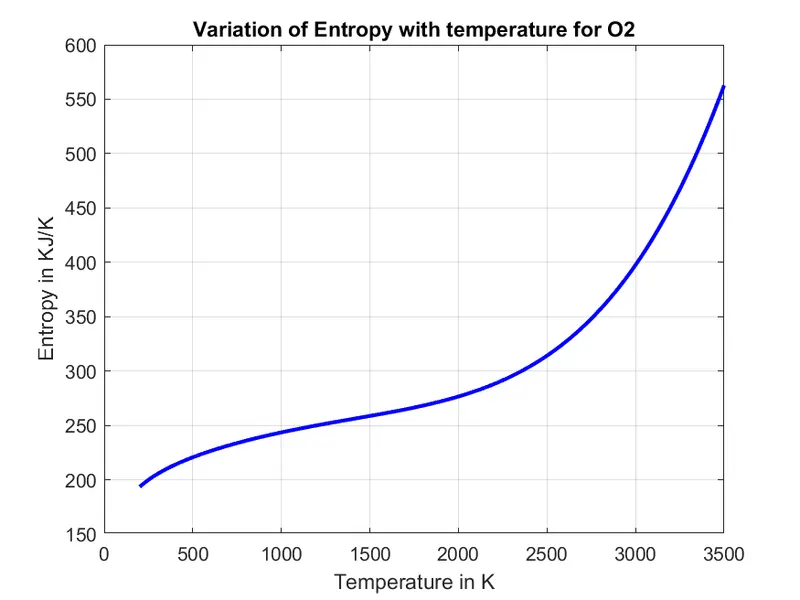
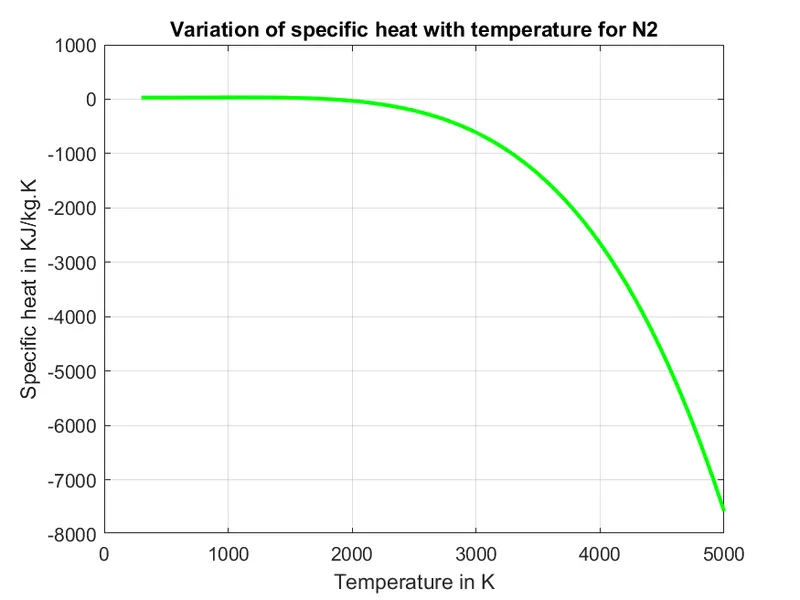
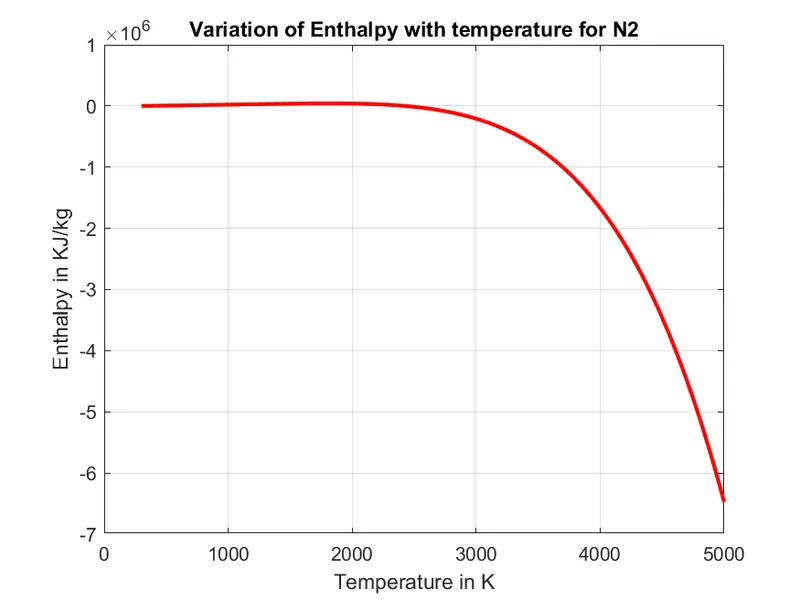
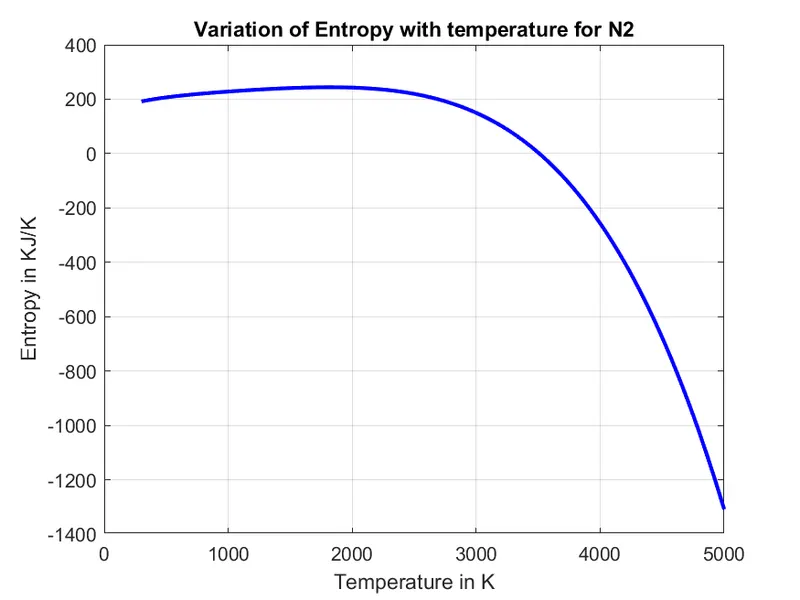
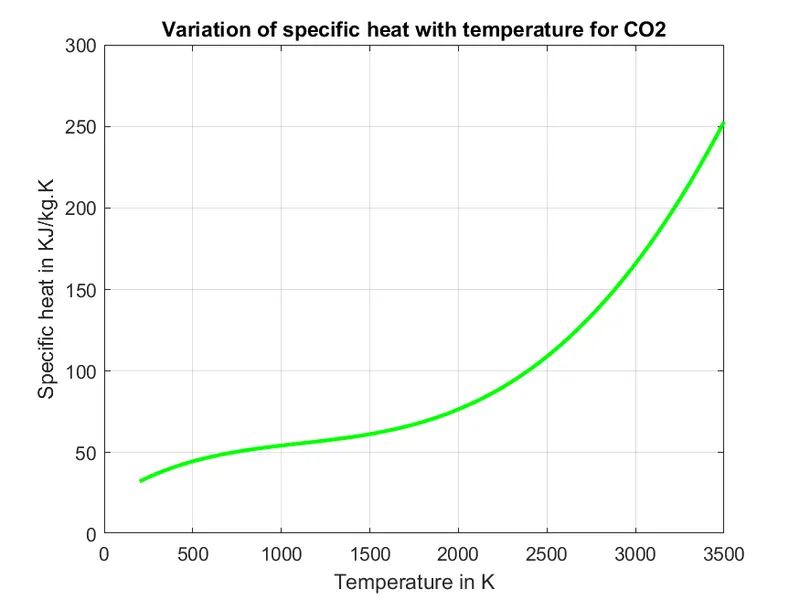
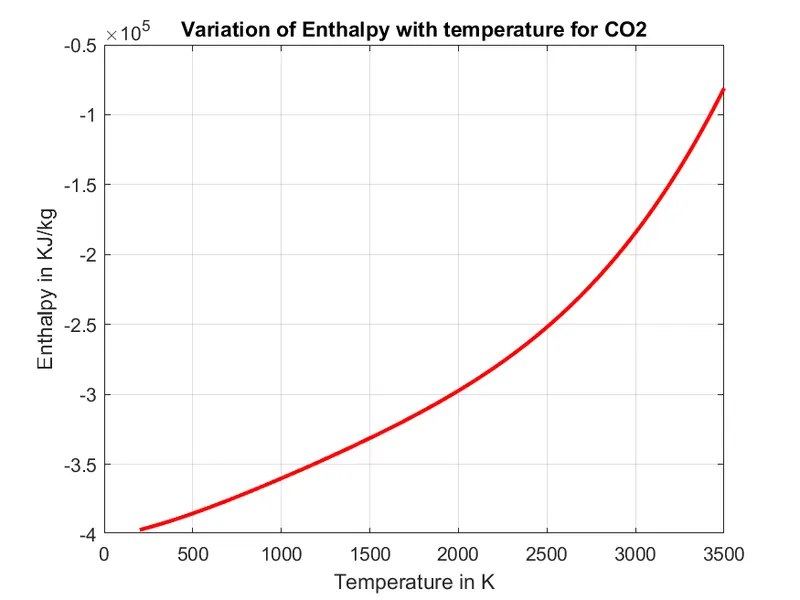
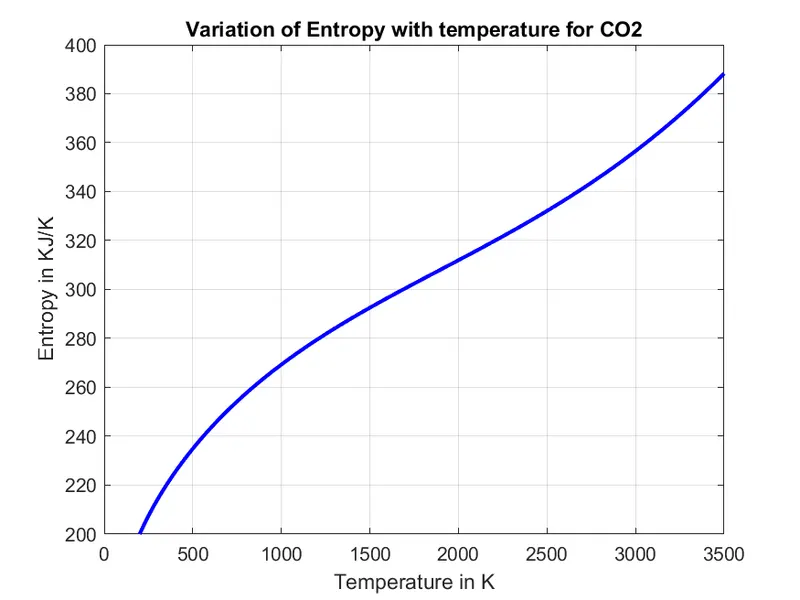
3. Plot the Cp, Enthalpy and Entropy for the local temperature range (low temperature : high temperature) specific for each species.
4. Save the plots as images with appropriate names and dump them in separate folders for each species with suitable name.
Main Prpgram:-
clear all
close all
clc

% Getting data from provided file
f1 = fopen('THERMO.dat', 'r');
file_name = fgetl(f1);
aa = fgetl(f1);
tt = strsplit(aa, ' ');

% Defining the temperature extracted from data file
global_low_temp = str2num(tt{2});
global_mid_temp = str2num(tt{3});
global_high_temp = str2num(tt{4});

% To eliminate comment lines
for i=3:5
     fgets(f1);
end

% To get species data
for j=1:53
    tline=fgetl(f1);
    A = strsplit(tline, ' ');
    species = (A{1});
    pos_dot=strfind(tline,'.');
    low_temp = tline(pos_dot(1)-3:pos_dot(1)+3);
    low_temp = str2num(low_temp);
    high_temp = tline(pos_dot(2)-4:pos_dot(2)+3);
    high_temp =  str2num(high_temp);
    mid_temp = tline(pos_dot(3)-4:pos_dot(3)+3);
    mid_temp =  str2num(mid_temp);

    dataline_1 = fgetl(f1);
    dataline_2 = fgetl(f1);
    dataline_3 = fgetl(f1);

    A = strfind(dataline_1,'E');
    B = strfind(dataline_2,'E');
    C = strfind(dataline_3,'E');

    t1 = dataline_1(1:A(1)+3);
    t1 = str2num(t1);
    t2 = dataline_1(A(1)+4:A(2)+3);
    t2 = str2num(t2);
    t3 = dataline_1(A(2)+4:A(3)+3);
    t3 = str2num(t3);
    t4 = dataline_1(A(3)+4:A(4)+3);
    t4 = str2num(t4);
    t5 = dataline_1(A(4)+4:A(5)+3);
    t5 = str2num(t5);

    t6 = dataline_2(1:B(1)+3);
    t6 = str2num(t6);
    t7 = dataline_2(B(1)+4:B(2)+3);
    t7 = str2num(t7);
    t8 = dataline_2(B(2)+4:B(3)+3);
    t8 = str2num(t8);
    t9 = dataline_2(B(3)+4:B(4)+3);
    t9 = str2num(t9);
   t10 = dataline_2(B(4)+4:B(5)+3);
   t10 = str2num(t10);

   t11 = dataline_3(1:C(1)+3);
   t11 = str2num(t11);
   t12 = dataline_3(C(1)+4:C(2)+3);
   t12 = str2num(t12);
   t13 = dataline_3(C(2)+4:C(3)+3);
   t13 = str2num(t13);
   t14 = dataline_3(C(3)+4:C(4)+3);
   t14 = str2num(t14);


T = linspace(low_temp, high_temp,500);
R = 8.314;

% specific heat calculation
cp = specific_heat(t1,t2,t3,t4,t5,t6,t7,t8,t9,t10,t11,t12,t13,t14,T,R,low_temp,high_temp,mid_temp);

% Entahlpy calculation
H = enthalpy(t1,t2,t3,t4,t5,t6,t7,t8,t9,t10,t11,t12,t13,t14,T,R,low_temp,high_temp,mid_temp);

% Entropy calculation
S = entropy(t1,t2,t3,t4,t5,t6,t7,t8,t9,t10,t11,t12,t13,t14,T,R,low_temp,high_temp,mid_temp);

% Saving in a folder
cd('C:\Users\Dell\OneDrive\Desktop\temp program')
mkdir(species);
cd(species);

% To plot varation of cp with T
figure(1)
plot(T, cp, 'linewidth',2,'color','g')
xlabel('Temperature in K')
ylabel('Specific heat in KJ/kg.K')
grid on
title(sprintf('Variation of specific heat with temperature for %s', species))
saveas(figure(1),'cp.png');

% To plot variation of enthapy with temperarure
figure(2)
plot(T, H, 'linewidth',2,'color','r')
xlabel('Temperature in K')
ylabel('Enthalpy in KJ/kg')
grid on
title(sprintf('Variation of Enthalpy with temperature for %s', species))
saveas(figure(2),'H.png');

% To plot variation of entropy with temperarure
figure(3)
plot(T, S, 'linewidth',2,'color','b')
xlabel('Temperature in K')
ylabel('Entropy in KJ/K')
grid on
title(sprintf('Variation of Entropy with temperature for %s', species))
saveas(figure(3),'S.png');

cd('C:\Users\Dell\OneDrive\Desktop\temp program')

% To calculate molecular weight
 Molecular_wt = molecular_weight(species);
 k = sprintf('Molecular weight of %s is %f', species,Molecular_wt);
 disp(k)

end
Function Program:-1 For calculating specific heat-
function cp = specific_heat(t1,t2,t3,t4,t5,t6,t7,t8,t9,t10,t11,t12,t13,t14,T,R,low_temp,high_temp,mid_temp)
if T>mid_temp
    cp = (t1+t2.*(T)+t3.*(T.^2)+t4.*(T.^3)+t5.*(T.^4))*R;
else
    cp = (t8+t9.*(T)+t10.*(T.^2)+t11.*(T.^3)+t12.*(T.^4))*R;
end
end
Function Program:-2 For calculating Enthalpy-
function [H] = enthalpy(t1,t2,t3,t4,t5,t6,t7,t8,t9,t10,t11,t12,t13,t14,T,R,low_temp,high_temp,mid_temp)
if T>mid_temp
    H = (t1.*T+t2.*(T.^2)./2+t3.*(T.^3)./3+t4.*(T.^4)./4+t5.*(T.^5)./5+t6)*R;
else
    H = (t8.*T+t9.*(T.^2)./2+t10.*(T.^3)./3+t11.*(T.^4)./4+t12.*(T.^5)./5+t13)*R;
end
end
Function Program:-3 For calculating Entropy-
function S = entropy(t1,t2,t3,t4,t5,t6,t7,t8,t9,t10,t11,t12,t13,t14,T,R,low_temp,high_temp,mid_temp)
if T>mid_temp
    S = (t1.*log(T)+t2.*T+t3.*(T.^2)./2+t4.*(T.^3)./3+t5.*(T.^4)./4+t7)*R;
else
    S = (t8.*log(T)+t9.*T+t10.*(T.^2)./2+t11.*(T.^3)./3+t12.*(T.^4)./4+t14)*R;
end
end
Function Program:-4 For calculating Molecular weight-
function[molecular_weight] = molecular_weight(species);
elements = {'H','C','O','N','A','S'};
atomic_weight = [1,12,16,14,39,32];
molecular_weight=0;
 for i=1:length(species)
     for j=1:length(elements)
         if strcmp(species(i),elements(j))
             molecular_weight = molecular_weight+atomic_weight(j);
             a=j;
         end
         end
       n = str2num(species(i));
       if(n>1)
             molecular_weight = molecular_weight+(atomic_weight(a)*(n-1));
     end
 end
end
Code explations:-
*clera all- To clear all variables from current workplace.
*close all- close all figures whose handles are visible.
*clc - clc clears all the text from the command window.
*fopen()- it is used for an open a file or obtains information about open files.
*fgetl() - it is used to transfer the data from the input buffer to the MATLAB.
*strsplit()- Split string or character vector at specified delimiter.
*str2num()- it is used to converts a character array or string scalar to a numeric matrix.
*strfind()- it is used to find occurrences of a string within another string.
*linspace()- This function will generate a vector of values linearly spaced between two endpoints.
*mkdr()- it is used to create folders in remote locations.
*cd()- it is used to change working directory.
*plot()- creates a 2-D line plot .
*xlabel()- It labels the x-axis of the current plot.
*ylabel()- It labels the y-axis of the current plot.
*title()- add a title to a plot.
*grid on- It displays grid lines.
*sprintf()- it is used to write formatted data to a string.
*strcmp()- This command used to compare two or more strings.
* Use the Function concept for calculating the specific heat , enthalpy , entropy and molecular weight.
Output:-
*command window displaying molecular weight.
*Location of SPECIES folder.

*Plots-
*For O2-
*For N2-
* For CO2-
References:-
https://in.mathworks.com/help/matlab/
https://skill-lync.com/student-projects/project-1-parsing-nasa-thermodynamic-data-309