Project 1 - Parsing NASA thermodynamic data
AIM: Write a code to parse the NASA Thermodynamic data file using MATLAB and calculate the thermodynamic properties of various gas species.
OBJECTIVE:
- Write a function that extracts the 14 co-efficients and calculates the enthalpy, entropy and specific heats for all the species in the data file.
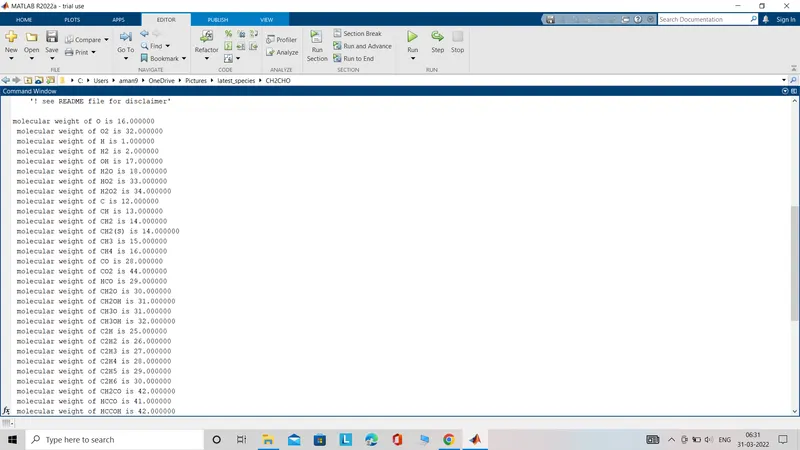
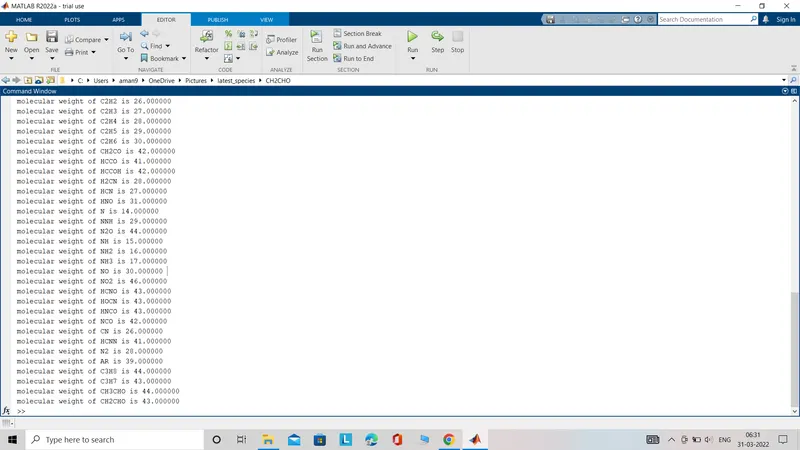
- Calculate the molecular weight of each species and display it in the command window.
- Plot the Cp, Enthalpy and Entropy for the local temperature range (low temperature : high temperature) specific for each species.
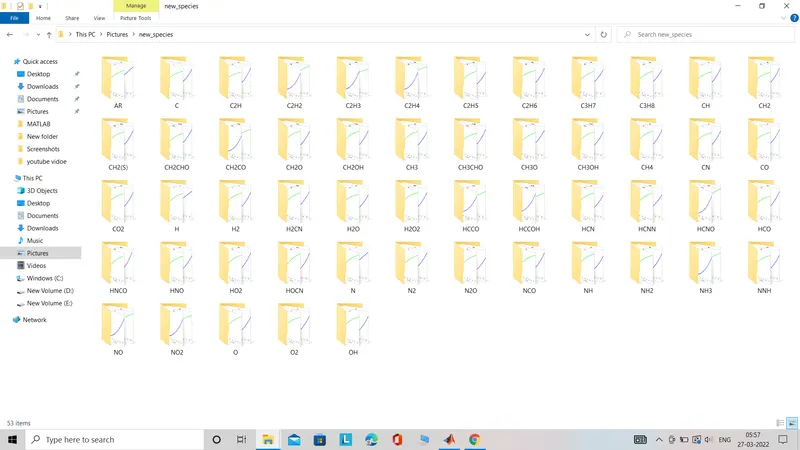
- Save the plots as images with appropriate names and dump them in separate folders for each species with suitable name. All these should be generated automatically.
THEORY:
What is file parsing?
- File parsing basically refers to how information can be read from a particular text file or any other file and how that information can be used in computer program.
- The term PARSING refers to reading the m-file (script or function) and then translating it to the internal code that MATLAB stores in its memory. If we execute the code then the file which is parsed in the memory will run.
Specific Heat: It is the amount of heat required to raise the temperature of unit mass of a substance through 1 degree celcius.
given by
Cp/R= a1+ a2*t + a3*t^2 + a4*t^3 + a5*t^4
Specific enthalpy: Enthalpy is the measurement of energy in a thermodynamic system. The quantity of enthalpy equals to the total content of heat of a system, equivalent to the system’s internal energy plus the product of volume and pressure.
H/RT= a1 + a2*t/2 + a3*t^2/3 + a4*t^3/4 + a5*t^4/5 + a6/t
Entropy : Generally, entropy is defined as a measure of randomness or disorder of a system. From a thermodynamic viewpoint of entropy, we do not consider the microscopic details of a system. Instead, entropy is used to describe the behaviour of a system in terms of thermodynamic properties such as temperature, pressure, entropy, and heat capacity. This thermodynamic description took into consideration the state of equilibrium of the systems.
S/R= a1*logt + a2*t + (a3*t^2)/2 + (a4*t^3)/3 + (a5*t^4)/4 +a7
where S - ENTROPY
R - Universal gas constant
H - enthalpy
Cp - specific heat
t - temperature
NOTE - The FIRST 7 coefficients are HIGH-temperature coefficients and the SECOND 7 coefficients are LOW-temperature coefficients.
SOME SUB FUNCTION USED IN MAIN PROGRAMS ARE GIVEN BELOW
1. Function to calculate the molecular weight of the species
% Function to calculate the molecular weight of species

function MW = molecular_weight(species_name)         % defining function
upper_species_name=upper(species_name)               % coneverting the species name into capital
atomic_weights = [1,12,14,16,39];                     % array to store the atomic weights of elemenst used in data
elements_name = ['H','C','N','O','A'];                % array to store all elements name
  MW=0;                                              % counter to calculate the molecular weight
 for i= 1:length(upper_species_name)                 % iteration till length of species_name
    for j = 1:length(elements_name)                  % iteration till the length of elements_name array
         if strcmp(upper_species_name(i),elements_name(j))  % comparing strings by strcmp
         MW=MW+atomic_weights(j);                     % calculating the molecular weight
         position=j;                                  % storing the position of element
         end                                          % terminating the  if condition
    end                                               % terminating the 'for j'loop
% coding for a numeric value if present in a species
     n=str2double(upper_species_name(i));            % Converting strings to number and storing in 'n'
     if n>1                                          % condition- if no. of atoms are more than 1
      MW=MW+atomic_weights(position)*(n-1)           % calculating the molecular weight
     end                                             % terminating the if condition
 end                                                 % terminating the 'for i' loop
end                                                  % terminating the function
Explanation of the function which calculates the molecular weight
- Function named molecular_weight is defined first.
- The species name is converted to upper case
- An array of atomic_weights is created which contains the atomic masses of the elements.
Another array is created naming elements_name which stores the elements name and the counter is intialiazed that is MW=0 - for loop is used which runs from 1 to the length of the species_ name variable which contain the name of the species.
Another for loop is created which runs from 1 to the length of element_name - Now compare the every elements of species_name string with the every elements of an element_name array by using the 'strcmp' command. If elements matches with each other then the atomic weight of that element is added with the counter and counter value is increased by that value and position of that element is stored in a variable named as 'position'.
- If condition is terminated and nested loop is also terminated i.e 'for j'.
If the numeric value is present in the species name then first convert every element of species name in numeric form by using the str2num command and store it in the variable named as 'n' . - If value of n is greater than 1 then Molecular weight is calculated by using the concept MW=MW+atomic_weights(position)*(n-1) and at last the 'fprintf' command is used to print the statement i.e '' molecular weight of species_name is MW'
- And atlast the main iteration and function is closed by using end commands
-
2. Function to calculate the entropy
% function to calculate the entropy

function s=entropy(a1,a2,a3,a4,a5,a8,a9,a10,a11,a12,temp_range,R,local_med_temp)                             % defining the function
    if(temp_range<=local_med_temp)                                                                           % checking the condition
    s=R*( a1*log(temp_range)+ a2*temp_range + (a3*temp_range.^2)/2 + a4*temp_range.^3 + a5*temp_range.^4);   % calculation of entropy if condition is true
    else                                                                                                     % if  condition is not satisfied
    s=R*( a8*log(temp_range)+ a9*temp_range + (a10*temp_range.^2)/2 + a11*temp_range.^3 + a12*temp_range.^4);% calulation of entropy if condition is not true
    end                                                                                                      % terminating the if condition
end                                                                                                          % terminating the function
- Function entropy is defined by putting the vales of coefficients a1,a2,a3,a4,a5,a8,a9,a10,a11,a12, temp_range,R,local_med_temp as inputs.
- If temp_range value is less than or equals to local_med_temp then the entropy is found by realation as given below
- s=R*( a1*log(temp_range)+ a2*temp_range + (a3*temp_range.^2)/2 + a4*temp_range.^3 + a5*temp_range.^4)
- otherwise
- s=R*( a8*log(temp_range)+ a9*temp_range + (a10*temp_range.^2)/2 + a11*temp_range.^3 + a12*temp_range.^4)
- At last if and for loop both are terminated.
3. FUNCTION TO CALCULATE THE ENTHALPY
% calculation of enthalpy

function H = enthalpy(a1,a2,a3,a4,a5,a6,a8,a9,a10,a11,a12,a13,temp_range,R,local_med_temp)                                           % defining the function

    if (temp_range>local_med_temp)                                                                                                   % checking the condition
    H= R.*(a1.*temp_range + (a2.*temp_range.^2)./2 + (a3.*temp_range.^2)./3 + (a4.*temp_range.^3.)/4 + (a5.*temp_range.^4)./5 + a6); % calculating the enthalpy
    else                                                                                                                             % if condition is not satisfied
    H= R.*(a8.*temp_range + (a9.*temp_range)./2 + (a10*temp_range.^2)/3 + (a11.*temp_range.^3)./4 + (a12.*temp_range.^4)./5 + a13);  % calculating the enthalpy
    end                                                                                                                              % terminating the if condition

end - Function named as enthalpy is defined by using a1,a2,a3,a4,a5,a6,a8,a9,a10,a11,a12,a13,temp_range,R,local_med_temp as inputs.
- If the temp_range is greater than than the local_med_temp then the enthalpy is calculated as given below
- At the last function is terminated
4. FUNCTION TO CALCULATE THE SPCIFIC HEAT
%function to find the specific heat
%calculating the specific heat for LOWER and HIGHER temperature respectively
function cp=specific_heat(a1,a2,a3,a4,a5,a8,a9,a10,a11,a12,temp_range,R,local_med_temp)        % defining  function name

    if(temp_range<=local_med_temp)                                                             % defining the ' if'condition
    cp=R*(a8+(a9*temp_range)+(a10*temp_range.^2)+(a11*temp_range.^3)+(a12*temp_range.^4));     % calculating the cp if condition matches
    else                                                                                       % if condition not matches then
    cp=R*(a1+(a2*temp_range)+(a3*temp_range.^2)+(a4*temp_range.^3)+(a5*temp_range.^4));        % calculate cp using lower temperature
    end                                                                                        % terminating the  'if' condition
end - Function named as sppecific_heat is defined which takes a1,a2,a3,a4,a5,a8,a9,a10,a11,a12,temp_range,R,local_med_temp as inputs.
- If the temp_range is less than equals to the local_med_temp then the specific heat is claculated as
- At last the function is terminated
MAIN PROGRAM
clear all                                                                   % clear workspace
close all                                                                   % delete the old figures
clc                                                                         % clear the command window

% Reading the header file of NASA
f1=fopen('thermo.dat','r')                                                  % opening the thermo.dat file
for i=1:5;                                                                  % loop to read the first 5 lines as comments
   comments= fgetl(f1)                                                      % used to get each line one by one
end                                                                         % terminating the for loop

% Reading all species
R =8.314;                                                                    % universal gas constant
for j= 1:53;                                                                 % loop to get all 53 species coefficients

%% logic to find the species name and local temperatures
line6 = fgetl(f1);                                                           % used to get line as string
split_line6=strsplit(line6,' ') ;                                            % splitting the line using ' ' as delimeter
species_name=split_line6{1};                                                 % getting species name
find_dot=findstr(line6,'.');                                                 % finding the position of '.' in a line
local_low_temp= str2num(line6(find_dot(1)-3:find_dot(1)-1));                 % finding the local low temperature
local_med_temp=str2num(line6(find_dot(2)-4:find_dot(2)));                    % finding the local med temperature
local_high_temp=str2num(line6(find_dot(3)-4:find_dot(3)));                   % finding the local high temperature

%% logic to find all 14 coefficients
line7=fgetl(f1);                                                            % reading line
find_E1=findstr(line7,'E');                                                 % finding the position of 'E'
a1=str2num(line7((1:find_E1(1))+3));                                        % finding the first coefficient as numeric value
a2=str2num(line7(find_E1(1)+4:find_E1(2)+3));                               % finding the second coefficient as numeric value
a3=str2num(line7(find_E1(2)+4:find_E1(3)+3));                               % finding the third coefficient as numeric value
a4=str2num(line7(find_E1(3)+4:find_E1(4)+3));                               % finding the fourth coefficient as numeric value
a5=str2num(line7(find_E1(4)+4:find_E1(5)+3));                               % finding the fifth coefficient as numeric value

line8=fgetl(f1);                                                             % reading line
find_E2=findstr(line8,'E');                                                 % finding the position of 'E' in line
a6=str2num(line8((1:find_E2(1))+3)) ;                                       % finding the 6th coefficient as numeric value
a7=str2num(line8(find_E2(1)+4:find_E2(2)+3));                               % finding the 7th coefficient as numeric value
a8=str2num(line8(find_E2(2)+4:find_E2(3)+3));                               % finding the 8th coefficient as numeric value
a9=str2num(line8(find_E2(3)+4:find_E2(4)+3));                               % finding the 9th coefficient as numeric value
a10=str2num(line8(find_E2(4)+4:find_E2(5)+3));                              % finding the 10th coefficient as numeric value


line9=fgetl(f1);                                                            % reading line
find_E3=findstr(line9,'E');                                                 % finding the position of 'E' in line
a11=str2num(line9((1:find_E3(1))+3));                                       % finding the 11th coefficient as numeric value
a12=str2num(line9(find_E3(1)+4:find_E3(2)+3));                              % finding the 12th coefficient as numeric value
a13=str2num(line9(find_E3(2)+4:find_E3(3)+3));                              % finding the 13th coefficient as numeric value
a14=str2num(line9(find_E3(3)+4:find_E3(4)+3));                              % finding the 14th coefficient as numeric value


temp_range=local_low_temp:local_high_temp;                                  % it stores the temperature range

%% finding all the thermodynamic properties

% calculating the specific heat
  cp=specific_heat(a1,a2,a3,a4,a5,a8,a9,a10,a11,a12,temp_range,R,local_med_temp);

%calculating the entropy
   s=entropy(a1,a2,a3,a4,a5,a8,a9,a10,a11,a12,temp_range,R,local_med_temp);

 % calculating the enthalpy
   H = enthalpy(a1,a2,a3,a4,a5,a6,a8,a9,a10,a11,a12,a13,temp_range,R,local_med_temp);

 % calculating molecular weight of the species

   MW = molecular_weight(species_name);
   fprintf('molecular weight of %s is %f \n ',species_name,MW)


 mkdir(['C:\Users\aman9\OneDrive\Pictures\latest_species\',species_name])   % creates subfolder inside 'latest_species' folder

% plotting all the graphs
figure(1)                                                                   % Create 1st figure window
plot(temp_range,cp,'linewidth',3,'Color','r')                               % creates 2d plot between temp_range and cp
title(species_name)                                                         % creates title of the plot
xlabel('temperature')                                                       % labelling the x axis as temperature
ylabel('specific heat')                                                     % labelling the y axis as specific heat

figure(2)                                                                   % Create 2nd figure window
plot(temp_range,H,'linewidth',3,'Color','B')                                % creates 2d plot between 'temp_range and H'
title(species_name)                                                         % creates title of the plot
xlabel('temperature')                                                       % labelling the x axis as 'Temperature'
ylabel(' ENTHALPY')                                                         % labelling the Y axis as 'ENTHALPY'

figure(3)                                                                   % Create 3rd figure window
plot(temp_range,s,'linewidth',3,'Color','g')                                % creates 2d plot between 'temp_range and s
title(species_name)                                                         % creates title of the plot
xlabel('temperature')                                                       % labelling the x axis as 'Temperature'
ylabel('ENTROPY')                                                           % labelling the y axis as 'Entropy'

% saving the images
cd(['C:\Users\aman9\OneDrive\Pictures\latest_species\',species_name])       % changes the current folder
saveas(1,'specific_heat','jpg')                                             % Save figure 1 to specfic_heat with jpg format
saveas(2,'enthalpy','jpg')                                                  % Save figure 2 enthalpy with jpg format
saveas(3,'entropy','jpg')                                                   % Save figure 3 to entropy with jpg format
end                                                                         % terminating the 'for j' loop
fclose(f1);                                                                 % closing the file f1
EXPLANATION OF MAIN CODE
- Program starts with usual commands clear all,close all and clc.
- THERMO.dat file is opened first by using the 'fopen' command and stored in f1 (means f1 will act as a function handle)
- For first 5 lines 'for' loop is used and all five lines are read as comments by using the 'fgetl' command.
- For reading and calculating the properties of all 53 species we have used 'for' loop (for j=1:53) which runs from 1 to 53
- Now the line 6 is splitted wherever the space is found and cell array is generated
so the 1st value of this cell array contains the name of species which is stored in a variable named as 'species_name'. - Now to find the local temperatures of the species firstly 'findstr' command is used which finds the position of '.' present in a line 6 and once the position is found then by using the position we can find the local temperatures.
Finding the local temperatures for a species
- Local low temp is found by getting the values between the range of 3 steps back from 1st dot ('.') position and 1 step back from 1st dot ('.') position and temperature we get here is still the string so to convert it into the numerical value we have used here 'str2num' command and the whole value in numeric is stored in a variable named as 'local_low_temp'.
- Similarly, to find the local med temperature value for a species 2nd dot position is taken into consideration and value is found between the range of 4 steps back from dot till the 2nd dot position and the answer we get is still in string so 'str2num' command convert it into numerical value and it is stored in a variable named as 'temp_med_temp'.
- To find the local high temperature value for a species 3rd dot ('.') position is taken into consideration and value is taken between the range of 4 steps back till the 3rd dot position and it is also converted to numerical value by using the 'str2num' and stored in a variable named as 'local_high_temp'.
Logic to find all 14 coefficients
- Line no. 7 is read by 'fgetl' command as a string.
- First step is to find the position of 'E' in a line by using the 'findstr' command then all the 5 coefficients are found present in the line as follows
a1(first coefficent) - it is found by taking value which lies between the position 1 to the 3rd position ahead of 'E' and this is converted to numerical value by using the 'str2num' command and stored in variable named as 'a1'.
similarly all the 5 coefficients are found by seeing the position of 'E' for a line. - Then line no.8 is also read by using the 'fgetl' command and the same concept is followed (as used earlier in the line no.7 ) to find the 5 coefficients.
- Then line no. 9 is read by 'fgetl' command and for this line alos the same concept is appplied and remaining 4 coefficients are found.
Temperature range is set from local low temperature to the local high temperature.
Finding all the thermodynamics properties
- Now the calculation of specific heat , entropy , enthalpy and the molecular weight for a species is done by making the separate function for each and their explanation is done already in the above portion.
- New directory is made to dump all the species name by using the 'mkdir' command.
Plotting the graphs
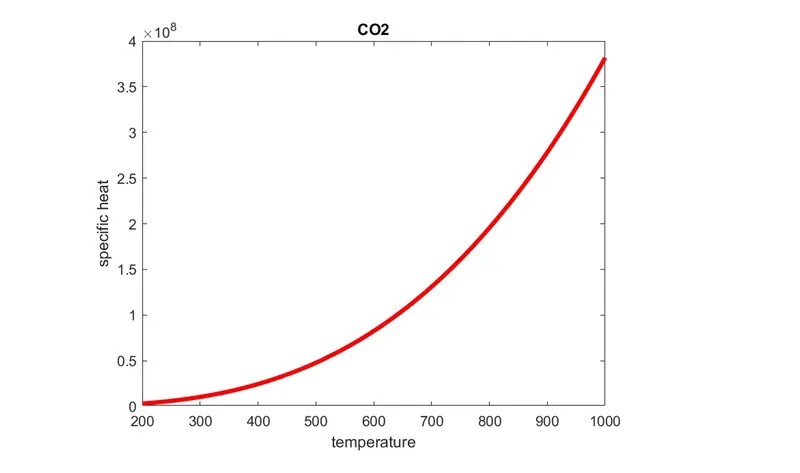
- First figure is plotted between 'temperature and specific heat' for a particular species with its name as a title of plot.
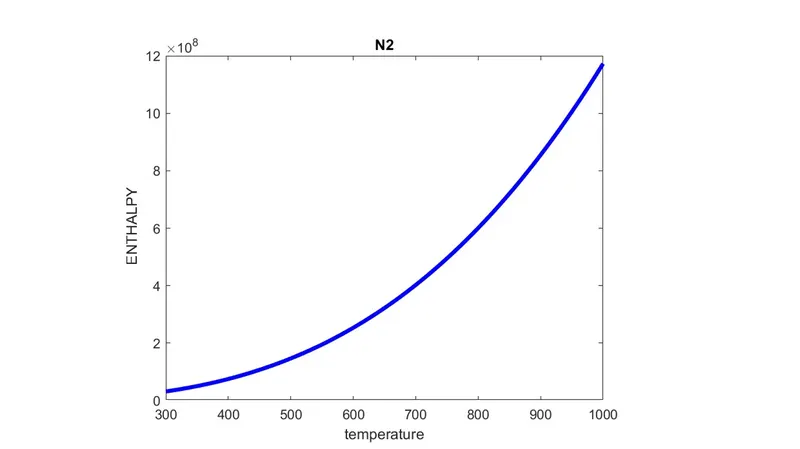
- Second figure is plotted between 'temperature and enthalpy' for aparticular species with its name as title
- Third figure is plotted between 'temperature and entropy' for a particular species with its name as a title.
Saving the images
- The current folder is changed to as shown :- 'C:\Users\aman9\OneDrive\Pictures\latest_species\
- The image of specific heat ,enthalpy and entropy of a species are saved in jpg format by using the 'saveas' command.
- The 'for j' LOOP is end at the last and it will repeat 52 more times after this to do the same process for other species.
- reading of the file is closed at the last by using 'fclose' command
-
MOLECULAR WEIGHTS ARE CALCULATED FOR EACH SPECIES AS SHOWN BELOW
ATTACHMENTS
1. Screenshot of the window where all files are dumped
2. Plots
A. For O2-(enthalpy, entropy and specific heat)
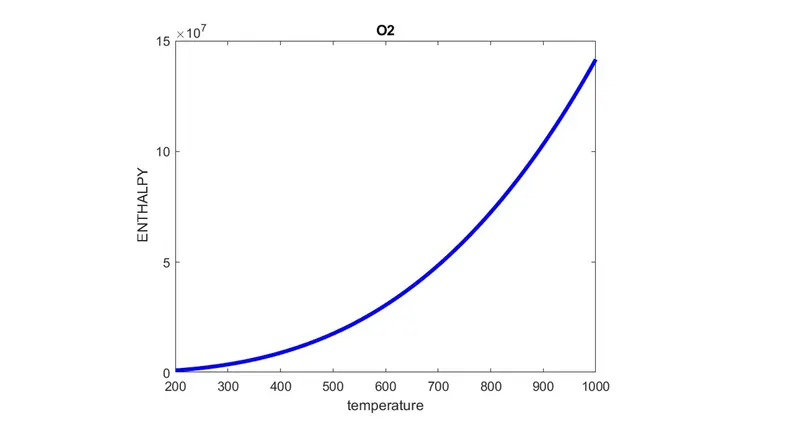
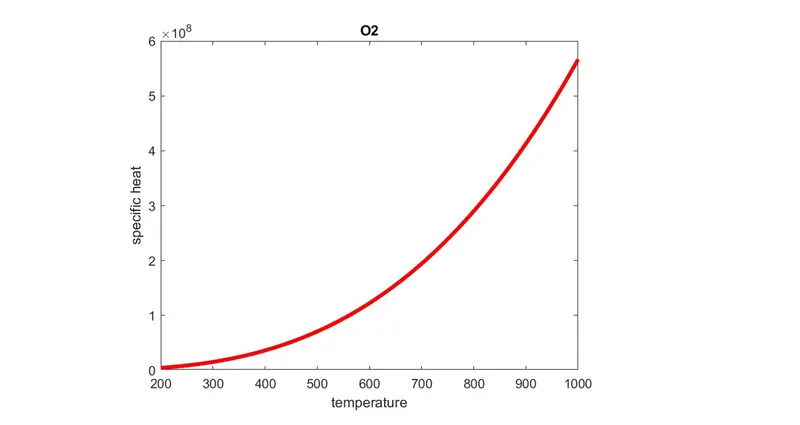
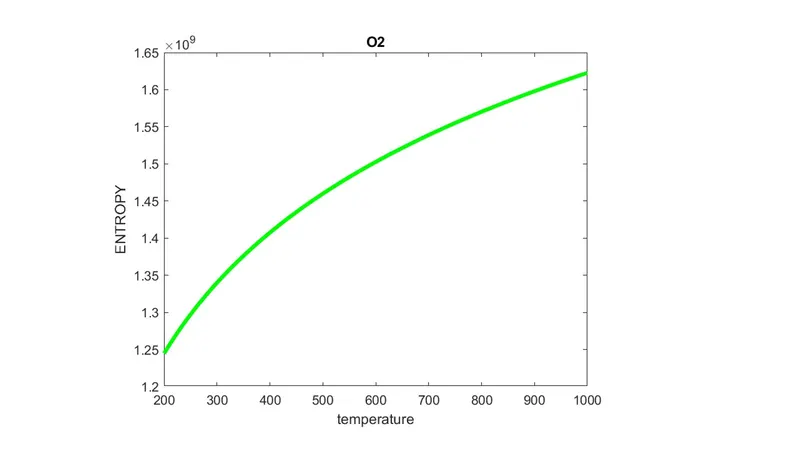
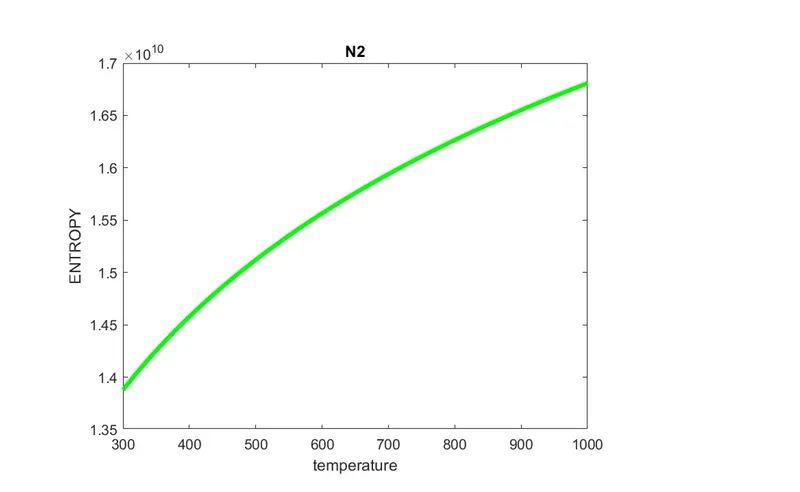
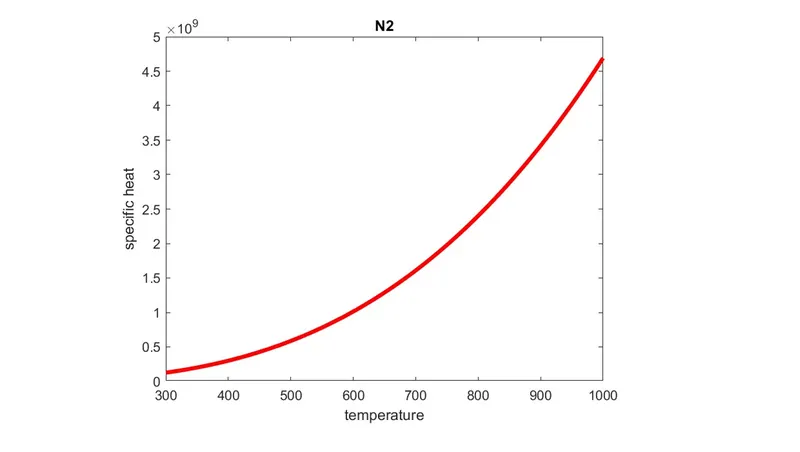
B. Plots for N2 (enthalpy,entropy and specific heat)
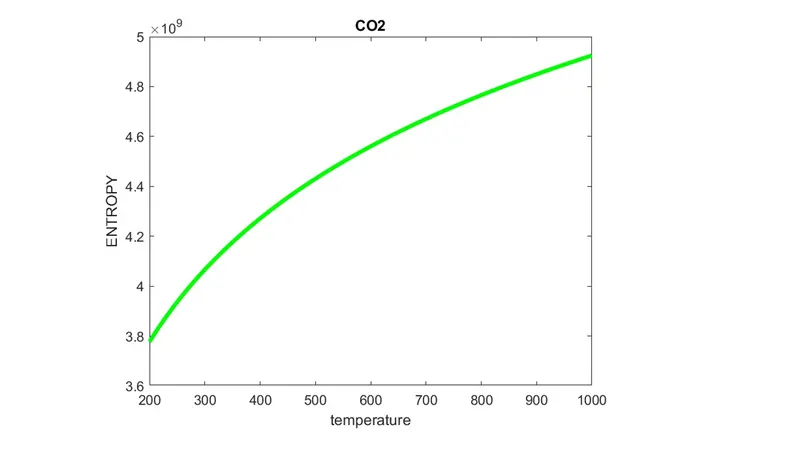
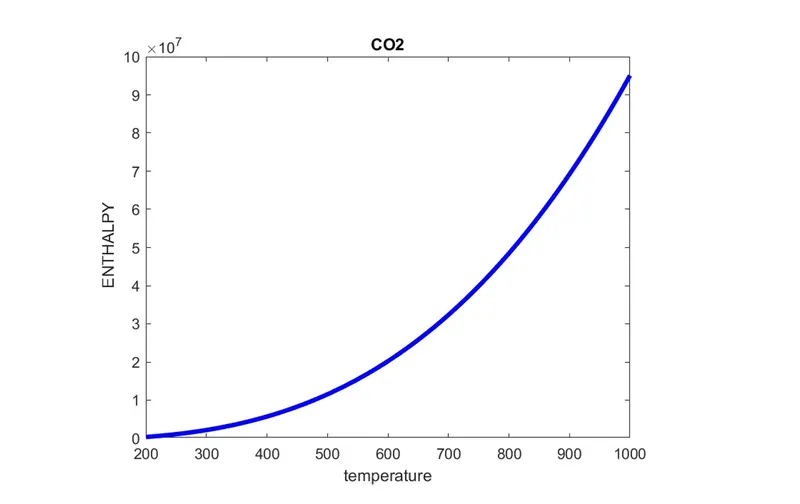
C. Plots for CO2 (entropy,enthalpy and specific heat)
Some ERRORS faced during execution of program
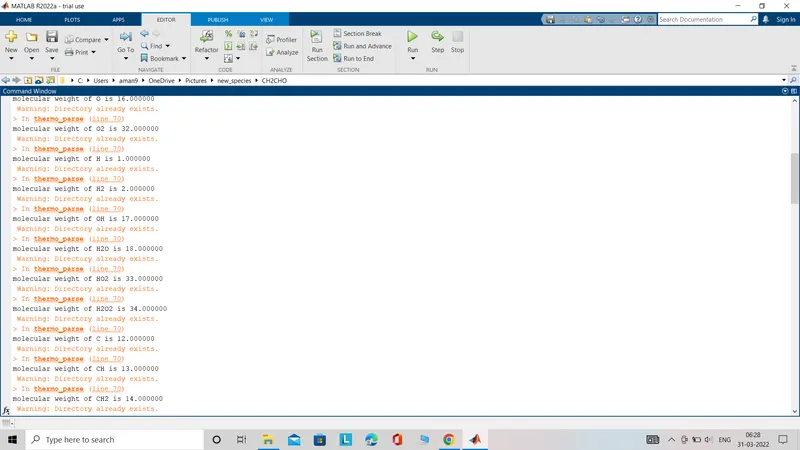
ERROR 1. Forgot to change the matlab current folder as shown below which is solved by clicking add to the path option
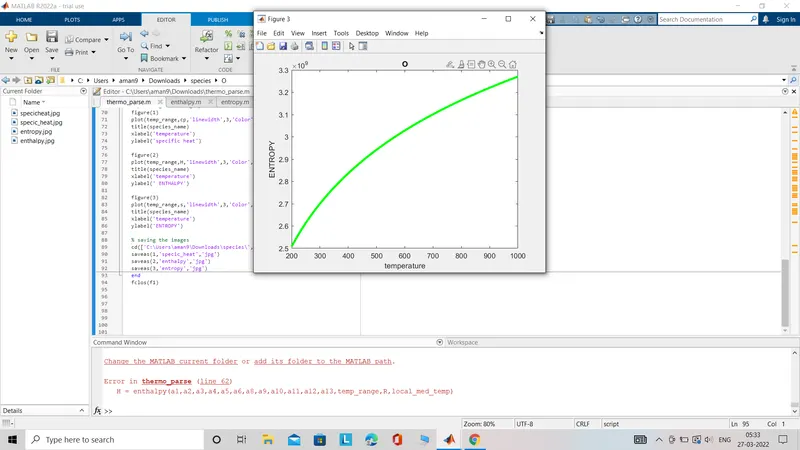
ERROR 2- 'WARNING directory exists already' is shown many times so I had changed the directory from 'new species' folder to 'latest species' folder.