Project 1 - Parsing NASA thermodynamic data
Aim:
Create a function extracts the 14 co-efficients and calculates the Enthalpy, Entropy and Specific Heats for all the species in the given NASA data file and also to calculate the molecular weight, plot Enthalpy, Entropy and Specific Heat.
Procedure:
Function that extracts the 14 co-efficients and calculates the nthalpy, Entropy and Specific Heats for all the species. Calculate the molecular weight of each species and display it in the command window. Plot the Cp, Enthalpy and Entropy for the local temperature range (low temperature : high temperature) specific for each species.. Save the plots as images with appropriate names and dump them in separate folders for each species with suitable name. All these should be generated automatically
To read the NASA data file in MATLAB using File Parsing.
File Parsing is the technique where one can read and write the data or program of given input, create values, generate program, calculate, analyse, plot,...
Main Coding:
To calculate the co-efficients of the given 53 species where each species has 14 co-efficients first 7 co-efficients are for high temperature co-efficients and next 7 co-efficients are for low tempearture co-efficients.
Where each species has different local temperature which contains low, mid, high temperature.
Formulas for Enthalpy, Entropy and Specific Heat given as follows,
Cp = (a1 + a2T + a3T^2 + a4T^3 + a5T^4)*R
H = (a1 + a2T/2 + a3T^2/3 + a4T^3/4 + a5T^4/5 + a6/T)*R*T
S = (a1 lnT + a2T + a3T^2/2 + a4T^3/3 + a5T^4/4 + a7)*R
Based on this formulas Entropy, Enthalpy & Specific Heat can be obtained for each species by providing the loop command.
And also molecular weight for all the species can be calculated.
Below is the Main program to generate the co-efficients, calculate Cp, H, S, calculate molecular weight & plot the graph for each species.
clear all
close all
clc

% reading the data file
f1 = fopen('THERMO.dat','r');
fgetl(f1);

% taking the 2nd line from data
tline = fgetl(f1);
A = strsplit(tline,' ');

% reading the global temperatures from data file
global_low_temp = str2num(A{2});
global_mid_temp = str2num(A{3});
global_high_temp = str2num(A{4});

% To reject next 3 rows

for i = 3:5;
    g = fgetl(f1);
end

% To read the Species name

for j = 1:53;
species = fgetl(f1);
T = strfind(species,'.');

% reading local temperature for each species
% reading local low temperatures for each species
species(52-3:52+3);
T_l = species(52-3:T(1)+3);
T_l1 = str2num(T_l);

% reading local high temperatures for each species
species(T(1)+6:62+3);
T_h = species(T(1)+6:T(2)+3);
T_h1 = str2num(T_h);

% reading local mid temperatures for each species
species(T(2)+6:72+3);
T_m = species(T(2)+6:T(3)+3);
T_m1 = str2num(T_m);

species_name = species(1:6)

% reading Coefficients 1
coeff_line_1 = fgetl(f1);
A1 = strfind(coeff_line_1,'E');
co_eff_line_1=(1:12+3);

%reading each co-efficient seperatly and converting it from array to
%numeric

b1 = coeff_line_1(1:A1(1)+3);
a1 = str2num(b1);
b2 = coeff_line_1(A1(1)+4:A1(2)+3);
a2 = str2num(b2);
b3 = coeff_line_1(A1(2)+4:A1(3)+3);
a3 = str2num(b3);
b4 = coeff_line_1(A1(3)+4:A1(4)+3);
a4 = str2num(b4);
b5 = coeff_line_1(A1(4)+4:A1(5)+3);
a5 = str2num(b5);

% reading Coefficients 2
coeff_line_2 = fgetl(f1);
A2 = strfind(coeff_line_2,'E');
co_eff_line_2=(1:12+3);

%reading each co-efficient seperatly and converting it from array to
%numeric
b6 = coeff_line_2(1:A2(1)+3);
a6 = str2num(b6);
b7 = coeff_line_1(A2(1)+4:A2(2)+3);
a7 = str2num(b7);
b8 = coeff_line_1(A2(2)+4:A2(3)+3);
a8 = str2num(b8);
b9 = coeff_line_1(A2(3)+4:A2(4)+3);
a9 = str2num(b9);
b10 = coeff_line_1(A2(4)+4:A2(5)+3);
a10 = str2num(b10);

% reading Coefficients 3
coeff_line_3 = fgetl(f1);
A3 = strfind(coeff_line_3,'E');
co_eff_line_3=(1:12+3);

%reading each co-efficient seperatly and converting it from array to
%numeric
b11 = coeff_line_2(1:A3(1)+3);
a11 = str2num(b11);
b12 = coeff_line_1(A3(1)+4:A3(2)+3);
a12 = str2num(b12);
b13 = coeff_line_1(A3(2)+4:A3(3)+3);
a13 = str2num(b13);
b14 = coeff_line_1(A3(3)+4:A3(4)+3);
a14 = str2num(b14);

T = linspace(T_l1,T_h1,100);
R = 8.314;

% calculating Entrophy(S), Enthalphy(H), Specific Heat(Cp)

for i = 1:length(T)
    if T(i)>T_m1
        Cp = (a1 + a2.*T + a3.*T.^2 + a4.*T.^3 + a5.*T.^4).*R;
        H = (a1 + (a2.*T)./2 + (a3.*T.^2)./3 + (a4.*T.^3)./4 + (a5.*T.^4)./5 + a6./T).*R.*T;
        S = (a1.*log(T) + a2.*T + (a3.*T.^2)./2 + (a4.*T.^3)./3 + (a5.*T.^4)./4 + a7).*R;
    else
        Cp = (a8 + a9.*T + a10.*T.^2 + a11.*T.^3 + a12.*T.^4).*R;
        H = (a8 + (a9.*T)./2 + (a10.*T.^2)./3 + (a11.*T.^3)./4 + (a12.*T.^4)./5 + a13./T).*R.*T;
        S = (a8.*log(T) + a9.*T + (a10.*T.^2)./2 + (a11.*T.^3)./3 + (a12.*T.^4)./4 + a14).*R;
    end
end

% calculating the molecular weight of the species

% molecular_weight_calculation = molecular_weight(species_name);
species = (species_name);
elements = ['H', 'C', 'O', 'N', 'A', 'S'];
atomic_weight = [1.00794 12.0107 15.999 14.0067 39.948 32];
molecular_weight = 0;
for i = 1:length(species)
    for j = 1:length(elements)
        if strcmp(species(i),elements(j))
            molecular_weight = molecular_weight + atomic_weight(j);
            a = j;
        end
    end
     b = str2num(species(i));
     if b>1;
        molecular_weight = molecular_weight + (b-1)*atomic_weight(a)
     end

end

mkdir('Species');
cd('Species');
mkdir(species_name);
cd(species_name);

% Plotting
figure(1)
plot(T,Cp,'Linewidth',3,'color','b');
xlabel('Temperature');
ylabel('Specific Heat');
title(species_name);

figure(2)
plot(T,S,'Linewidth',3,'color','r');
xlabel('Temperature');
ylabel('Entropy');
title(species_name);

figure(3)
plot(T,H,'Linewidth',3,'color','g');
xlabel('Temperature');
ylabel('Enthalpy');
title(species_name);

saveas(1,'Specific Heat.jpg')
saveas(2,'Entropy.jpg')
saveas(3,'Enthalpy.jpg')
% cd('G:\Skill-Lync\Matlab\Dinesh\File Parsing')
cd ..
cd ..
% molecular_weight = molecular_weight(species_name)

end
fclose(f1)
Once the code has been provided, click 'Run' button to get the Outputs.
Outputs:
Screesnshots of saved species files:
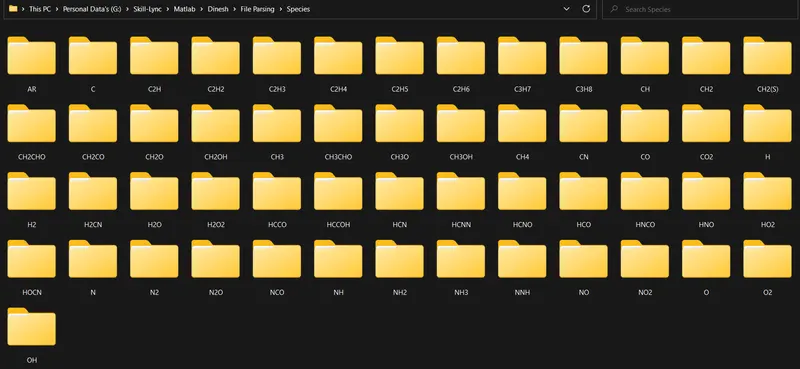
Plotting for CO2, O2, N2:
Plottings for CO2:
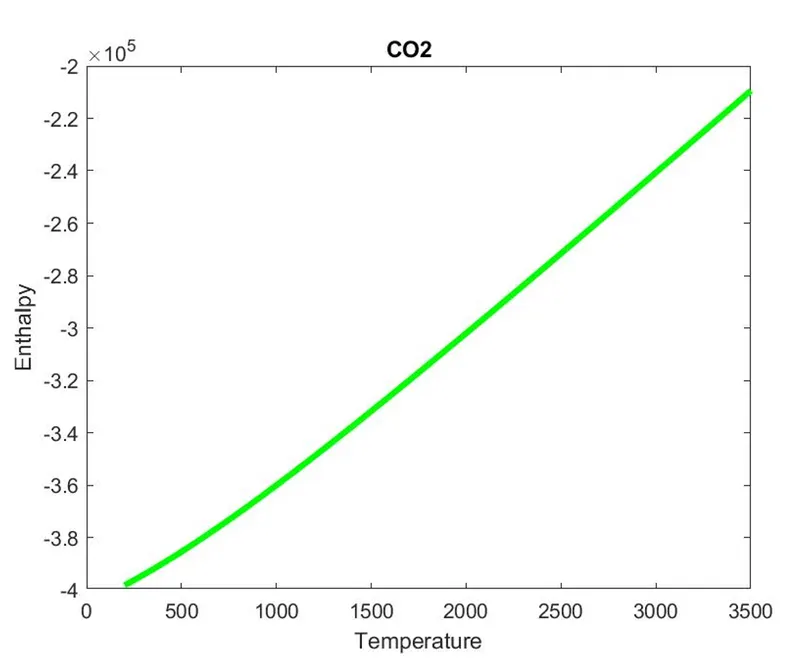
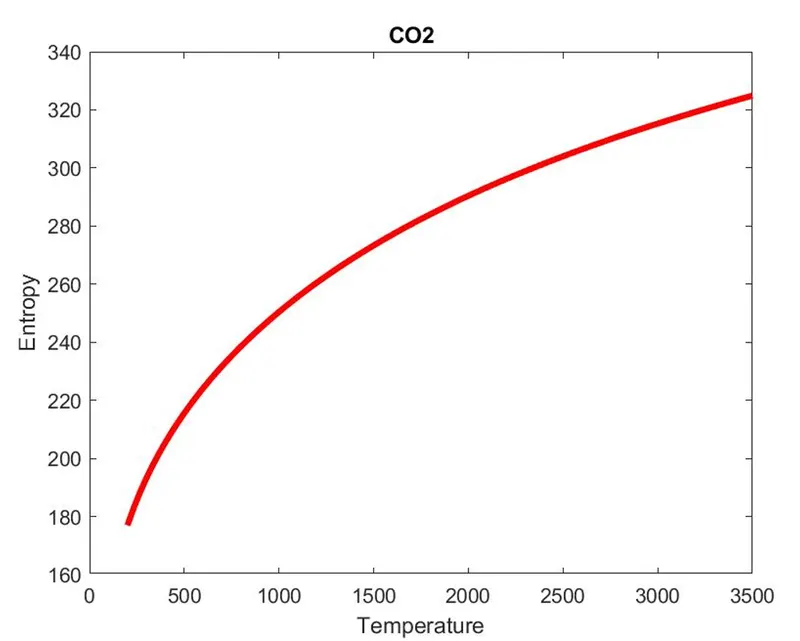
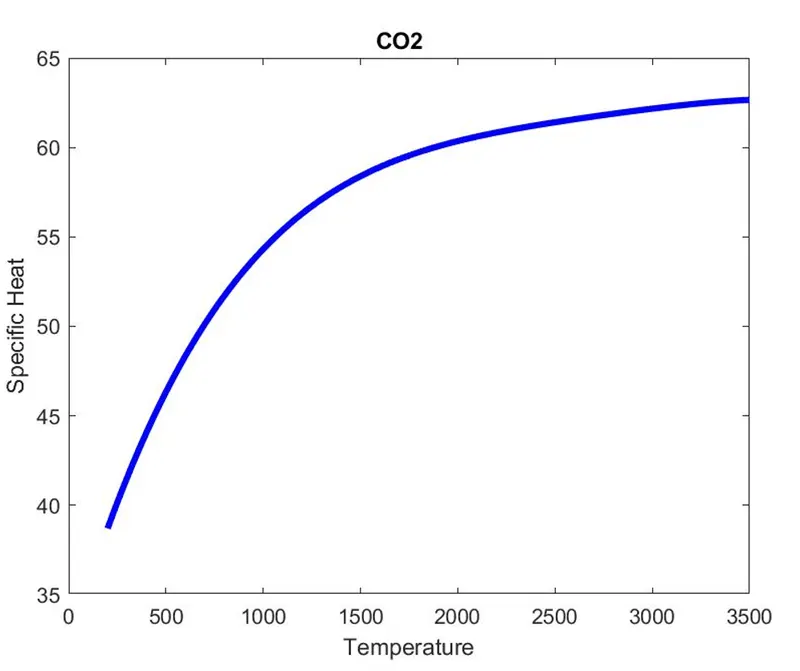
Plottings for O2:
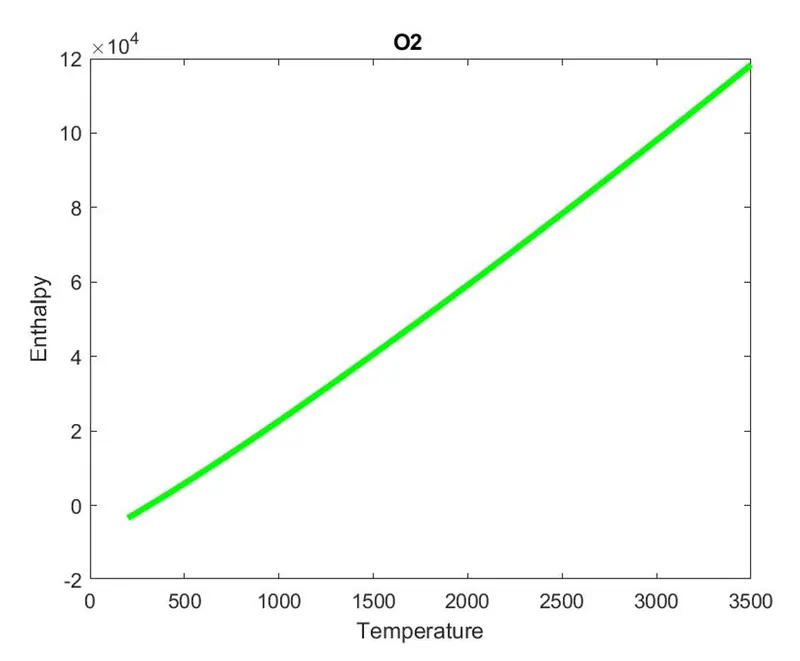
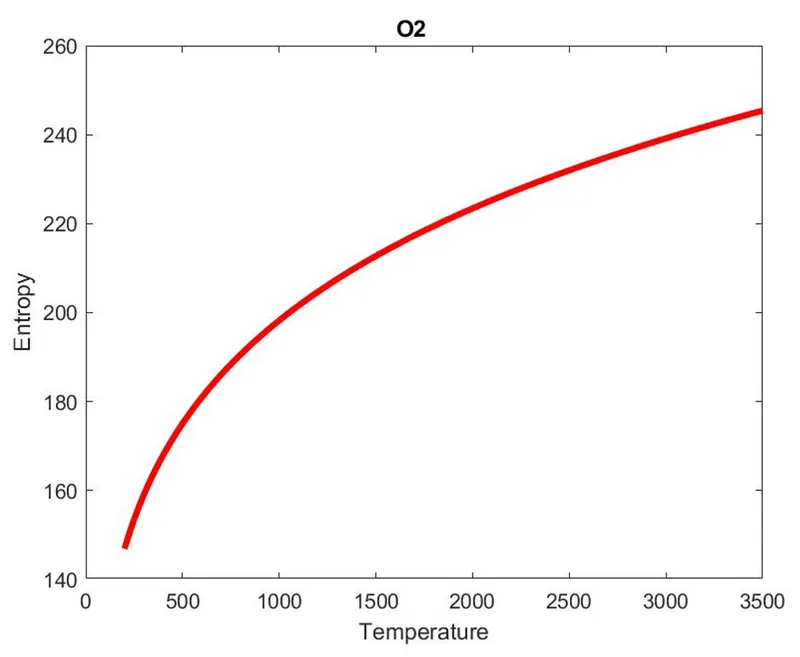
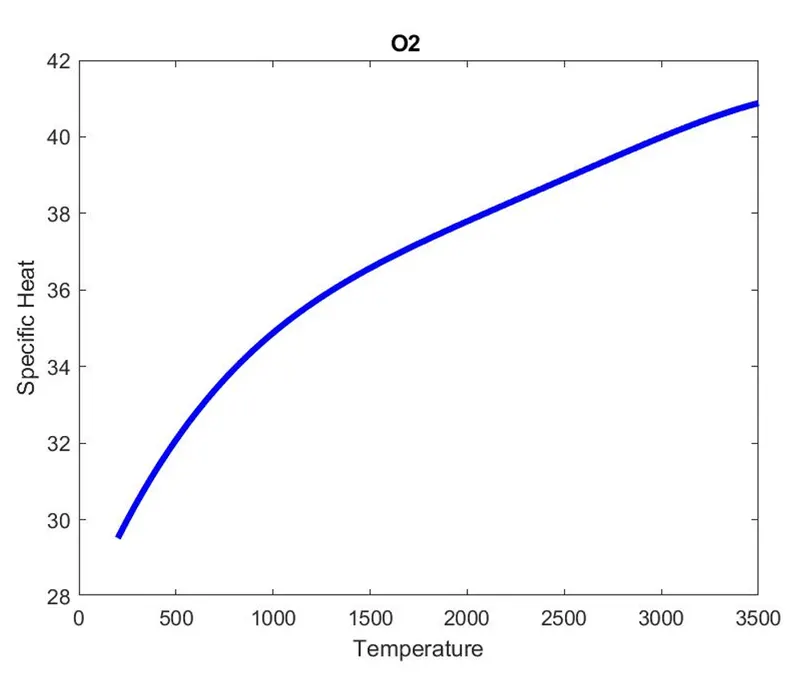
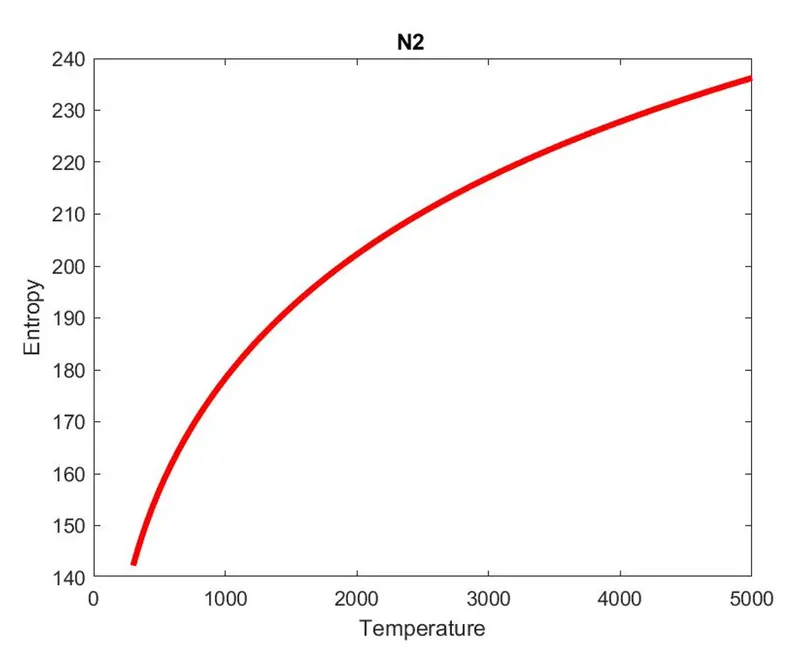
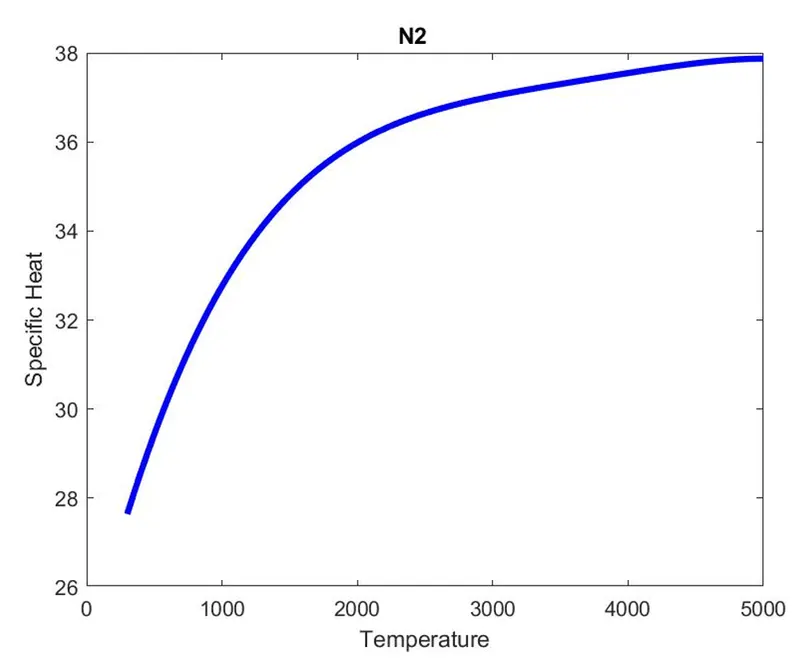
Plottings for N2:
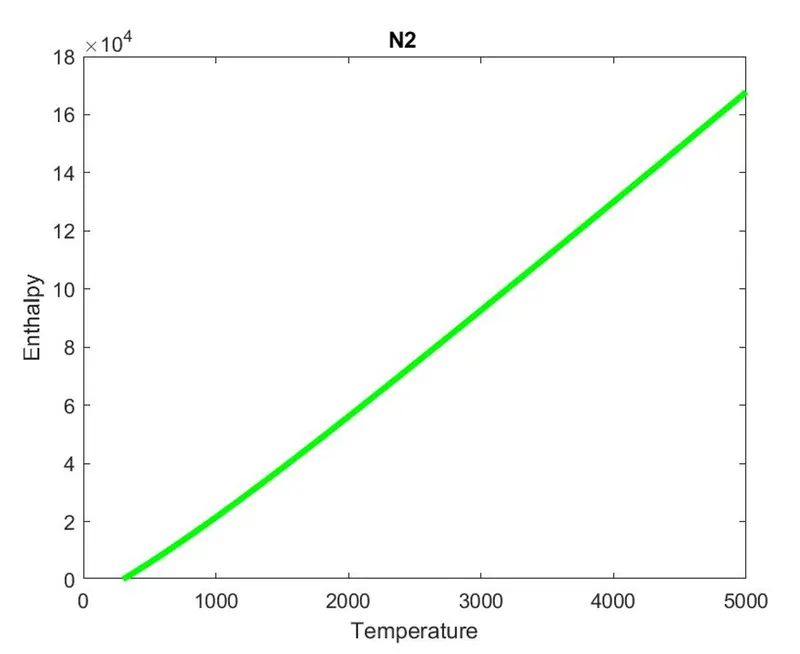
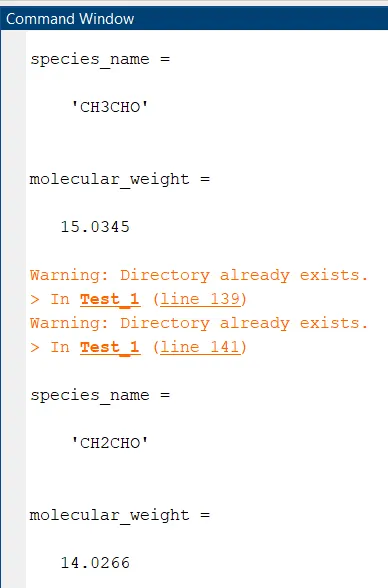
Molcular Weight:
Result:
The above procedure explains the file parsing coding technique using MATLAB Software and calculation of Enthalpy, Entropy and Specific Heat has been calculated for all the given species in NASA data file, plotted for each species and also calculated the molecular weight for each species which is shown in the output file.