Project 1 - Parsing NASA thermodynamic data
PARSING NASA THERMODYNAMIC DATA
AIM
To read and calculate the specific heat,enthalpy,entropy from all the species from the given NASA thermodynamic data file.
OBJECTIVES
1) To write a function that extracts the 14 co_efficients (a1-a14) and calculate the specific heat,enthalpy,entropy .
2) To plot the cp,enthalpy and entropy for the local temparature range of each species.
3) Saving the plots as images with corresponding species name and dumping them in separate folders for each species with suitable name.
INTRODUCTION
FILE PARSING
This challenge having a NASA thermodynamic data file,inorder to read the data file line by line and for calculating the required parameters , evaluation
of the polynomial,we are using some MATLAB commands to extract the data and evaluate,this process of parsing the data to obtain the objectives
is called as file parsing.
COMMANDS USED
fopen - this command is used to open the data file from the folder
fgetl - used to read the required data and also to skip the data
strsplit - string splitting, used to split the string in to number of words
str2num - string to number, used to convert the string in to numbers
strfind / findstr - used to find the letter or a number in the data
mkdir - used to create a folder
saveas - used to save the plots as images
NOTE* these are the new learned commands used here
CODE
clear all
close all
clc
% for getting the data file
f1=fopen('THERMO.dat','r');
fgetl(f1);
% reading the first line of the file
header_global_temp=fgetl(f1);
A=strsplit(header_global_temp,' ') ;       % splitting the string

%obtaining global max,medium and minimum temp:

global_min=strsplit(A{2});
global_mid=strsplit(A{3});
global_max=strsplit(A{4});

%ignoring the comments in the file
for i=1:3
    fgetl(f1);
end
% reading all line data
for i=1:53
    header=fgetl(f1);
    species_header=strsplit(header,' ');
    species_name=species_header{1};

%finding the string
    loc_temp=strsplit(header,' ');
    speciess_name=(loc_temp(1));
    loc_min_temp=str2double(loc_temp(end-3));
    loc_med_temp=str2double(loc_temp(end-2));
    loc_max_temp=str2double(loc_temp(end-1));

    %finding the coefficients a1 to a14
    tline1=fgetl(f1);
    tline2=fgetl(f1);
    tline3=fgetl(f1);


    a=strfind(tline1,'E');
    a1=tline1(1:a(1)+3);
    a1=str2double(a1);

    a2=tline1(a(1)+4:a(2)+3);
    a2=str2double(a2);

    a3=tline1(a(2)+4:a(3)+3);
    a3=str2double(a3);

    a4=tline1(a(3)+4:a(4)+3);
    a4=str2double(a4);


    a5=tline1(a(4)+4:a(5)+3);
    a5=str2double(a5);

 % finding strings and convert to numbers in line3
    a=strfind(tline2,'E');

    a6=tline2(1:a(1)+3);
    a6=str2double(a6);

    a7=tline2(a(1)+4:a(2)+3);
    a7=str2double(a7);

    a8=tline2(a(2)+4:a(3)+3);
    a8=str2double(a8);

    a9=tline2(a(3)+4:a(4)+3);
    a9=str2double(a9);

    a10=tline2(a(4)+4:a(5)+3);
    a10=str2double(a10);

    %finding strings and convert to numbers in line4

    a=strfind(tline3,'E');
    a11=tline3(1:a(1)+3);
    a11=str2double(a11);

    a12=tline3(a(1)+4:a(2)+3);
    a12=str2double(a12);

    a13=tline3(a(2)+4:a(3)+3);
    a13=str2double(a13);

    a14=tline3(a(3)+4:a(4)+3);
    a14=str2double(a14);

    % creating folder
    mkdir(['C:\Users\vaish\OneDrive\Desktop\NASA\images\',species_name]);


T=linspace(loc_min_temp,loc_max_temp,1000);
R=8.314;
%for getting the array of cp,h.and s
for k=1:length(T)
    % TO compare the temparature to assign the coefficients
    %a1-a7 is high temparature coefficients
    %a8-a14 is low temp coefficients
    if T(k)>loc_med_temp
        % high temparature coefficients
        cp=(a1+a2.*T+a3.*T.^2+a4.*T.^3+a5.*T.^4)*R;
        H=(a1+(a2.*T)/2+(a3.*T.^2)/3+(a4.*T.^3)/4+(a5.*T.^4)/5+(a6./T))*R.*T;
        S=a1.*log(T)+a2.*T+(a3.*T.^2)/2+(a4.*T.^3)/3+(a5.*T.^4)/4+a7;
    else
        %low temparature coefficients
        cp=(a8+a9.*T+a10.*T.^2+a11.*T.^3+a12.*T.^4)*R;
        H=(a8+(a9.*T)/2+(a10.*T.^2)/3+(a11.*T.^3)/4+(a12.*T.^4)/5+(a13./T))*R.*T;
        S=a8.*log(T)+a9.*T+(a10.*T.^2)/2+(a11.*T.^3)/3+(a12.*T.^4)/4+a14;

    end

end

 %for i=1:53
     %loc_temp=strsplit(tline1,' ');
    %species_name=(loc_temp(1));

 % plotting the curves
 %cp v/s T
 figure(1);
 plot(cp,T,'LineWidth',3,'Color','r');
 grid on
 title(species_name);
 xlabel('specific heat [j/k]');
 ylabel('temparature [k]');
 saveas(1,'cp_vs_temp.jpeg');

 % H v/s T
 figure(2);
 plot(H,T,'LineWidth',3,'Color','b');
 title(species_name);
 xlabel('Enthalpy [j]');
 ylabel('temparature [k]');


 % entropy v/s  temparature
 figure(3);
 plot(S,T,'LineWidth',3,'Color','g');
 title(species_name);
 xlabel('Entropy  [kj-1/mol]');
 ylabel('temparature [k]');


% changing the directory and saving the file
saving=(['C:\Users\vaish\OneDrive\Desktop\NASA\images\',species_name]);
cd(saving)
saveas(1,'cp_vs_temp.jpeg');
saveas(2,'enthalpy_vs_temp.jpeg');
saveas(3,'entropy_vs_temp.jpeg');
end
CODE EXPLANATION
- Opening and reading the given data from the folder using fopen command
- fgetl is used to read the file and skip the file
- the global temparature data can be stored in after header
- strsplit command is used to get the string splited
- giving max,med and minimum ranges to the tempatarure by finding it in data
- the next 3 lines in the data file are skipped by using fgetl command
- inorder to obtain the first objective of finding the co-efficients(a1 - a14)
- a loop is created for 1:53 ,because we are having 53 species in the data
- obtain the header by extracting the first line
- the global temparature ranges are extracted by using str2double command
- the next 3 lines in the data of corresponding species are selected by tline1,tline2,tline3
- all species names and temparature ranges are available in the header line .
- strfind E is used to find the exponents E lies in all given data lines .
- the coefficient values are obtained by using (tline1 to tline3 ) str2double or str2num command.
- the process is repeated for all 14 coefficients
- linspace command is used to obtain an array of local_min_temp to the local maximum temp
- the corresponding equations to find cp,H and S is put inside a loop along with if else statement according to the temparature greater or lessthan local medium temparature.
- the high temparature and low temparature coefficients are obtained,thus the cp,H and S can be finded easily.
- ploting the cp v/s temparature, H v/s temp and S v/s temp using plot command
- the corresponding x and y labels,titles and figure number is given in each case
- this will take part inside the previous loop and thus the curve will ploted for each 53 species
- saveas command is used to save the curve as images .
- folder is created using mkdir command
- and thus the 3 plot for each 53 species are obtained and saved in the corresponding species folder.
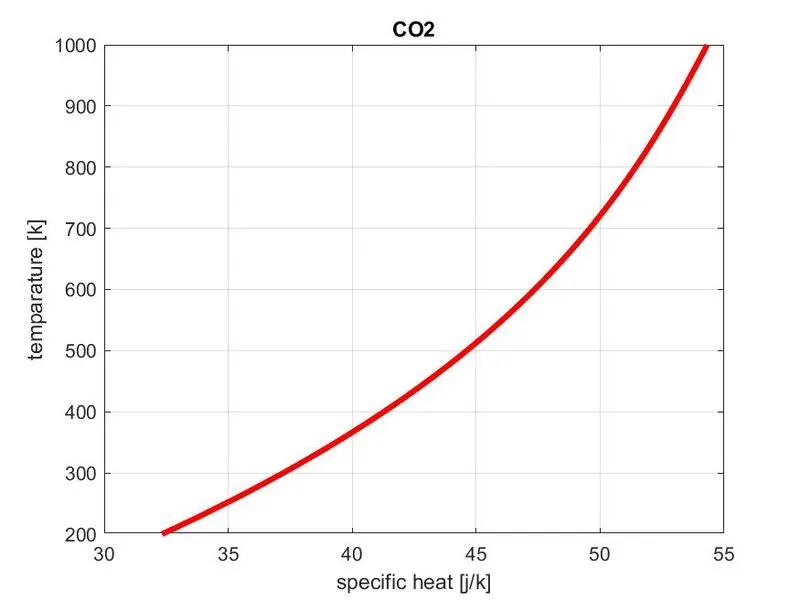
PLOTS FOR O2 N2 CO2 SPECIES
O2
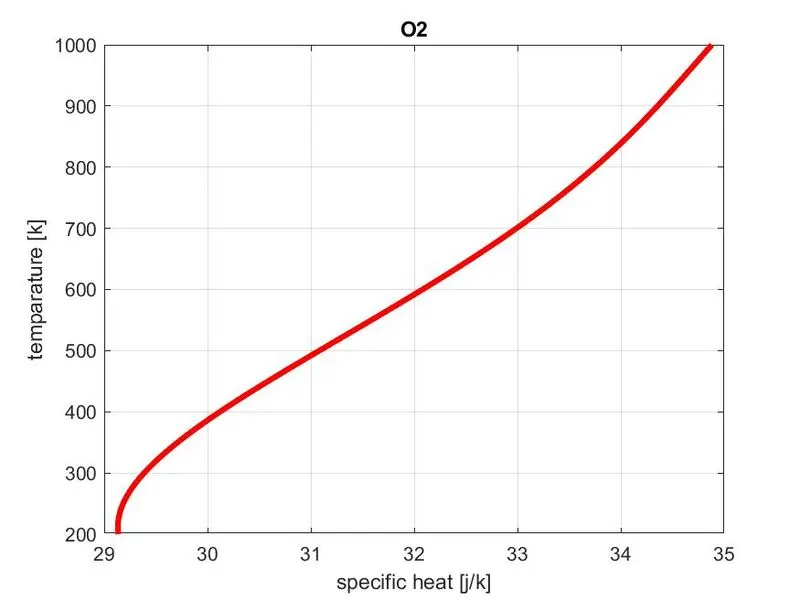
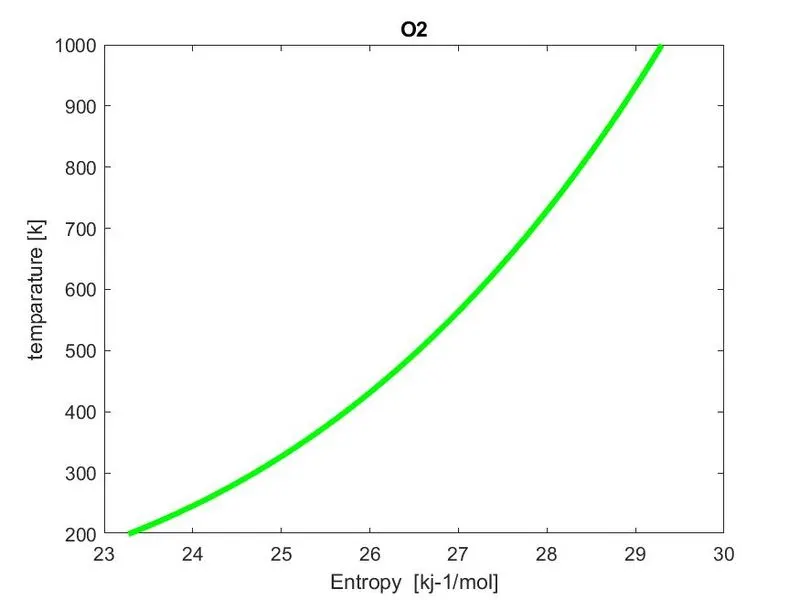
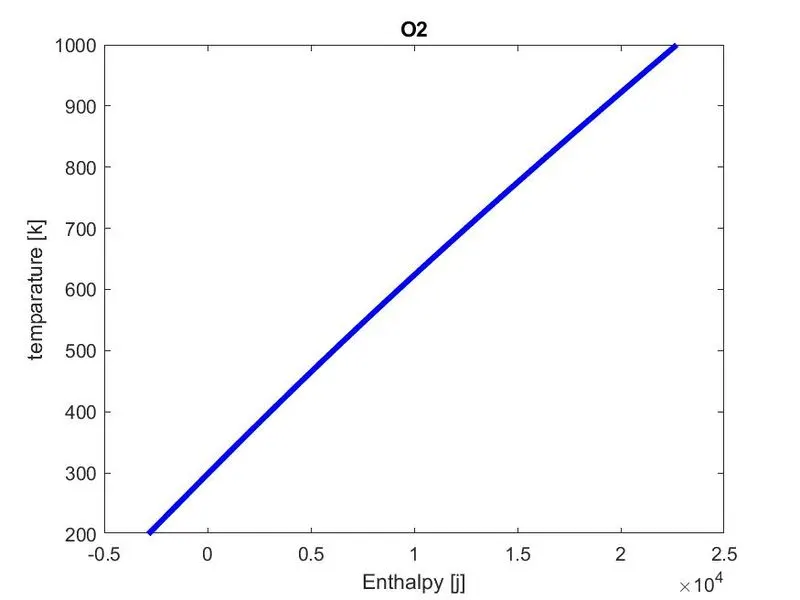
PLOTS FOR CO2
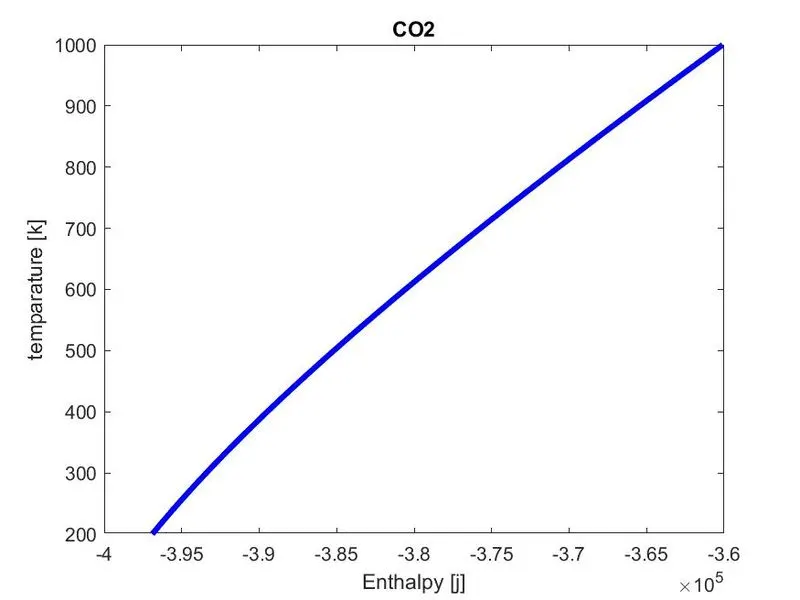
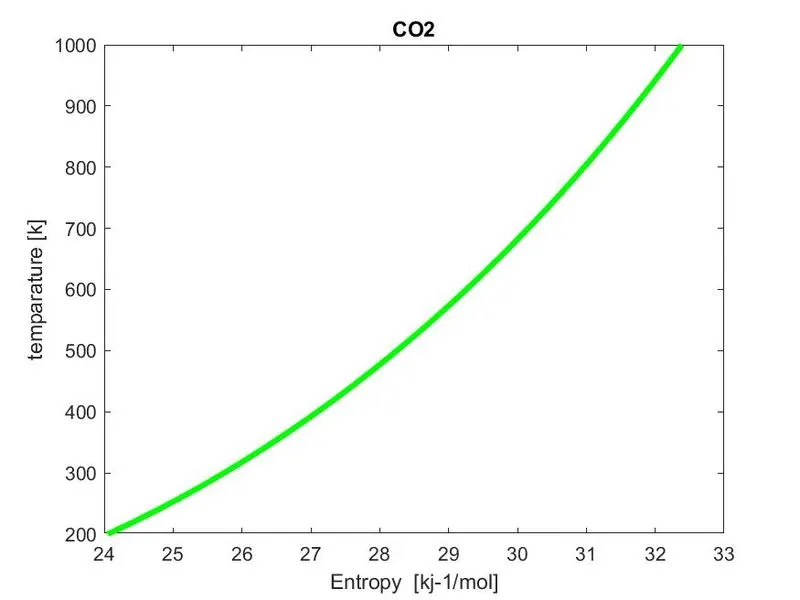
FOR N2
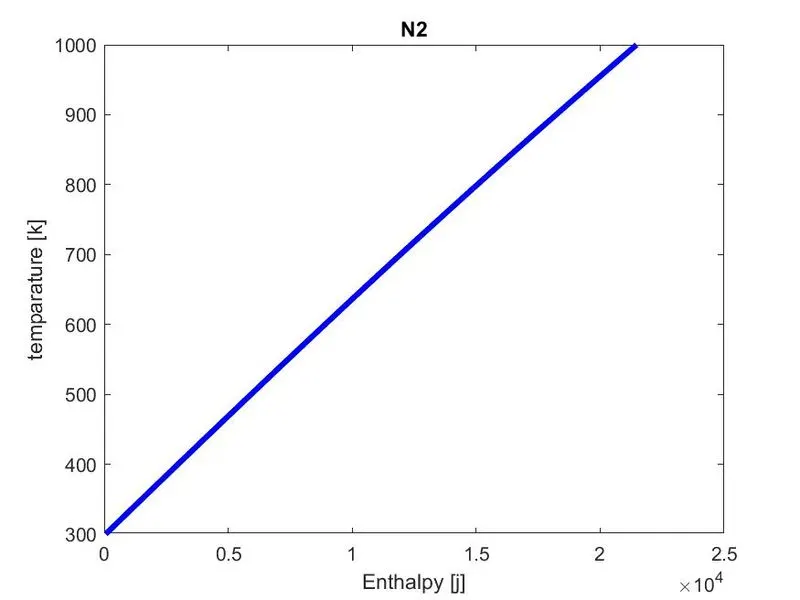
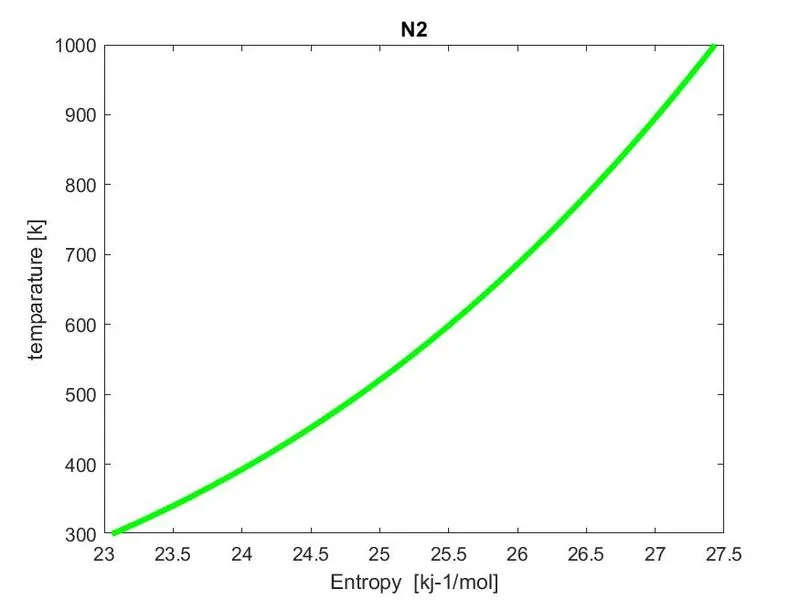
SCREENSHOT OF THE SAVED FOLDER FOR EACH SPECIES

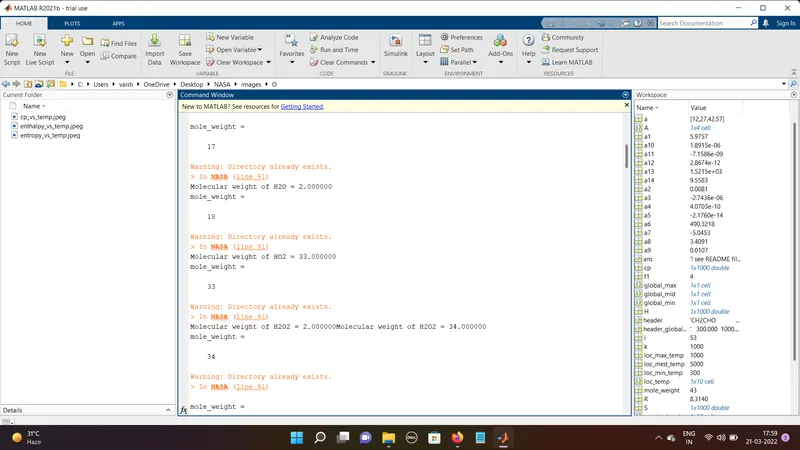
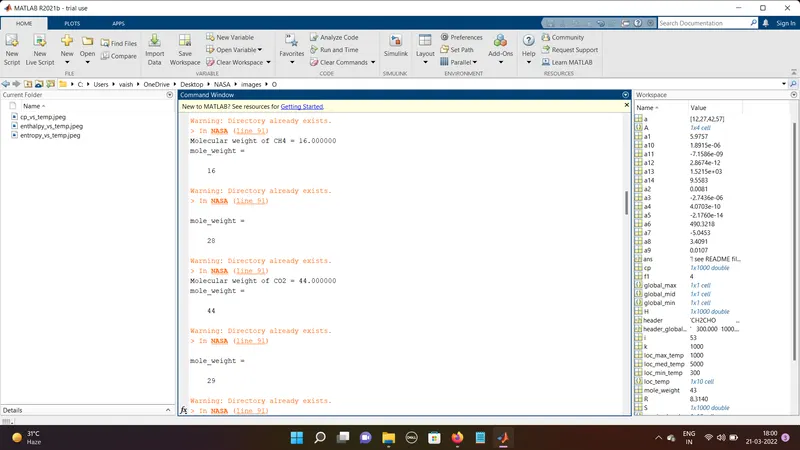
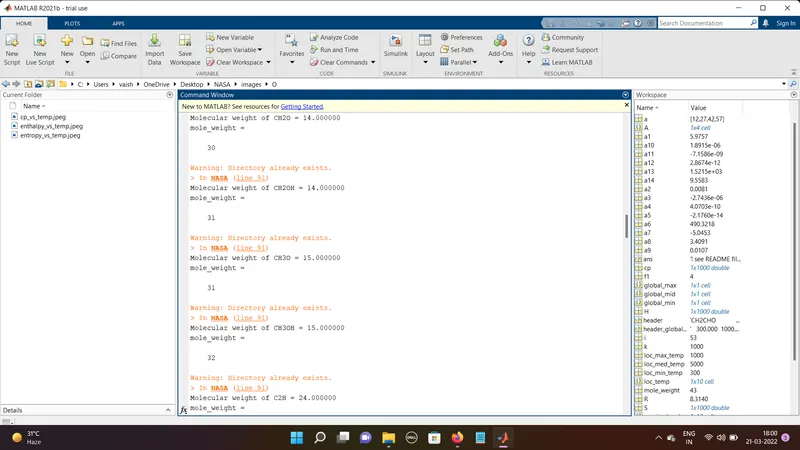
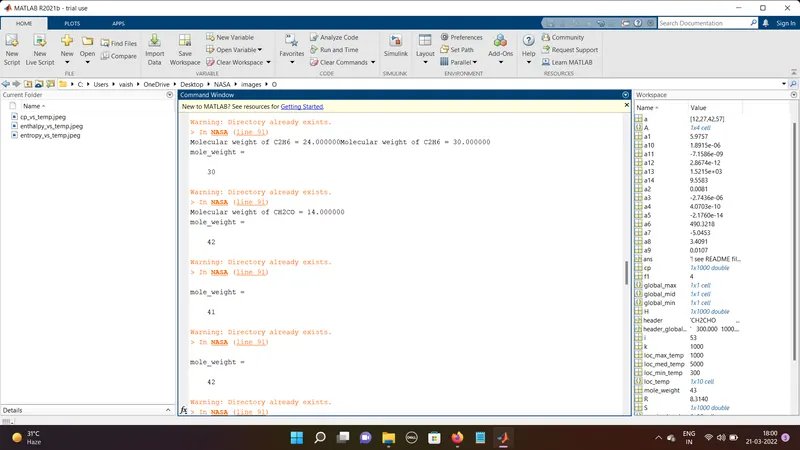
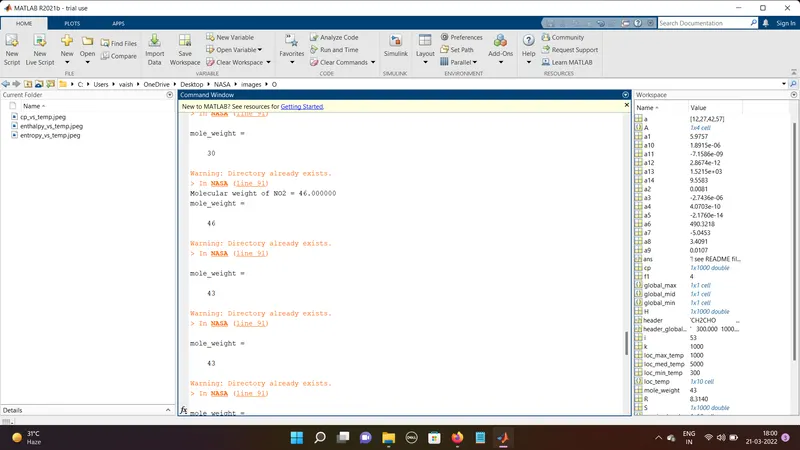
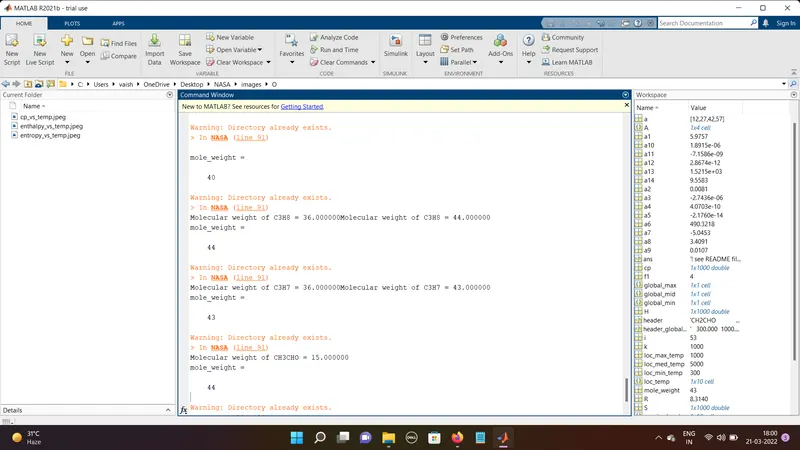
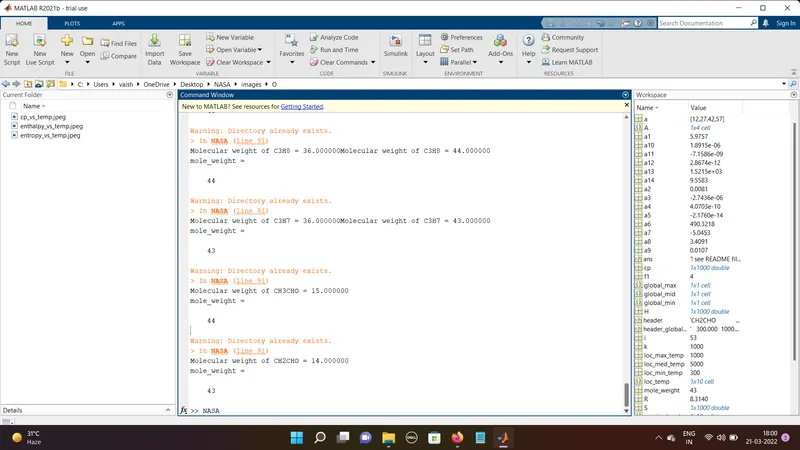
OBJECTIVE : calculate the molecular weight of each species and display it in the command window.
CODE
function[w]=mol_weight(species_name)
atomic_names=['H','C','O','N','A'];
atomic_weights=[1,12,16,14,40];
w=0;
for i=1:length(species_name)
    for j=1:length(atomic_names)

    if strcmpi(species_name(i),atomic_names(j))
        w=w+atomic_weights(j);
        pos=j;
    end
    n=str2num(species_name(i));
    end
    if n>=1
        w=w+atomic_weights(pos)*(n-1);
        k=fprintf('Molecular weight of %s = %f',species_name,w);
    end
end
- A function is created to calculate the molecular weight of each species
- then calling the function in the main code to obtain the need for all those species.
- calculate the molecular weight of each species and displayed it in the command window.
NOTE* CODE for calling the function of molecular weight
mole_weight=mol_weight(species_name)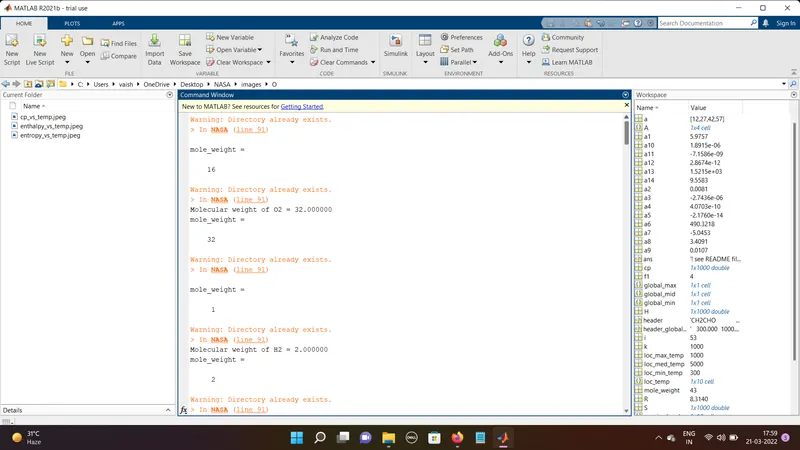
CONCLUSION
The required data is read using MATLAB by extracting the given NASA thermodynamic data file and programmed to plot the
enthalpy,entropy,specific heat for all 53 species.
the molecular weight is also calculated for all species.