Project-2: MODELLING OF AN ELECTRIC CAR WITH A Li-Ion BATTERY
- Project 2: Modelling of an Electric Car with a Li-Ion Battery
I. OBJECTIVES
- To Create a MATLAB model of an electric car that uses a lithium-ion battery and a suitable motor as per the details below:
- Suitable blocks to be chosen from the Simscape or the Powertrain block set.
- Implement the vehicle speed control using a PI controller and generate brake and accelerator commands.
- Avoid using a ready-made driver block for speed control.
II. BRIEF INTRODUCTION
- About Formula-E
Formula E is the world's first all-electric international single-seater championship. Officially known as the ABB FIA Formula E World Championship, its mission is to promote sustainable mobility and to drive electric vehicles to the fore in the race to a better, cleaner future. Since making its debut on the grounds of the Olympic Park in Beijing in 2014, Formula E has grown into a global entertainment brand, attracting a grid full of the best racing drivers and teams around.
The proposal for a city-based, single-seater electric car motor racing championship was conceived by Jean Todt, the president of the world governing body of motorsport, the Fédération Internationale de l'Automobile (FIA), and presented to politicians Alejandro Agag and Antonio Tajani at a dinner at a small Italian restaurant in the French capital Paris on 3 March 2011. Tajani concentrated on the electrification of the automobile industry, reducing carbon-dioxide emissions, and introducing hybrid and electric systems. Agag supported Todt's proposal after the latter discussed the FIA opening up a tender to organize the series. Agag told Todt that he would take on the task because of his prior experience in negotiating contracts with television stations, sponsorship, and marketing.
Since the 2020–21 season, Formula E is an FIA World Championship, making it the first single-seater racing series outside of Formula One to be given world championship status.
1. Cars
The cars are the biggest difference between Formula E and any other motorsport. The most important thing you need to know is that all of the cars are electric. They are powered by a 250kW battery. Despite being battery-powered, the vehicles can reach speeds of up to 174mph (280km/h).
As well as being cleaner, these electric vehicles are much quieter than their petrol-powered counterparts in other racing series. The noise of the cars racing at full speed reaches just 80 decibels, unlike Formula One cars, which can reach over 100 decibels.
2. Teams
11 teams compete in the Formula E Championship. Some of these are manufacturer teams, such as Panasonic Jaguar Racing and Nissan e.dams. Others are known as customer teams because they have purchased a car model from another manufacturer to race. Each team has two drivers so 22 drivers line up on the grid at the beginning of each race.
3. Qualifying and Super Pole
Drivers compete in qualifying sessions to decide which order they line up on the grid at the beginning of each race, with the fastest driver in the front in pole position and the slowest at the back of the pack in 22nd. Qualifying lasts for one hour and drivers are divided into four groups of up to six cars, defined by their positions in the championship.
Once out on the track, drivers have six minutes to set their fastest lap time, with the top six drivers going into the Super Pole shoot-out to secure pole position and an additional three points. During the Super Pole shoot-out, drivers go out one at a time to complete the fastest lap. The driver with the fastest lap from Super Pole lines up in pole position on the grid.
4. Races
Formula E doesn’t follow the racing rules you might expect when it comes to the main event. Unlike other car races, where drivers compete over a set number of laps, an E-Prix has a completely different format:
-
All drivers race for 45 minutes and then complete one additional lap
-
All drivers must complete the same number of laps as the driver who is in the lead at the end of the 45 minutes
-
The winner is the driver to cross the finish line first in the lap after the 45 minutes of racing is completed
The challenge in Formula E isn’t only to make your car go fastest. In addition to speed, teams must develop tactics to manage power in the best way possible. Superior battery management ensures the cars won't run out of energy – an essential factor when it comes to giving drivers the best chance of winning a race.
5. Points
Like most other motorsports, championships are decided based on points built up throughout the season. At each race, trophies are awarded to the top three drivers, and points are given to the top 10, based on the standard FIA scoring system (25 points for first place, 18 for second, 15 for third, 12 for fourth, 10 for fifth, eight for sixth, six for seventh, four for eighth, two for ninth and one for 10th). Points are then totaled for individual drivers, and also for teams, to decide the individual winner as well as the winning team across the whole championship.
6. Boosts
To keep the race interesting to watch, and to engage fans, Formula E has introduced some ways that drivers can receive an extra power boost during the race.
The first is FanBoost, which sees Formula E fans voting for their favorite drivers during the week leading up to the race. The three drivers with the most votes receive additional power that they can choose to use at any point in the race – whether to overtake, catch up to a driver ahead, or maintain a winning lead. Votes can be cast online at fiaformulae.com/fanboost, on Twitter, or via the official Formula E app. The other power boost is one that all drivers can access: Attack Mode. To activate Attack Mode, drivers must drive through the Attack activation zone, which could cause them to have to slow down. However, they will be rewarded with a short boost of power, which will allow them to attack once again and hopefully gain back any places lost. All drivers must use Attack Mode during the race – but the number of times they have to use it and how long the power boost lasts varies from track to track and teams are only informed an hour before the race so they can’t plan their tactics too far in advance.
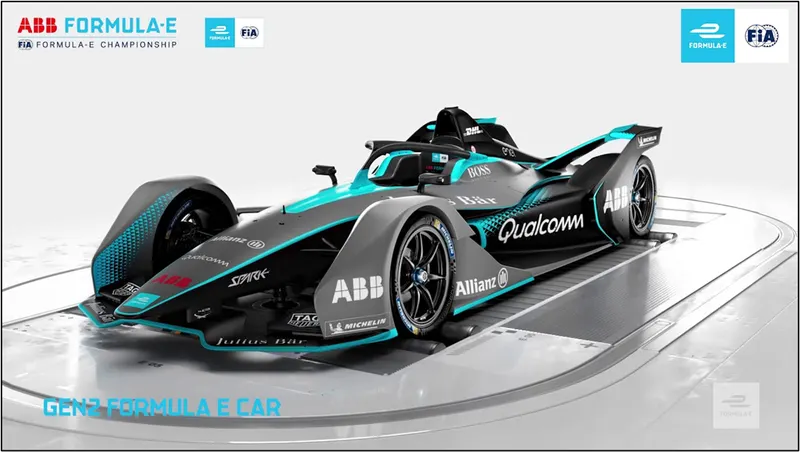
Fig.1. A typical Gen2 Formula-E Car -
-
About Electric Vehicle Powertrain
-
The powertrain of a Battery Electric Vehicle (BEV) consists of an electric drive system with a battery serving as an energy buffer. Often there is only one electric machine (DC Motor), connected to the wheel shaft via a gearbox and a differential. However, some applications may utilize several electric machines, e.g., hub wheel motors. The energy is stored chemically in a battery, which is electrically connected to the machine via a DC/AC power electronic converter accompanied by a control system. The control system controls the frequency and magnitude of the three-phase voltage applied to the electric machine, which depends on the driver’s present request, which is communicated via the acceleration and/or brake pedal.
- In the case of vehicle applications, it is usually desirable to keep the physical volume of the electric machine down. This can be done by designing it for higher speed levels. A reasonable compromise is a maximum speed between 12 000 to 16 000 rpm since it serves as a good compromise between volume and performance. Still, during normal on-road driving the speed range of a vehicle may vary between zero to about 130 km/h or even higher at times. This means that the wheels will spin up to around 1200 rpm or higher. Therefore, a reduction gear ratio toward the wheels is inherently needed. Additionally, to give the left and right traction wheels a chance to spin at slightly different speeds during turning, there is also a need for a differential to be connected between the wheels. Sometimes the differential also includes a final gear ratio. A typical BEV drive system is depicted in Figure 2.
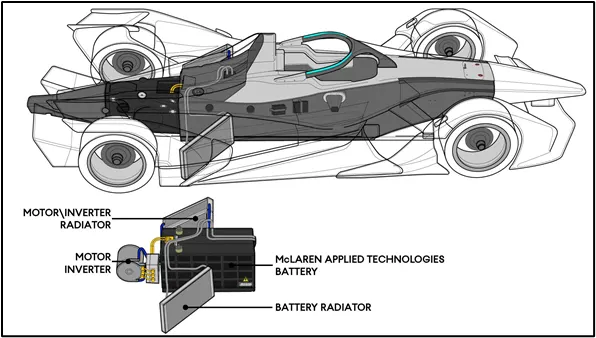
Fig.2. Typical Formula-E Car Powertrain
-
III. CASE STUDY
- Simulink Model - E Rickshaw (Electric 3-Wheeler Vehicle) Model
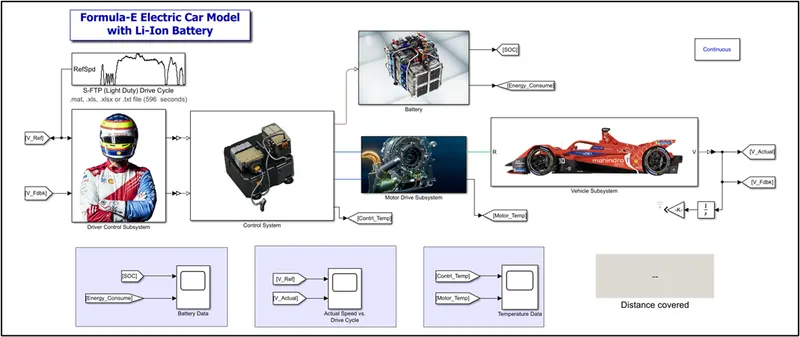
Fig.3. Simulink Model for our EV
- Model Parameters:-
For this project, we have considered the vehicle model parameters of the Mahindra Racing M7Electro.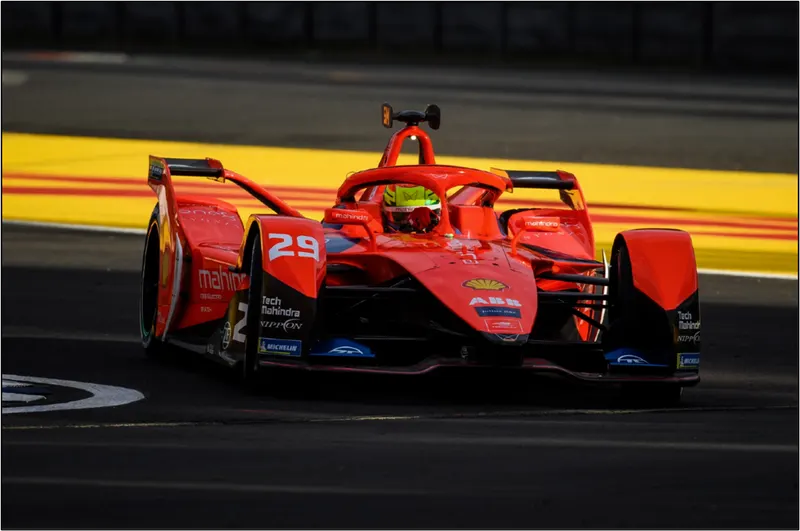
Fig.4. Image of the M7Electro
- Vehicle Specifications:
Gen 2 Formula E car
Property
Value
Acceleration
2.8 s from 0–100 km/h (approximately)
Top speed
280 km/h (FIA regulated)
Chassis material
Carbon fiber and aluminium monocoque
Body material
carbon fiber
Aerodynamic elements
Spoiler and air dam
Engine
Various
Engine power
200 kW in normal race mode (225 kW in attack mode, 250 kW in fan boost mode)
Energy source
54 kWh battery by McLaren Applied Technologies
Powertrain layout
Rear-wheel drive, center back engine position (mid-mounted)
Gearbox
Various single-speed gearboxes
Suspension
Double steel wishbones
Shock absorbers
Torsion bars and springs
Brakes
Front: 278 mm Brembo carbon disks and calipers
Rear: 263 mm Brembo carbon disks and calipers with brake-by-wireRims
460 mm (18 in) diameter rims
Tires
650 mm diameter front, 260 mm wide
690 mm diameter back, 305 mm wide
Michelin Pilot Sport All-Weather Treaded, one set per weekendLength
5160 mm
Width
1770 mm
Height
1050 mm
Track
1553 mm front,
1505 mm rearWheelbase
3100 mm
Mass
900 kg total mass (included driver)
385 kg battery mass
`"Coefficient of Rolling Resistance," μ_( r r)` `=` `"0.01"` `"Frontal Area"` `=` `"1.8585" m^2` `"Coefficient of Drag," C_(D)` `=` `"0.65"`
- Vehicle Performance Calculations:
We use our excel calculator for the propulsion power requirement calculations.
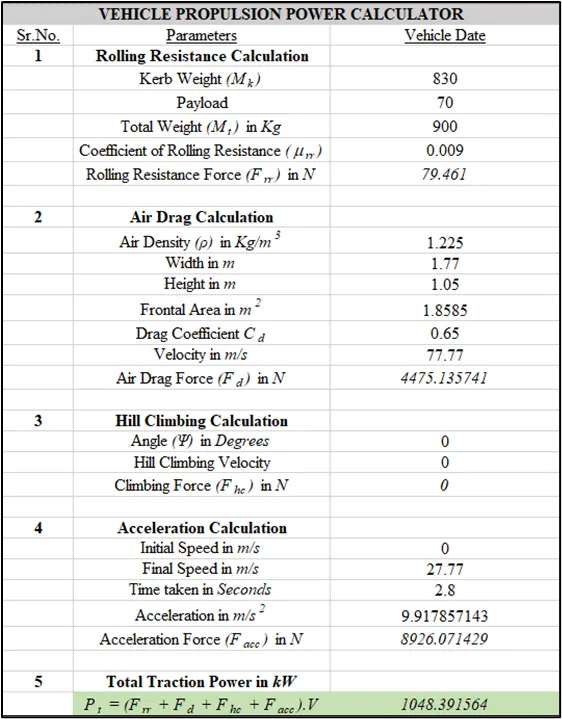
Fig.5. Excel Calculator
From the above calculations, it is clear that the maximum propulsion power required at the wheels is 1048.39 kW. If we calculate the Torque value based on this, we will get 4650.83 Nm at the wheel (assuming a tire radius of 0.1524 m). Hence, we consider a higher value to overcome traction issues during operation and consider a value of 45 kW.
- Gear Ratio assumption:
For the above calculations, it is clear that the torque is required at the wheels. Since we know that the power will travel through a single gear, and we know the required output torque, then by assuming that the gear ratio is 4.2, the input torque from the motor can be estimated.
- DC Motor Calculations:
Since we know that the transmission in a Formula-E car is very efficient and precisely engineered, an assumption of maximum transmission efficiency of 98% is made and we can calculate the highest input torque from the motor shaft;
`"Input Torque from Motor" = "Output Shaft Torque"/("Gear Ratio"xx"Transmission Efficiency") = 4650.83/(4.2xx0.98)`
`:. "Input Torque from motor" = 1129.5Nm`
Hence, the motor is more than capable of handling these torque conditions.
Based on this we can calculate the full load speed;
`"Motor Speed " = ("Power"xx60) / (2pixx "Torque") = (280,000 xx60)/(2pixx1129.5) = 2367 RPM`
- System-Level Configurations:-
[A] Drive Cycle Source:
The Drive Cycle Source block generates a standard or user-specified longitudinal drive cycle. The block output is the specified vehicle longitudinal speed, which you can use to:
A formula e racing car is engineered to go around a circuit of fixed distance and a number of cuts and corners. Since getting a drive cycle for a particular race track or circuit is not possible, we have chosen another drive cycle data with a maximum speed of 36 m/s.-
Predict the engine torque and fuel consumption that a vehicle requires to achieve desired speed and acceleration for a given gear shift reference.
-
Produce realistic velocity and shift references for closed-loop acceleration and braking commands for vehicle control and plant models.
-
Study, tune, and optimize vehicle control, system performance, and system robustness over multiple drive cycles.
For our study, we have chosen two drive cycles as follows;
- Supplemental Federal Test Procedure (FTP) Driving Schedule (Light-Duty) (596 seconds)
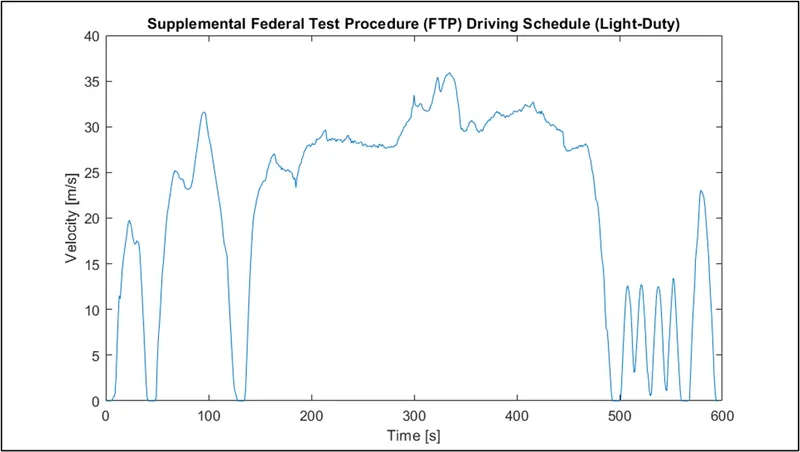
Fig.6. S-FTP Drive cycle
[B] Driver Control Subsystem:
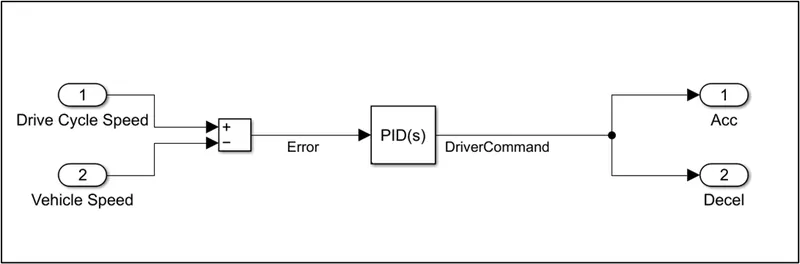
Fig.7. Driver Control Subsystem
In this subsystem, we compare the drive cycle input signal and the actual vehicle output signal using a sum block. This generates an error signal which is then fed to a PID controller for controlling the output to the control system.
The Discrete PID Controller block implements a PID controller (PID, PI, PD, P only, or I only). The block is identical to the PID Controller block with the Time domain parameter set toDiscrete-time.The block output is a weighted sum of the input signal, the integral of the input signal, and the derivative of the input signal. The weights are the proportional, integral, and derivative gain parameters. A first-order pole filters the derivative action.
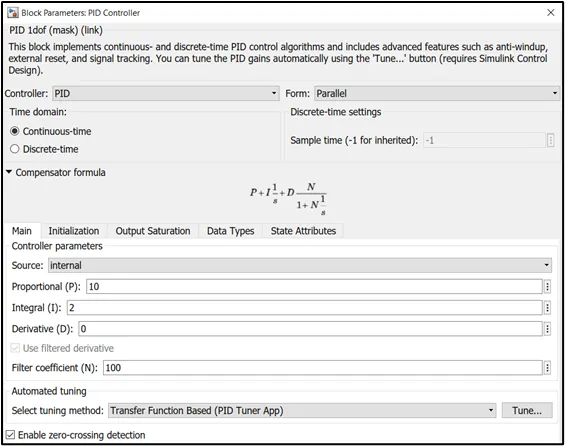
Fig.8. PID Block Configuration P— Proportional gain
Proportional gain is provided from a source external to the block. External gain input is useful, for example, when you want to map a different PID parameterization to the PID gains of the block. You can also use external gain input to implement gain-scheduled PID control. In gain-scheduled control, you determine the PID coefficients by logic or other calculation in your model and feed them to the block.I— Integral gain
Integral gain is provided from a source external to the block. External gain input is useful, for example, when you want to map a different PID parameterization to the PID gains of the block. You can also use external gain input to implement gain-scheduled PID control. In gain-scheduled control, you determine the PID coefficients by logic or other calculation in your model and feed them to the block.D— Derivative gain
Derivative gain is provided from a source external to the block. External gain input is useful, for example, when you want to map a different PID parameterization to the PID gains of the block. You can also use external gain input to implement gain-scheduled PID control. In gain-scheduled control, you determine the PID coefficients by logic or other calculation in your model and feed them to the block.
[C] Control Subsystem: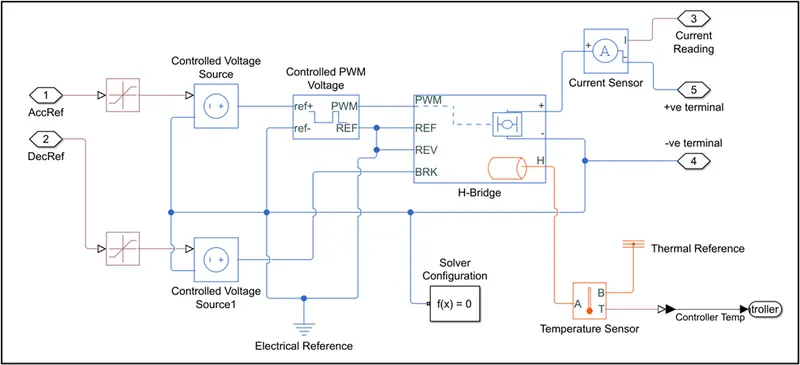
Fig.9. Control Subsystem
- Saturation Block
The PS Saturation block imposes upper and lower bounds on a physical signal. When the input signal is within the range specified by the Lower limit and Upper limit parameters, the input signal passes through unchanged. When the input signal is outside these bounds, the signal is clipped to the upper or lower bound.When the Lower limit and Upper limit parameters are set to the same value, the block outputs that value. The upper and lower bounds for the acceleration signal are 1 and 0 respectively. For the deceleration signal, they are 0 and -1 respectively.
Both the input and the output are physical signals. Untyped physical ports facilitate unit propagation. The output signal has the same physical unit as the input signal.
- Controlled Voltage Source Blocks
The Controlled Voltage Source block converts a Simulink input signal into an equivalent voltage source. The generated voltage is driven by the input signal of the block. We use two of these blocks to provide output signals as directed by the output from the Longitudinal Driver block for Acceleration and Deceleration commands respectively.
- Controlled PWM Voltage Block
The Controlled PWM Voltage block represents a pulse-width modulated (PWM) voltage source.
Electrical input ports — The block calculates the duty cycle based on the reference voltage across its ref+ and ref- ports. This modeling variant is the default.
PS input — Specify the duty cycle value directly by using an input physical signal port.For the Electrical input ports variant of the block, the demanded duty cycle is
`(V_(ref) - V_(min))/(V_(max) - V_(min)) *100 %`
where:
-
Vref is the reference voltage across the ref+ and ref- ports.
-
Vmin is the minimum reference voltage.
-
Vmax is the maximum reference voltage.
The value of the Output voltage amplitude parameter determines the amplitude of the output voltage.
At zero, the pulse is initialized as high, unless the Pulse delay time parameter is greater than zero, or the demanded duty cycle is zero.
For a 100% duty cycle, the input voltage is set to 0.01V for accurate mapping of the output signals from the driver block.
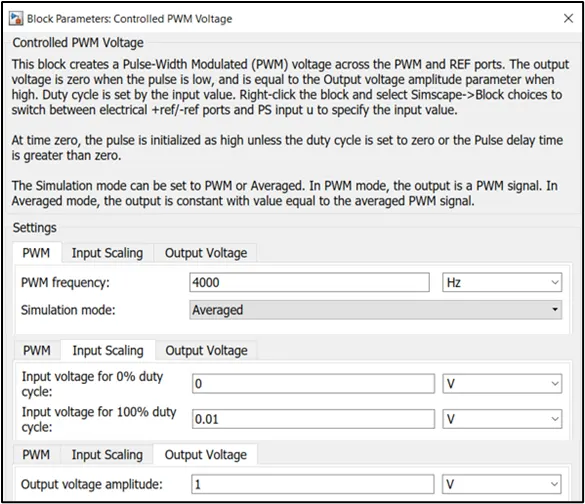
Fig.10. Controlled PWM Block Configuration
- H-Bridge Block
The H-Bridge block represents an H-bridge motor driver. The block can be driven by the Controlled PWM Voltage block in PWM or Averaged mode. In PWM mode, the motor is powered if the PWM port voltage is above the Enable threshold voltage. In Averaged mode, the PWM port voltage divided by the PWM signal amplitude parameter defines the ratio of the on-time to the PWM period. Using this ratio and assumptions about the load, the block applies an average voltage to the load that achieves the correct average load current. The Simulation mode parameter value must be the same for the Controlled PWM Voltage and H-Bridge blocks.
If the REV port voltage is greater than the Reverse threshold voltage, then the output voltage polarity is reversed. If the BRK port voltage is greater than the Braking threshold voltage, then the output terminals are short-circuited via one bridge arm in series with the parallel combination of a second bridge arm and a freewheeling diode. Voltages at ports PWM, REV, and BRK are defined relative to the REF port.+— Positive Load Connection port-— Negative load connection portPWM— Pulse-width modulated signal (associated with the pulse-width modulated signal. The voltage is defined relative to the REF port)REF— Reference (associated with the floating zero volt reference)REV— REV (associated with the voltage that controls when to reverse the polarity of the H-Bridge block output. The voltage is defined relative to the REF port)BRK— BRK (associated with the voltage that controls when to short circuit the H-Bridge block output. The voltage is defined relative to the REF port)H— Thermal port (The heat generated by the bridge on-resistance and freewheeling diodes is added to the thermal port. The thermal port has an associated thermal mass and initial temperature that you can set from the Thermal Port parameters)
The output signals from the Driver block are mapped in mV. This means that the change in acceleration or deceleration is measured at smaller magnitudes of voltage. Hence, the input threshold voltages for the H-Bridge shall be set to 0.01 V for accurate control of the DC motor.
To attain the thermal parameters of the H-block, we use the "show thermal port" option by right-clicking on the block itself. Figure 11 shows the block parameters.
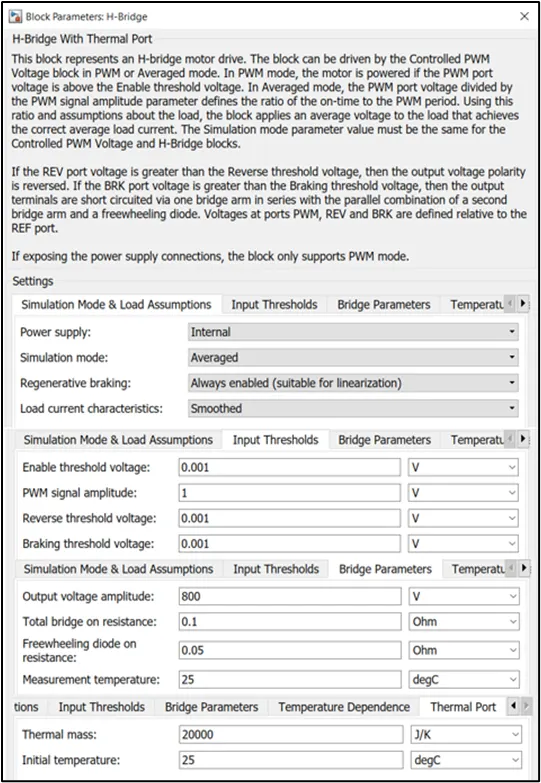
Fig.11. H-Bridge Block Configuration
- Current Sensor Block
The block represents an ideal current sensor, that is, a device that converts current measured in any electrical branch into a physical signal proportional to the current.
Connections + and - are conserving electrical ports through which the sensor is inserted into the circuit. The connection 'I' is a physical signal port that outputs the current value.
The output signal from this block will be used to measure the SoC of the battery.
- Temperature Sensor Block
The Temperature Sensor block represents an ideal temperature sensor, that is, a device that determines the temperature differential measured between two points without drawing any heat.Connections A and B are thermal conserving ports that connect to the two points where the temperature is being monitored. Port T is a physical signal port that outputs the temperature differential value.
The block positive direction is from port A to port B. The measured temperature is determined as T = TA – TB.
[D] Motor Drive Subsystem: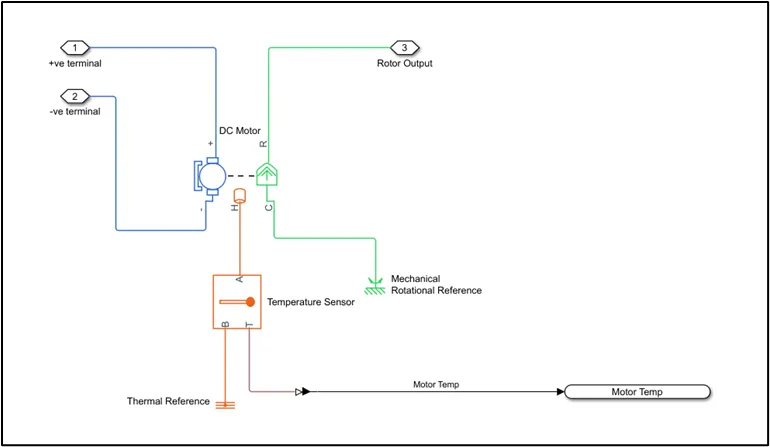
Fig.12. Motor Drive Control Subsystem
- DC Motor Block
This block represents the electrical and torque characteristics of a DC motor.The block assumes that no electromagnetic energy is lost, and hence the back-emf and torque constants have the same numerical value when in SI units. Motor parameters can either be specified directly or derived from the no-load speed and stall torque. If no information is available on armature inductance, this parameter can be set to some small non-zero value.
+— Positive terminal-— Negative terminalC— Motor caseR— Motor rotorH— Thermal port
We can configure this block with the values we had previously calculated in the parameters. According to the parameters, the Rated Speed is given as 2367 RPM, Rated Load is set to 280 kW, and the DC supply voltage is kept at 800V.
Similar to the H-Bridge, the thermal port is enabled for the motor block. Here, the thermal port is used to simulate the effects of copper resistance losses that convert electrical power to heat.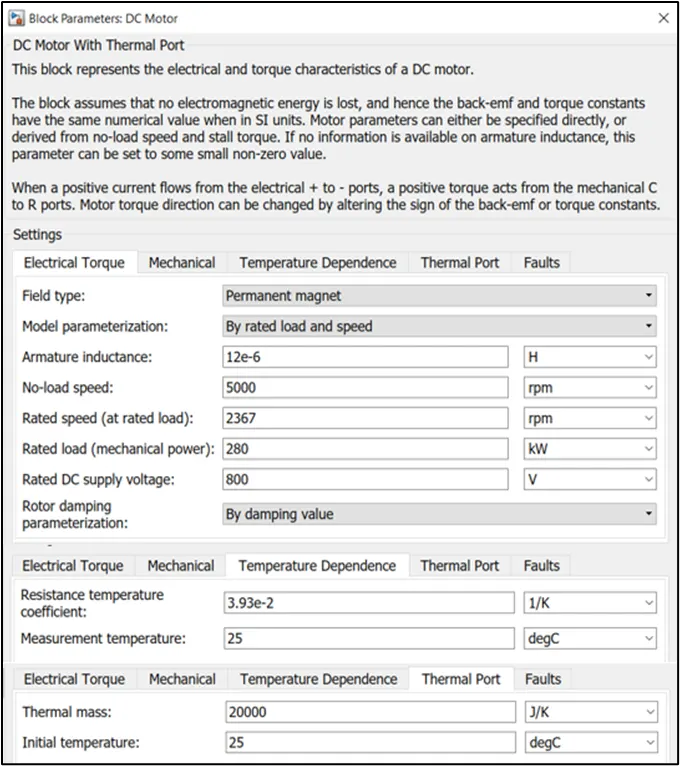
Fig.13. DC Motor Block Configuration
[E] Vehicle Subsystem: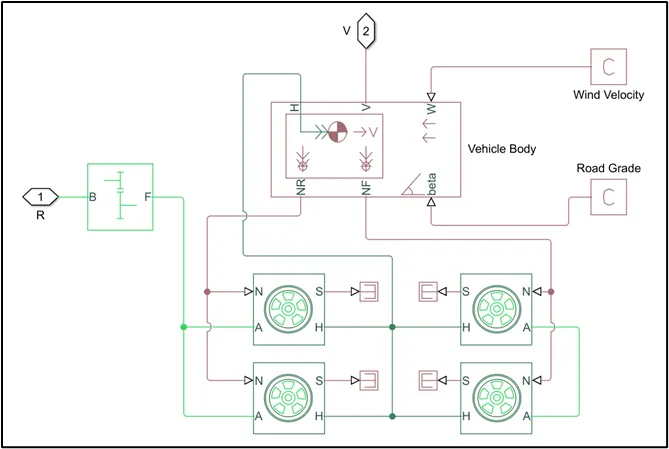
Fig.14. Vehicle Subsystem
- Simple Gear Block
The Simple Gear block represents a gearbox that constrains the connected driveline axes of the base gear, B, and the follower gear, F, to corotate with a fixed ratio that you specify. You choose whether the follower axis rotates in the same or opposite direction as the base axis. If they rotate in the same direction, the angular velocity of the follower, ωF, and the angular velocity of the base, ωB, have the same sign. If they rotate in opposite directions, ωF and ωB have opposite signs.B— Base (Rotational mechanical conserving port associated with the base, or input, shaft)F— Follower (Rotational mechanical conserving port associated with the follower, or output, shaft)
As per the model parameters, the value for the gear ratio is set to 4.2:1.
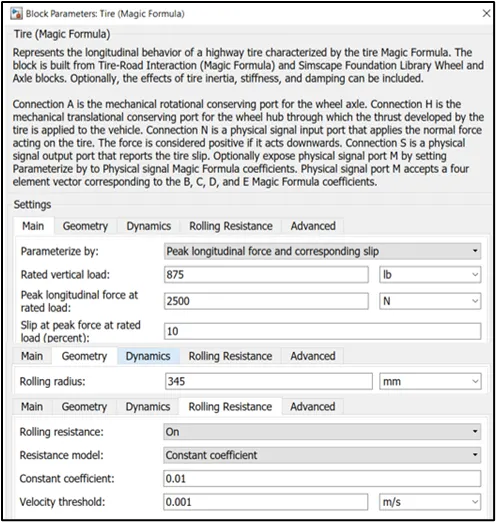
- Tire (Magic Formula) Blocks
The Tire (Magic Formula) block models a tire with longitudinal behavior given by the Magic Formula [1], an empirical equation based on four fitting coefficients. The block can model tire dynamics under constant or variable pavement conditions.
The longitudinal direction of the tire is the same as its direction of motion as it rolls on the pavement. This block is a structural component based on the Tire-Road Interaction (Magic Formula) block.
To increase the fidelity of the tire model, you can specify properties such as tire compliance, inertia, and rolling resistance. However, these properties increase the complexity of the tire model and can slow down the simulation. Consider ignoring tire compliance and inertia if simulating the model in real-time or if preparing the model for hardware-in-the-loop (HIL) simulation.
For our model, we utilize 4 of these blocks to simulate the wheels of the car. Each block is configured with the same values as mentioned in the parameters section. Also, the front and rear tires are connected in pairs respectively. The gear is connected with the front axle for power delivery.Rear Tire
Front Tire
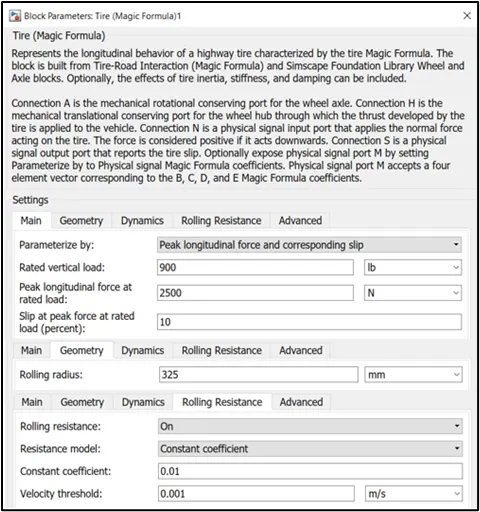
Fig.15. Tire Block Configurations
- Vehicle Body Block
The Vehicle Body block represents a two-axle vehicle body in longitudinal motion. The vehicle can have the same or a different number of wheels on each axle. For example, two wheels on the front axle and one wheel on the rear axle. The vehicle wheels are assumed identical in size. The vehicle can also have a center of gravity (CG) that is at or below the plane of travel.
The block accounts for body mass, aerodynamic drag, road incline, and weight distribution between axles due to acceleration and road profile. Optionally include pitch and suspension dynamics. The vehicle does not move vertically relative to the ground.
In the block, we input all the necessary values as mentioned in the parameters section. The Tire blocks are connected with the respective ports.W— Headwind speed, m/s (Physical signal input port for headwind speed)beta— Road incline angle, rad (Physical signal input port for road incline angle)V— Longitudinal velocity, m/s (Physical signal output port for vehicle longitudinal velocity)NF— Front axle normal force, N (Physical signal output port for normal force on the front axle. Wheel forces are considered positive if acting downwards)NR— Rear-axle normal force, N (Physical signal output port for normal force on the rear axle. Wheel forces are considered positive if acting downwards)H— Horizontal motion (Conserving port associated with the horizontal motion of the vehicle body. All tires are connected to this port)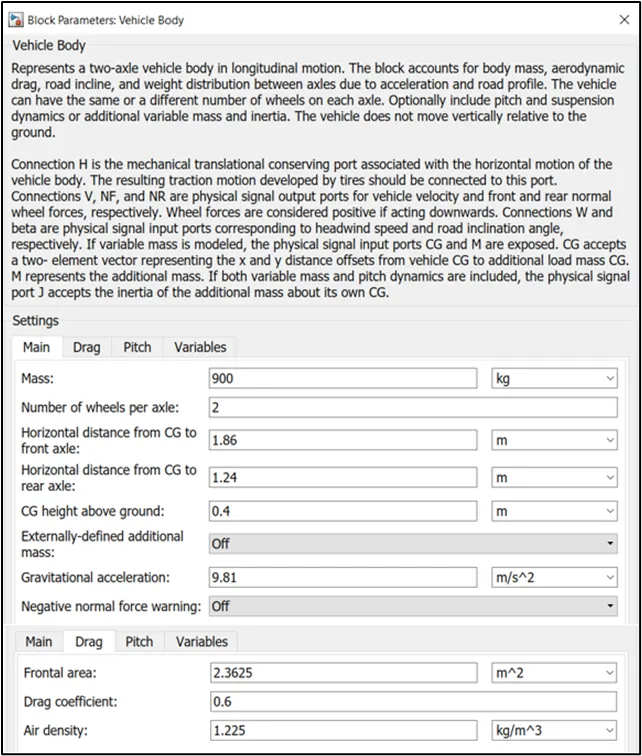
Fig.16. Vehicle Body Block Configuration
[F] Battery Subsystem:
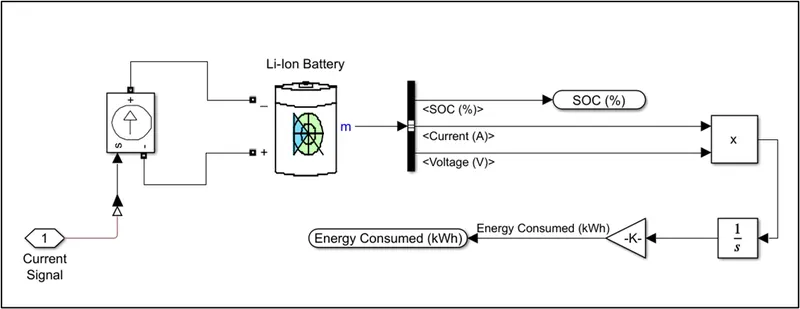
Fig.17. Battery Subsystem
- Controlled Current Source Block:
The Controlled Current Source block converts the Simulink input signal into an equivalent current source. The generated current is driven by the input signal of the block. The positive current direction is as shown by the arrow in the block icon.
The positive direction of the current flow is indicated by the arrow.
The current signal from the control system determines how this current source behaves with how much flow of current.
- Battery Block:
The Battery block implements a generic dynamic model that represents the most popular types of rechargeable batteries.For the lithium-ion battery type, the model uses these equations.
-
Discharge Model (i* > 0)
`f_1 (it,i∗,i)=E_0 −K⋅ Q/( Q−it) ⋅i∗−K⋅ Q /(Q−it) ⋅it+A⋅exp(−B⋅it)`
-
Charge Model (i* < 0)
`f_2(it,i∗,i)=E_0−K⋅Q/(it+0.1⋅Q)⋅i∗−K⋅Q/(Q−it)⋅it+A⋅exp(−B⋅it)`
m— Battery temperature, state-of-charge, current, voltage, age, maximum capacity, and ambient temperature (Output vector of signals for the battery temperature, state-of-charge, current, voltage, age, maximum capacity, and the ambient temperature)Battery SOC is represented as a percentage (between 0 and 100%). The SOC is 100% for a fully charged battery and 0% for an empty battery. The SOC is calculated as:
`SOC=100(1−1/Qint_0^ti(t).dt)`
As per the given data for the battery pack of M7Electro, the capacity for it is 54 kWh operating at 800V. This means that the Ampere-hour rating is 67.5 AHr. These values are added to the block.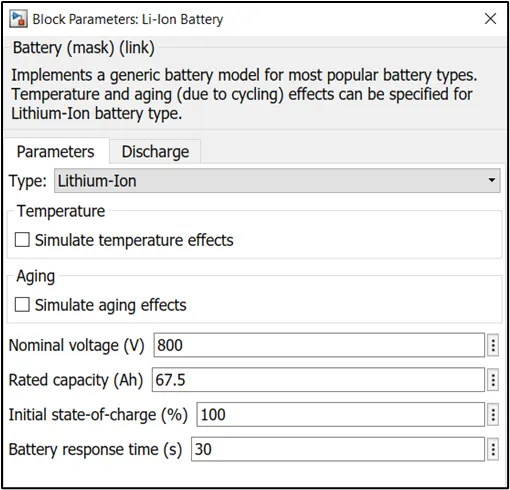
Fig.18. Battery Block Configuration
- Energy Consumption Estimation
In the above subsystem, we have integrated the Energy estimate block, where the product of Voltage and Current is integrated and divided by 3600x1000 to get the Energy Consumed in kWh. This arrangement gives us the Energy consumed by the battery. -
- Results:-
In this project, we have evaluated the results which go as follows:
S-FTP (596 seconds)
A. Actual Speed vs. Drive Cycle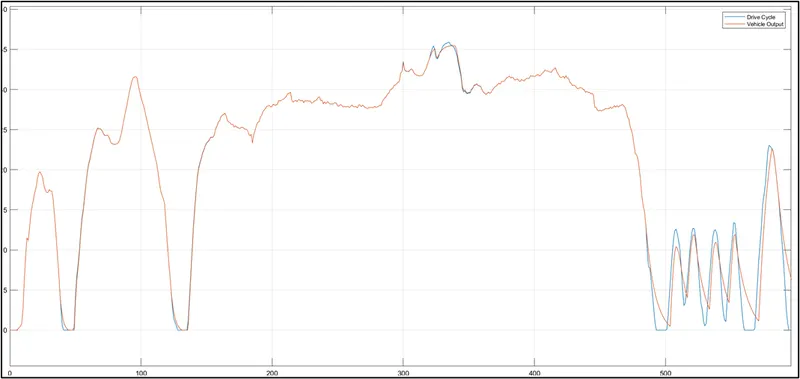
Fig.19. Plot for Actual Speed vs. Drive Cycle
From the above plot, it is evident that with the given model parameters and configuration, our model can handle the drive cycle conditions in this case. The model can mimic the drive cycle perfectly until the final phase of consecutive acceleration and deceleration. This is due to the lack of brake modeling in the model. The drive cycle requires strong braking. It is expected that with the use of brakes in the model, the cycle will be traced more efficiently.
B. Battery data (SoC and Energy Consumption)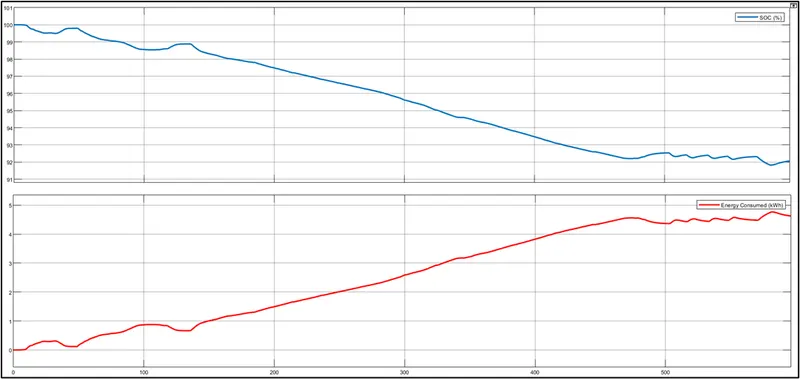
Fig.20. Plot for the Battery Statistics
From the above plot, we can study the battery behavior for the given conditions. In general, with this drive cycle, the battery is depleted by approximately 8.9%. We can see that during deceleration phases, the battery is being charged due to regenerative braking. Since we haven't tuned the regenerative braking, the program uses default settings to charge the battery.
While the vehicle completes the cycle, the system uses a maximum of 4.76 kWh of battery which again reduces at the end due to charging.
C. Thermal behavior of Controller and DC Motor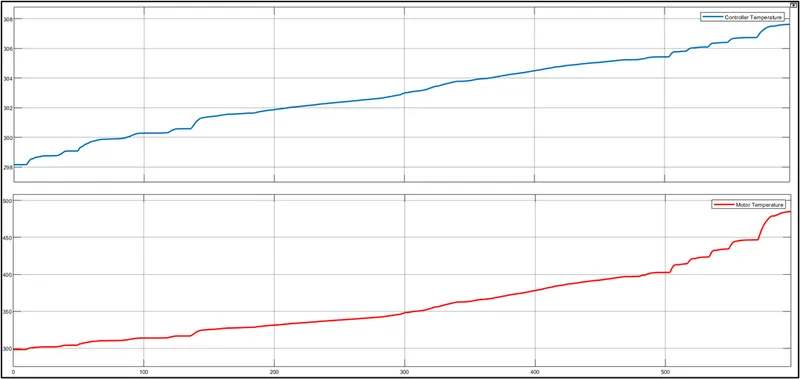
Fig.21. Plot for the Thermal statistics
The thermal behaviors are captured for the motor and the controller. On the top half, we have the motor temperature data which shows that while operating the motor temperature starts increasing from 25ºC to 211ºC. This happens majorly due to the I²R losses in the stator windings. The heavy working conditions for this motor and a lack of a thermal model have caused the temperature to shoot up quite a bit.
On the bottom half, we have the controller temperature data which shows that during operation the controller temperature starts increasing from 25ºC to 34.5ºC. The cause of this is high switching losses in the H-bridge.
These values are depending on the assumed values of Thermal masses we have provided for both of the components.
It goes to show that the temperature of the EV components has to be kept under control to avoid any further loss in efficiency and worst-case failures.
D. Distance traveled by the Vehicle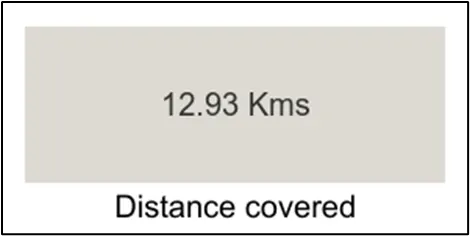
Fig.22. Total distance traveled
Our vehicle model traversed a distance of 12.93 KM with the S-FTP drive cycle. - Conclusion:-
The following points are drawn as conclusions from this project:
- A simplified Formula E car powertrain model was designed and the required parameters and results were documented.
- From the simulation results, it is clear that if we can't exactly get the real-time results, we can still serve the purpose by considering the assumptions.
- There lies a lot of scope for improvement in the model. For example, due to the high temperatures of the components in the first drive cycle, the model could utilize a thermal management system to keep the components under working limits.
- Satisfactory results were acquired from the model in terms of the parameters assumed.
IV. REFERENCES
- ABB FIA Formula E - Formula E Webpage
- Virgin Formula-E - Everything you need to know about Formula-E
- Mahindra Racing Website - Mahindra Racing Formula E Webpage
- MathWorks Help - Simulink Documentation - MathWorks India
- Chalmer's University Student Thesis - EmmaGrunditz_PhDthesis_lowrez.pdf (chalmers.se)