Project 1 - COVID-19 Vaccinations Trend Analysis
COVID-19 Vaccinations Trend Analysis
Aim: To analyze the trend o Covid-19 Vaccinations and Effectiveness of the vaccination based on the different countries by year wise.
Introduction: The introduction of COVID-19 vaccine is a major step towards reducing the spread of the pandemic and further reducing the associated disease and deaths. The COVID-19 vaccine introduction is the world's largest vaccination drive and roll out requires planning at various levels. In this project we will analyze the data of vaccinations across different countries.
Problem statement: To analyze the data related to the number of vaccinations given to people’s daily, total vaccinations by each year, how many peoples are fully vaccinated based on country, the population which has received at least one dose of the vaccine and the different vaccines used and their availability to different countries.
Methodology:
Importing the data:
First, we import the data and here we have data in the csv format.
Open the PowerBI desktop and click on Get Data to import the csv file and load the data.
Data Cleaning:
After importing data, there are 6745 rows and 6 columns. We need to clean the data with the help of Power Query Editor.
To open the Power Query Editor by clicking on Transform Data under the Home tab and go to Power Query Editor.
In Power Query Editor, go to the View tab, enable Column Distribution, Column Quality and Column Profile. It will help you to find out missing values, any data errors, any data type mismatch, any outliers.
Data Visualization:
I have used Power BI tool to visualize the data available to gain meaningful insights and better understand the dataset. I have used different visualizations like bar graphs and line graphs which are available in the tool. Additionally, it also provides tools to filter data by a variety of variables, such as geographic region and time, to provide a more granular look at the data.
Analysis:
Now we will see all the columns in the data.
Country: There are a total of 223 countries.
Daily Vaccinations Raw: It gives the raw data collected on vaccinations.
Daily vaccinations: Vaccinations on a particular day
Daily vaccinations per million – gives the number of vaccinations administered for every million population on any day.
ISO Code: Initial code of all countries
Date: It shows the date hierarchy (We have a data in period of December 2020 to March 2022)
People fully vaccinated: The aggregated value of people who received the two doses and 1 booster dose.
People fully vaccinated per 100: For every 100 people how many are fully vaccinated.
People vaccinated: The total number of people who received at least one dose of vaccine.
People vaccinated per 100: The number of people who received at least one dose of vaccine, considering for every 100 people.
Source name: It will give the Source name on which the data is provided.
Source website: It gives the website link to where the data was obtained.
Total vaccinations: The total number of vaccinations administered is nothing, but the sum of the doses given on any date to the total vaccinations of the previous day.
Total vaccinations per 100 – The total vaccinations administered per 100 people which also an aggregated data.
Vaccines – gives the different vaccines and their manufacturers separated by commas.
Now we will see the visualizations in the for some of the data,
The card visualization has been used to show different numeric values like total countries, vaccination details and number of people vaccinated.
The Slicer is added with Year and the Month. It is used to know how the vaccine process is going on.
Similarly Bar graphs and Tree map, Area Chart, Maps
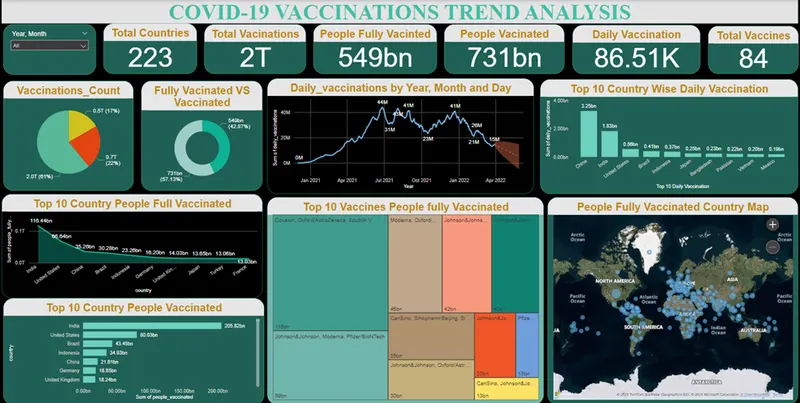
- There are Total 223 Countries
- There are 2 trillion Vaccinations.
- There are 549 billion people fully vaccinated.
- There are 731 billion people vaccinated at least 1 dose.
- There are 86.51 thousand people daily vaccinated.
- There is total 84 total vaccines.
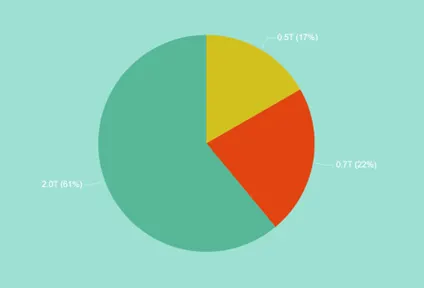
- From the Pie Chart
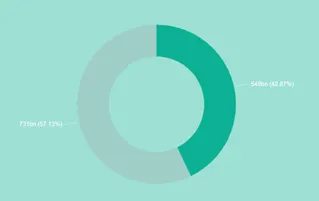
- From the Donut chart we can that 25% of peoples are vaccinated at least one dose and 75% of peoples are fully vaccinated in the world.
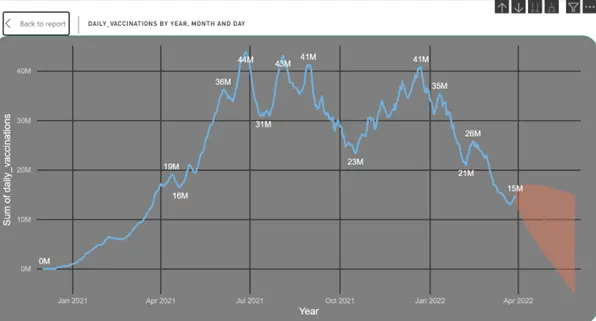
- We can see the line graph of covid vaccination yearly wise and forecast the data.
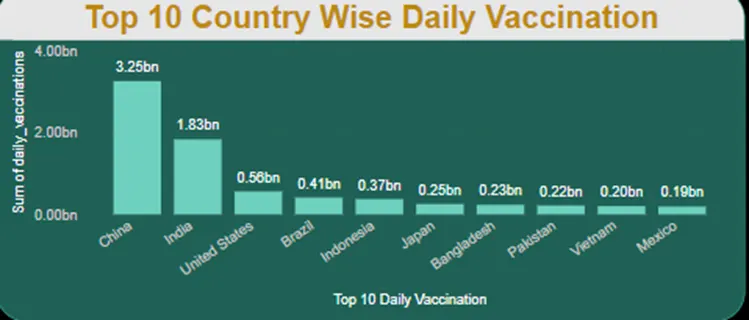
- From the Bar graph, Top 10 Countries Wise Daily vaccination
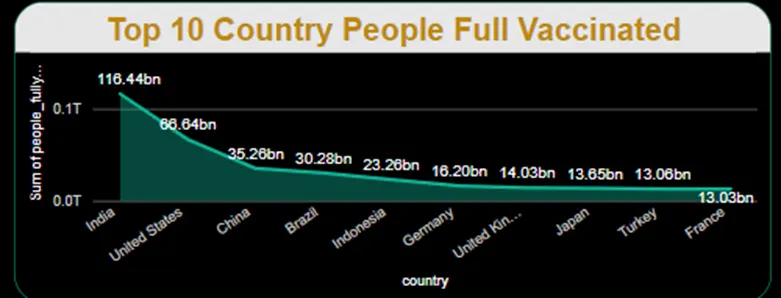
- From the Area chart, we can say that Top 10 Countries people fully vaccinated.
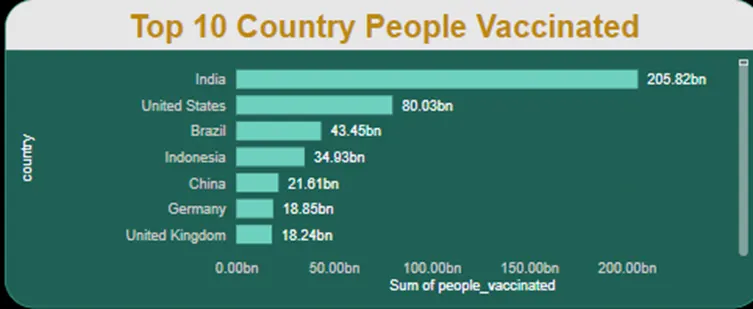
- From the clustered chart, we can say Top 10 country people vaccinated (at least one dose)
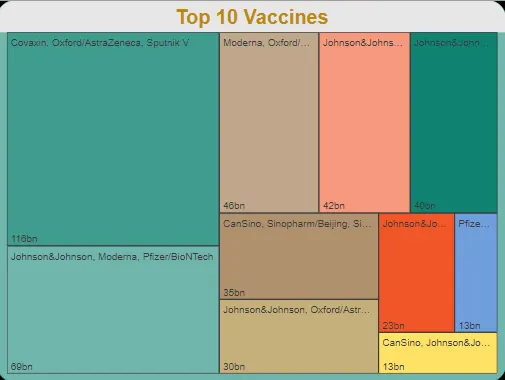
- From Tree map, we can see the Top 10 vaccines.
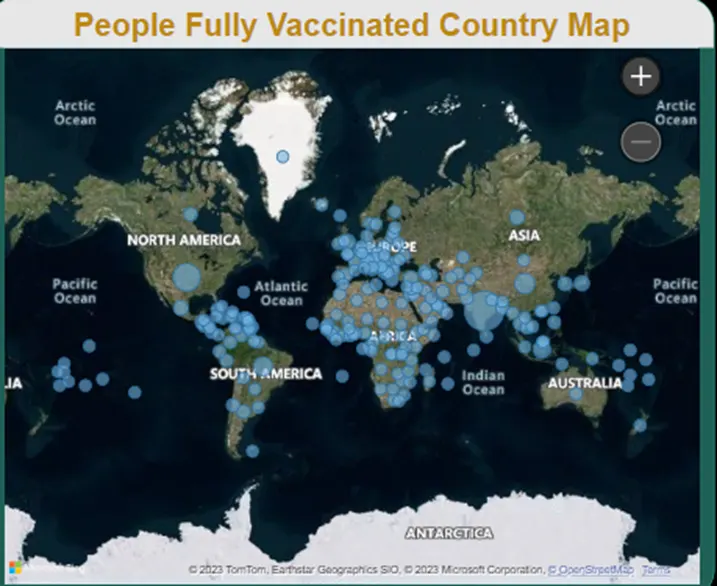
- From the map visual, we can see the fully vaccinated people
Insights:
The final report provides valuable insights into the vaccination efforts around the world. By analyzing the data, it is possible to identify the top 10 sources of vaccines, as well as the countries with the highest rates of fully vaccinated individuals.
The high rate of fully vaccinated showing that people are interested to destroy the deadly virus from the world.
By using the insights gained from this analysis, it is possible to make informed decisions and take effective action to address the challenges posed by COVID-19. So, we can conclude that the analysis of the data has been a valuable and informative process, and it is hoped that the insights gained will be useful in the ongoing efforts to combat the pandemic.
Recommendations:
- Further investigate the reasons behind India's success:
- Explore the factors contributing to India's leading position in terms of fully vaccinated individuals. Analyze their vaccination strategies, distribution network, and public awareness campaigns to identify best practices that can be implemented in other countries.
- The developed and economically strong countries should help the underdeveloped and developing countries to improve the vaccination of the people.
- At least 90% of the population should be vaccinated at least once to avoid further problems.
Conclusions:
- Leading Countries: India emerges as the leading country in terms of fully vaccinated individuals, followed by the United States and China. India's significant progress in administering vaccinations is notable, with the United States also demonstrating commendable efforts.
- There is evidence that the number of people receiving their first dose of the vaccine is steadily increasing, while the percentage of people receiving their second dose has also been steadily increasing. Additionally, the data shows that the rate of vaccination varies across countries, with some countries having higher rates than others.