Project 1_Comparative study of different storey buildings for Seismic forces
`bbb "1. AIM: "`To examine the factors affecting the time period of the building by considering buildings with various structural configurations and analyzing them using ETABS.
`bbb"2. BUILDING DETAILS"`
The following details are applicable for every building unless some other value is specified explicitly in the results table.
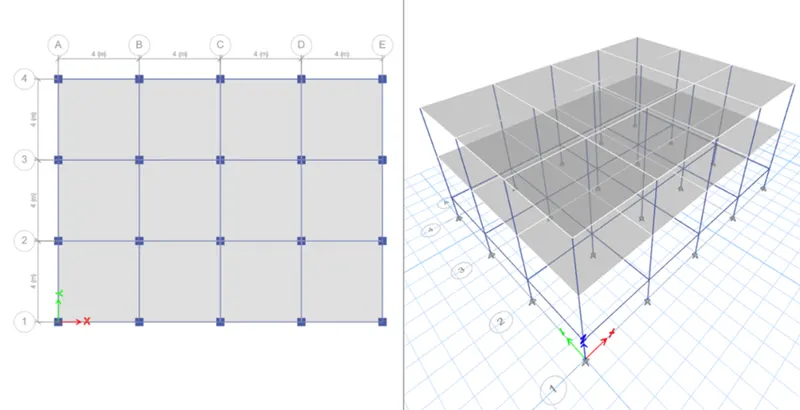
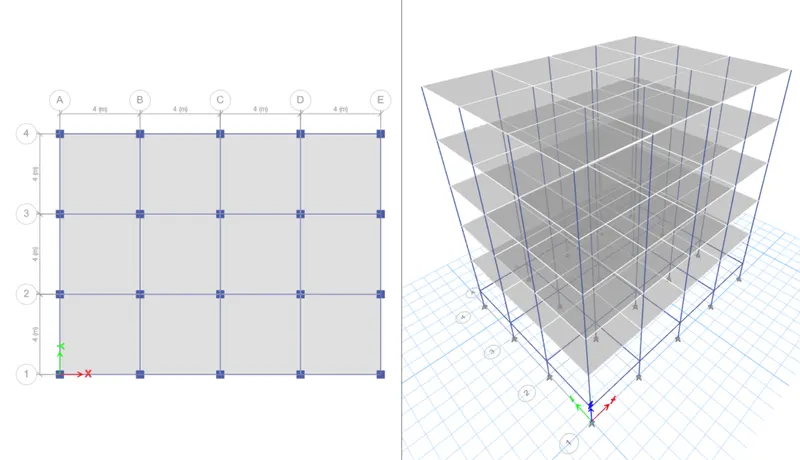
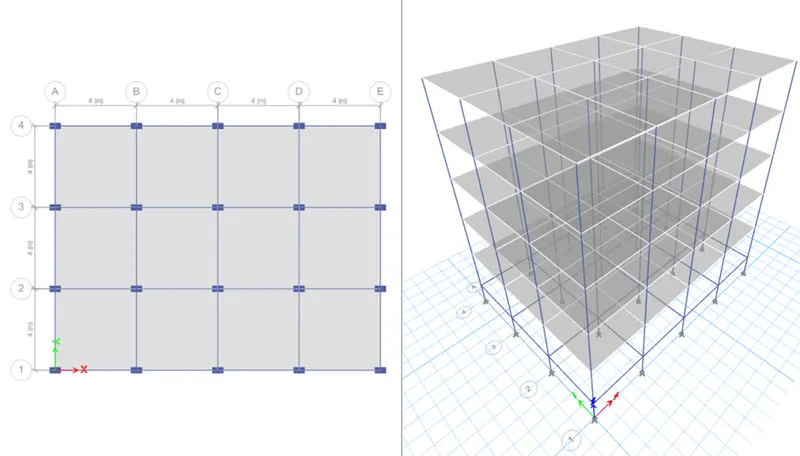
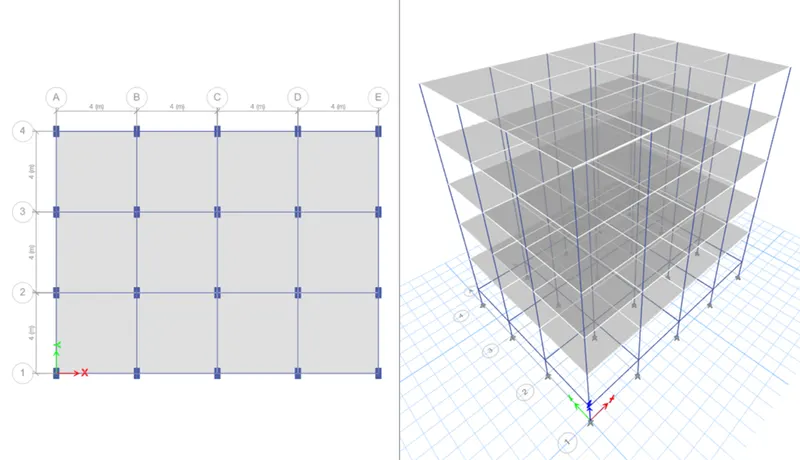
- The plinth level is 1.5 m from the foundation and every floor height is 3 m.
- There are 4 bays in the X direction and 3 bays in the Y direction.
- Bay length in each plan direction is 4m.
- All beams are of the size 400 mm x 300 mm.
- Slab thickness is 150 mm for every floor
- Columns are considered as pinned at the foundation level
- Loads considered for the analysis are
- Self-weight
- IL = 3 kN/m² (including roof)
- Wall load = 10 kN/m over every beam (including roof)
- Earthquake in X dir. (As per IS 1893)
- Earthquake in Y dir. (As per IS 1893)
- The grade of concrete is M30 and the grade of steel is Fe415.
`bbb"3. ETABS MODEL"`
Building A
Building B
Building C
Building D
Building E
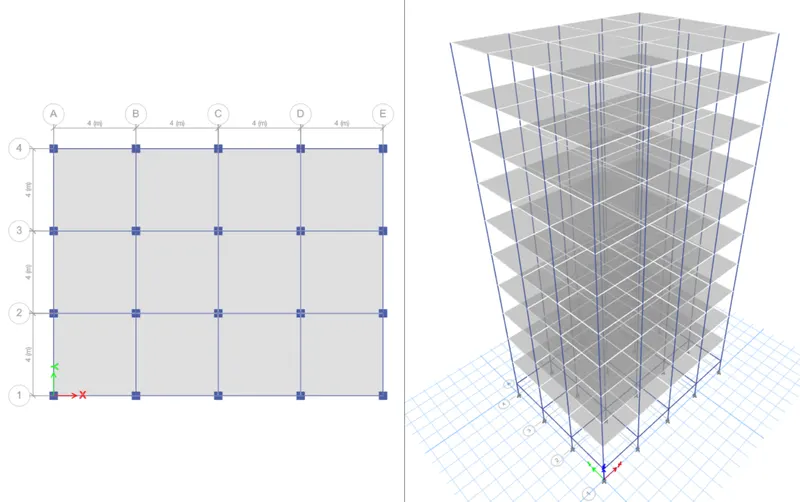
Building F
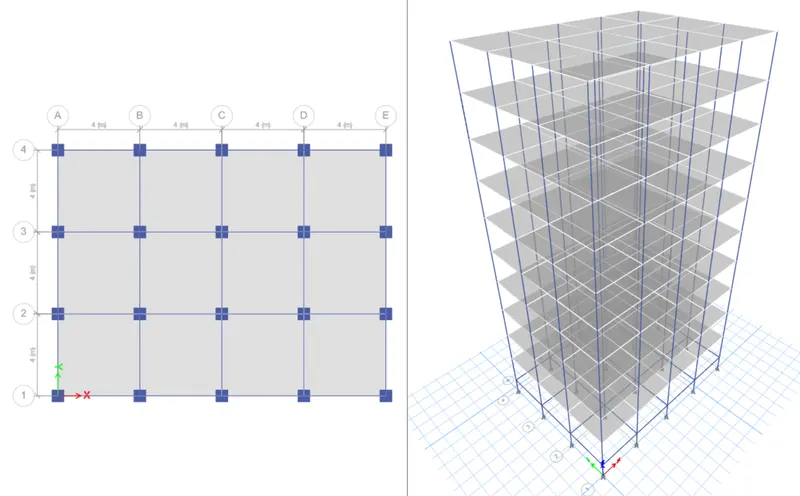
Building G
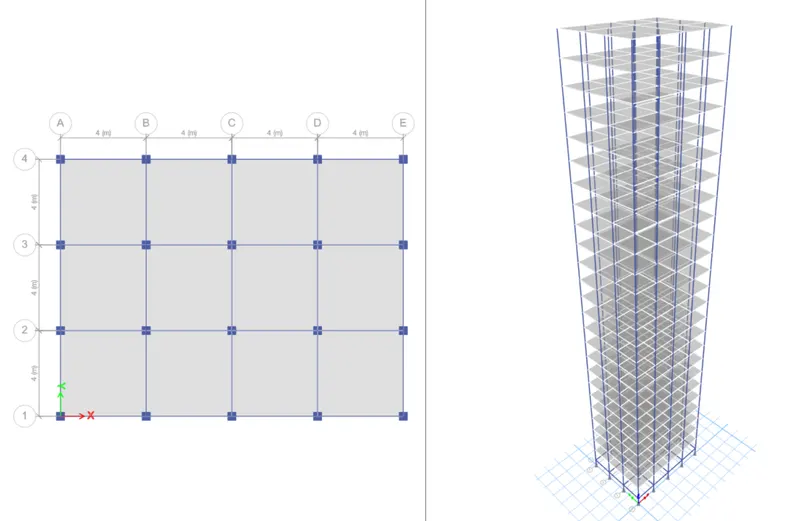
Building H, J, and K
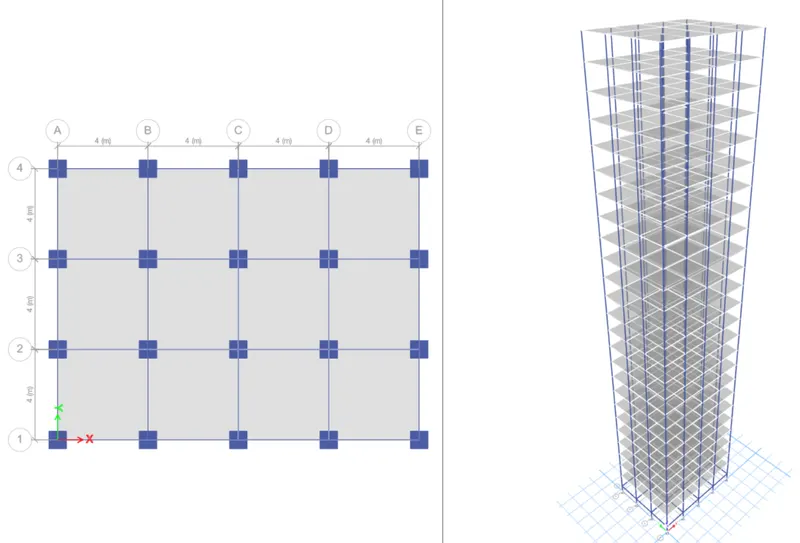
`bbb"4. MODAL ANALYSIS DATA"`
Results of modal analysis for the given buildings are given in the table below. The analysis is done considering the gross moment of inertia of the sections as well as by considering the effective moment of inertia of the section as per IS 1893 (35% for beams and 70% for columns). The approximate time period as given in IS 1893 is also provided. `(T_a = frac{0.09 \times h}{\sqrt{d}})`
Results for gross moment of inertia represent the building behavior for mild earthquakes that is when the building stays in its elastic range. And the results for effective moment of inertia represent the building behavior under severe earthquake that is when the structural members crack and the stiffness of the members is reduced.
Modal mass (MM) which represents the mass excited for that time period is also specified for the given direction for gross moment of inertia. The modal mass for effective moment of inertia (which is not mentioned) is similar to that of gross moment of inertia with the difference being about less than 1%
| Building | No. of Storeys | Column Dimensions (mm) and other data | For gross MOI | For eff. MOI | Approximate | ||||
| T (sec) | Dir. | MM (%) | T (sec) | Dir. | T (sec) | Dir. | |||
| A | 2 | 400 x 400 | T1 = 0.50 | UY | 85.8 | T1 = 0.76 | UY | T1 = 0.19 | UY |
| T2 = 0.49 | UX | 85.8 | T2 = 0.74 | UX | T2 = 0.17 | UX | |||
| T3 = 0.44 | RZ | 85.6 | T3 = 0.65 | RZ | |||||
| B | 5 | 400 x 400 | T1 = 1.04 | UY | 84.3 | T1 = 1.58 | UY | T1 = 0.43 | UY |
| T2 = 1.01 | UX | 84.3 | T2 = 1.53 | UX | T2 = 0.37 | UX | |||
| T3 = 0.91 | RZ | 84.3 | T3 = 1.34 | RZ | |||||
| C | 5 | 550 x 300 (500 mm along X dir.) | T1 = 1.15 | UY | 84.3 | T1 = 1.68 | UY | T1 = 0.43 | UY |
| T2 = 0.93 | RZ | 84.3 | T2 = 1.45 | UX | T2 = 0.37 | UX | |||
| T3 = 0.93 | UX | 84.2 | T3 = 1.37 | RZ | |||||
| D | 5 | 300 x 550 (300 mm along X dir.) | T1 = 1.12 | UX | 84.4 | T1 = 1.64 | UX | T1 = 0.43 | UX |
| T2 = 0.95 | UY | 84.1 | T2 = 1.49 | UY | T2 = 0.37 | UY | |||
| T3 = 0.90 | RZ | 84.2 | T3 = 1.34 | RZ | |||||
| E | 10 | Upper 5 stories: 400 x 400 Lower 5 stories: 600 x 600 | T1 = 1.731 | UY | 80 | T1 =2.759 | UY | T1 =0.82 | UY |
| T2 = 1.676 | UX | 80 | T2 = 2.673 | UX | T2 = 0.71 | UX | |||
| T3 = 1.470 | RZ | 79.9 | T3 = 2.192 | RZ | |||||
| F | 10 | 600 x 600 | T1 = 1.735 | UY | 82.6 | T1 = 2.792 | UY | T1 =0.82 | UY |
| T2 = 1.678 | UX | 82.3 | T2 = 2.704 | UX | T2 = 0.71 | UX | |||
| T3 = 1.468 | RZ | 83.3 | T3 = 2.189 | RZ | |||||
| G | 25 | Upper 5 stories: 400 x 400 Middle 5 stories: 600 x 600 Lower 10 stories: 800 x 800 | T1 = 4.170 | UY | 78.4 | T1 = 6.664 | UY | T1 = 1.99 | UY |
| T2 = 3.988 | UX | 78.9 | T2 = 6.424 | UX | T2 = 1.72 | UX | |||
| T3 = 3.190 | RZ | 78.8 | T3 = 4.479 | RZ | |||||
| H | 25 | 800 x 800 | T1 = 4.416 | UY | 80.4 | T1 = 7.078 | UY | T1 = 1.99 | UY |
| T2 = 4.222 | UX | 80.8 | T2 = 6.825 | UX | T2 = 1.72 | UX | |||
| T3 = 3.311 | RZ | 82.6 | T3 = 4.519 | RZ | |||||
| J | 25 | 800 x 800 IL = 3.3 kN/m² | T1 = 4.425 | UY | 80.4 | T1 =7.094 | UY | T1 = 1.99 | UY |
| T2 = 4.231 | UX | 80.9 | T2 = 6.839 | UX | T2 = 1.72 | UX | |||
| T3 = 3.317 | RZ | 82.6 | T3 = 4.528 | RZ | |||||
| K | 25 | 800 x 800 IL = 3.6 kN/m² | T1 = 4.435 | UY | 80.4 | T1 = 7.109 | UY | T1 = 1.99 | UY |
| T2 = 4.240 | UX | 80.9 | T2 = 6.854 | UX | T2 = 1.72 | UX | |||
| T3 = 3.323 | RZ | 82.6 | T3 = 4.536 | RZ | |||||
For building H (Considering eff. Stiffness as per IS 1893)
| Building | Description | Time Period | Direction |
| H | For the given data (as mentioned in the above table) | T1 = 7.078 s | UY |
| T2 = 6.825 s | UX | ||
| T3 = 4.519 s | RZ | ||
| H1 | For columns fixed at the base | T1 = 6.404 s | UY |
| T2 = 6.191 s | UX | ||
| T3 = 4.088 s | RZ | ||
| H2 | By considering only 10% of the acutal axial stiffness | T1 = 8.168 s | UY |
| T2 = 7.571 s | UX | ||
| T3 = 4.537 s | RZ |
`bbb"5. BUILDING DISPLACEMENTS"` (Considering effective moment of inertia)
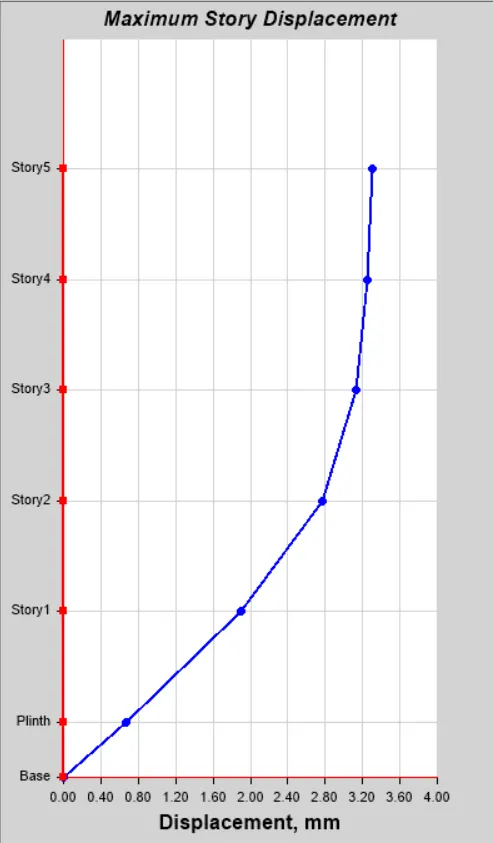
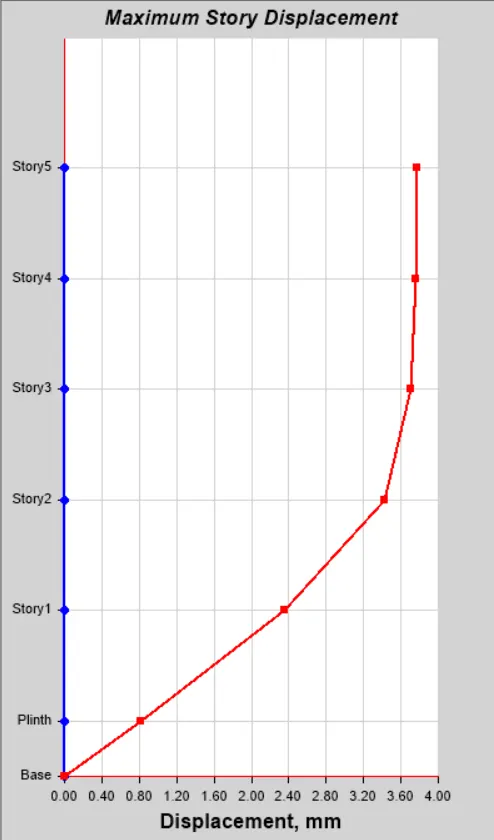
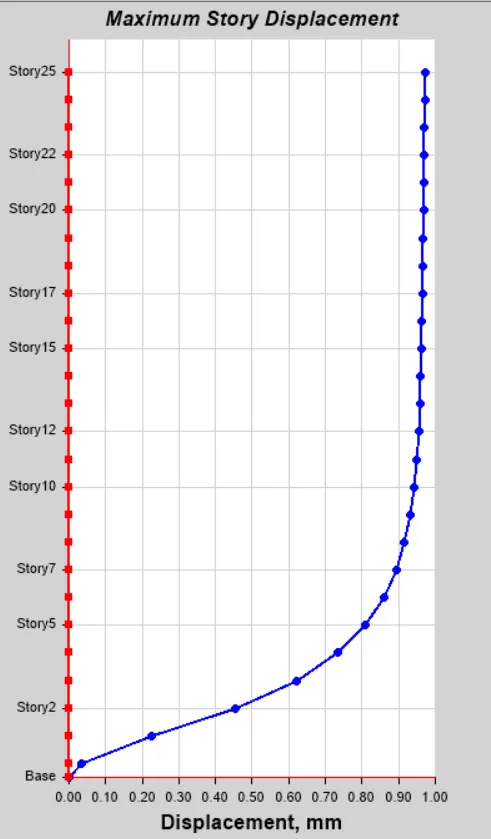
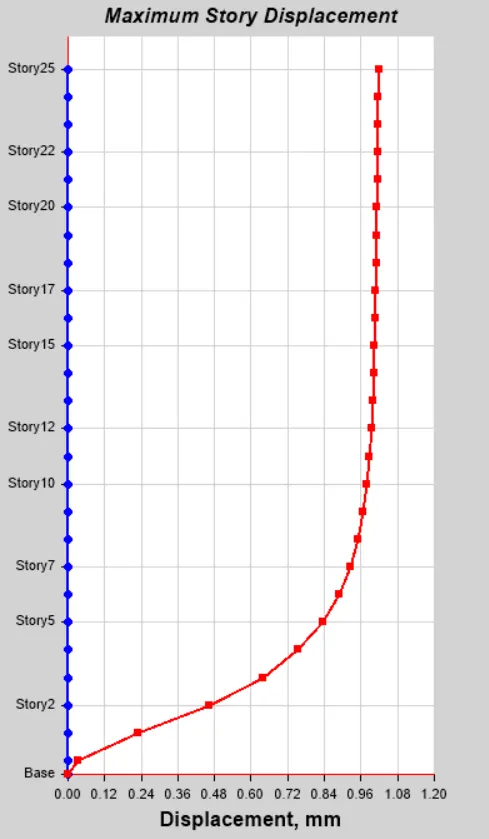
Note: The blue line shows the displacement of the building in the X direction and the red line shows the displacement of the building in the Y direction.
For Building B
For EQ_X For EQ_Y
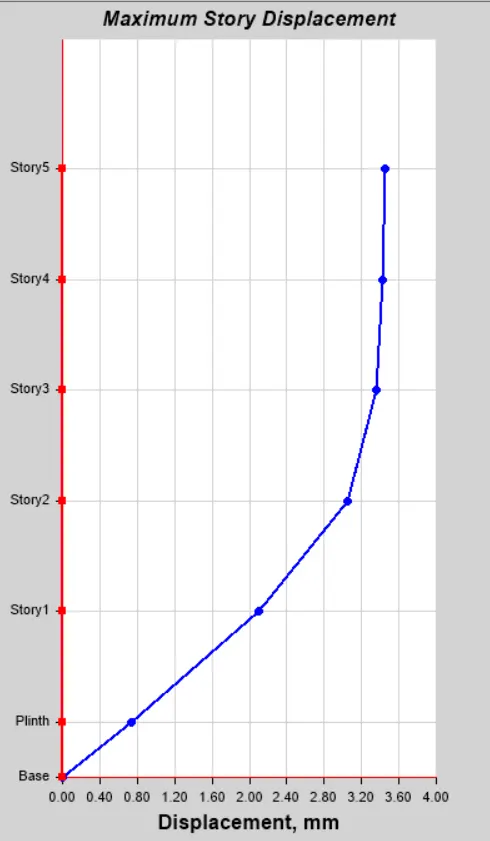
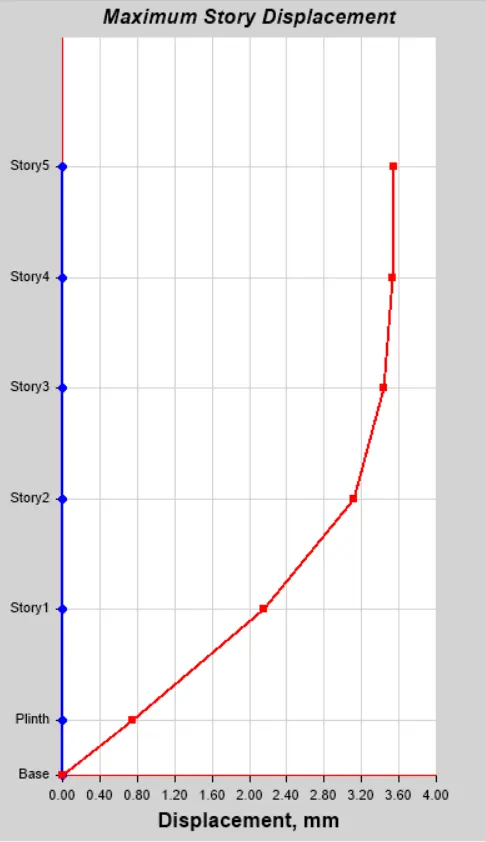
For Building C
For EQ_X For EQ_Y
For Building D
For EQ_X For EQ_Y
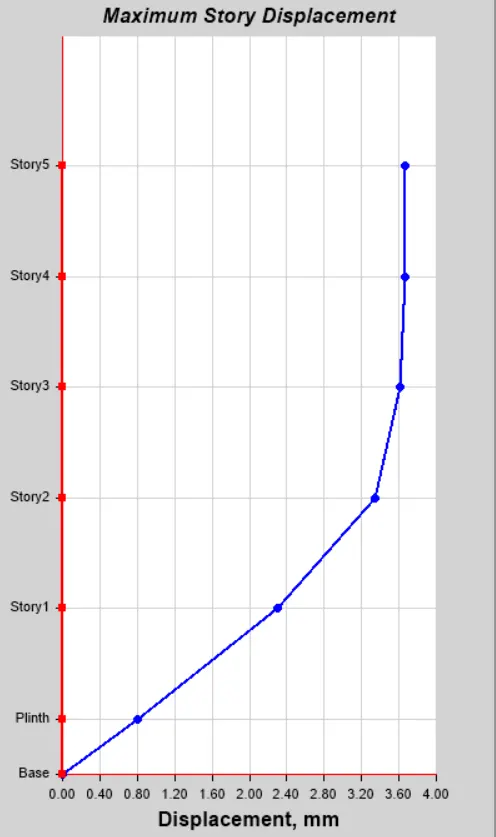
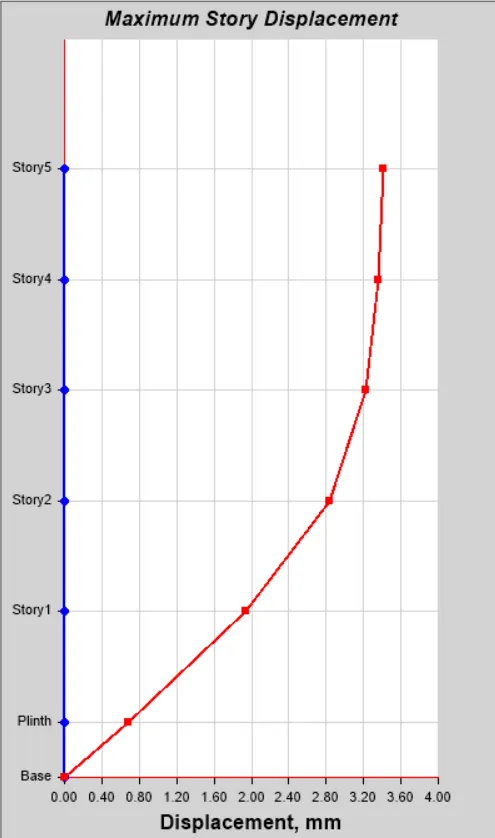
For Building H (Pinned supports)
For EQ_X For EQ_Y
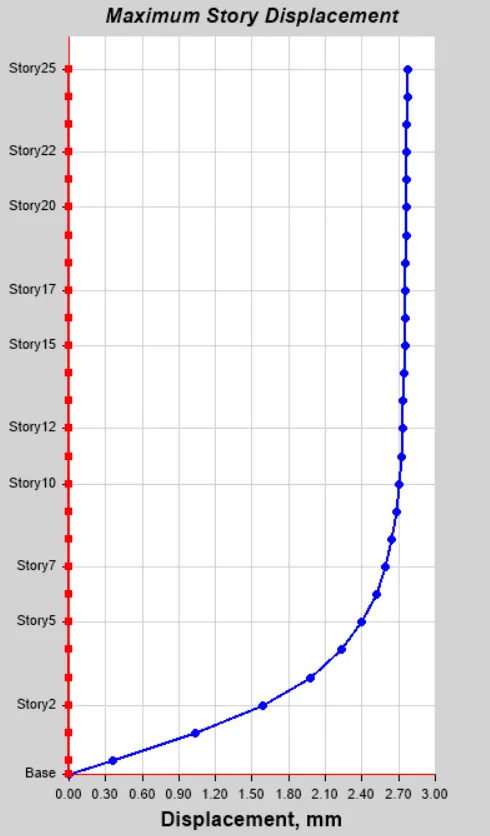
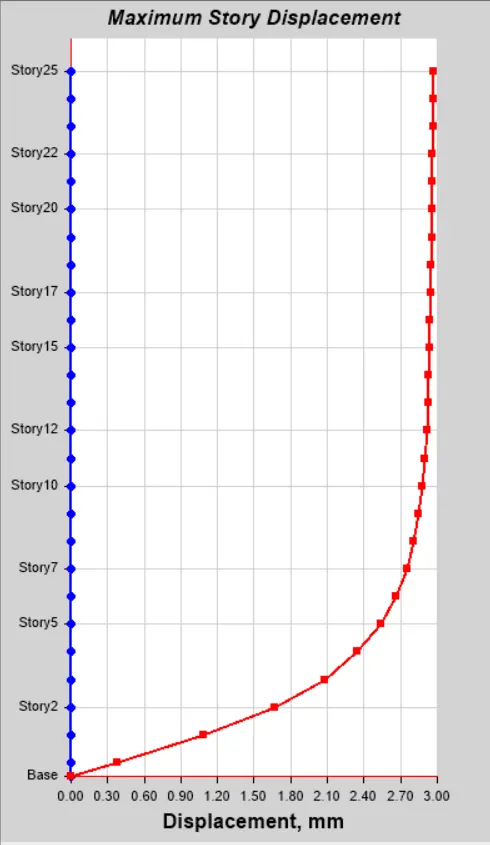
For Building H1 (Fixed supports)
For EQ_X For EQ_Y
`bbb"6. RESULTS"`
`bb"A. Effect of Stiffness"`
As the stiffness increases, the time period decreases. (Time period is inversely proportional to the square root of the stiffness)
1. Effect of building height
A building can be assumed as a vertical cantilever and as the height of the cantilever increases, the stiffness of the cantilever decreases hence as the height of the building increases, the overall stiffness of the building decreases which increases the time period.
Thus, the time periods of buildings A (2 stories), B (5 stories), F (10 stories), and H (25 stories) are in increasing order.
2. Effect of building width
As the width of the building increases, the stiffness of the building in that direction increases. Like how the stiffness of a cantilever beam increases with the increase of its depth.
Since there are more bays in the X direction compared to the Y direction, every building is stiffer along its X-axis compared to its Y-axis, and hence the first mode of vibration is in the Y direction i.e. the direction along which it is less stiff. (except for building D where extra stiffness is provided in the Y direction which is discussed in the next point)
3. Effect of Column Orientation
The stiffness of the column in any direction is proportional to the moment of inertia of the column in that direction. Hence the column is stiffer in its longer direction and it adds to the stiffness of the building in that direction which decreases the time period of the building in that direction.
Thus, after increasing the stiffness of the columns in the X direction, (Building C w.r.t. building B) the time period in the X direction decreased. And for the gross MOI case, the increase of stiffness in X direction even made the fundamental time period in X direction lesser than the fundamental torsional mode!
And when the stiffness in the Y direction was increased (Building D w.r.t building B) the fundamental mode in the Y direction became lesser than the fundamental mode in the X-direction. (The only building to have the first mode of vibration in the X direction)
By increasing the stiffness in a particular direction and decreasing the stiffness in the other direction (Building C and Building D), the overall displacements also decreased in the direction of increased stiffness and increased in the direction of decreased stiffness.
4. Effect of Flexural Stiffness of Structural Elements
As we decrease the flexural stiffness of the members, the building becomes flexible and hence has a greater time period.
As per IS 1893, we have to consider the effective stiffness of beams as 35% of the gross stiffness and the effective stiffness of columns as 70% of the gross stiffness. This increases the time period of the building.
When the effective stiffness is considered, the time period for each building is increased by approx. 1.5 times the time period when total stiffness is considered.
5. Effect of Axial Stiffness
Like how decreasing flexural stiffness increases the time period, the deduction in axial stiffness also has a similar effect.
For building H2, only 10% of the actual axial stiffness was considered which increased the time period of the building by about 25%.
6. Effect of degree of fixity at the column base
The fixed column prevents the rotation of the column at the base which adds to the stiffness of the building (like how a fixed beam is stiffer than a simply supported beam)
By providing fixed columns to Building H, (new building H1) the time period decreased by about 10% but moreover, the deformations were decreased by 3 times as shown in the figure above (deformation of building H and building H1)
`bb"B. Effect of Mass"`
As the mass increases, the time period increases. (Time period is directly proportional to the square root of the mass)
1. Effect of increase in live load
As the live load was increased by 10 and 20 percent for Building H (new Building J and K), the time period increased slightly.
Live load contributes only 25% to the mass of the building as per IS 1893 (which is because the building may not be loaded fully during an earthquake and moreover the live load can slide on the floor during an earthquake and not move along with the building, thus imparting less inertial forces). Hence increase in live load doesn’t have a significant effect on the time period of the building.
2. Effect of different column dimensions
Comparing buildings E & F and buildings G and H, when the column sizes were increased the time period increased! Even though increasing column sizes increases stiffness which should actually reduce the time period.
This is firstly because the column sizes of upper stories were increased whereas if we notice the modal shape of vibration, bottom stories have the highest floor deformation and the top stories have very less floor deformations. Thus, increasing the column sizes of the bottom stories will have more effect on the time period compared to increasing the column size of the top stories.
Secondly, the mass of the top stories is more critical than the mass of the bottom stories like how in a rotatory motion, the father is the mass, more influence it has on the overall inertia.
It can be understood as increasing the depth of the cantilever at the free end instead of increasing the depth at the support. This will only result in increased weight instead of increased strength or stiffness.
`bb"C. Other Notes"`
1. The earthquake forces are lesser for greater time periods. And it can be observed that the time periods obtained from modal analysis (considering eff. stiffness) are quite larger than the approximate time periods as per IS 1893.
Also, the modal mass is about 80 - 85 percent in the fundamental modes of vibration i.e., the first mode of vibration will have a major contribution to the overall earthquake forces. (Modal mass values for eff. stiffness is similar to modal mass values for gross stiffness)
Hence for the given buildings, the Vb bar / Vb correction will be quite high
2. When the slabs are modelled using shell elements instead of membrane element, the stiffness of beams increases due to the T/L flange provided by the slab as shell elements can also take bending moments while membrane can only take axial forces (thus membrane only provides the diaphragm effect to the building). This also thus decreases the time period of the building.
`bbb"7. CONCLUSION"`
Buildings with various structural configurations were analyzed considering gross moment of inertia of the sections as well as considering effective moment of inertia of the sections and their respective modal behavior was obtained. Thus the concepts of factors determining the time period of the building were thus verified.