Project 1_Comparative study of different storey buildings for Seismic forces
AIM: create a design and analysis of a 25-story building using Etabs software and find the natural time period, shape of oscillations, etc.
PROCEDURE:
open a new modal and set custom grids and floors
add plinth level as 1.5m and each floor is 3m 2 storey building modal-A
define the properties and section of the frame with column size 400x400mm, beam 300x400mm
floor thickness is 150mm, concrete properties define M30 and steel is 415 HYSD bars.
weight assign dead load is 1 and service load is 0.25 wall 1
modal A- 2-storey building: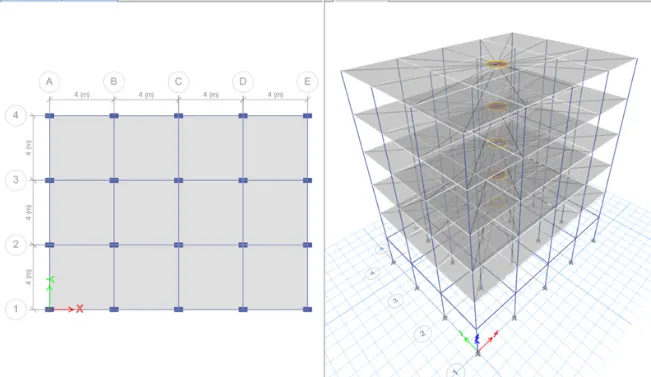
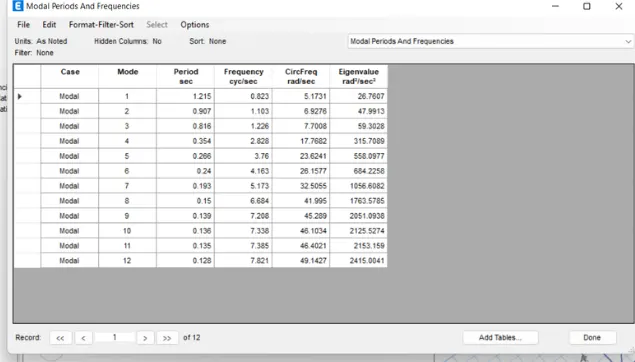
modal-B: 5 storey building
save the previous modal as modal-B and adjust the floor up to 5 floors
make similar to the floor one
and live load, wall load, mass source
run the analysis
Impose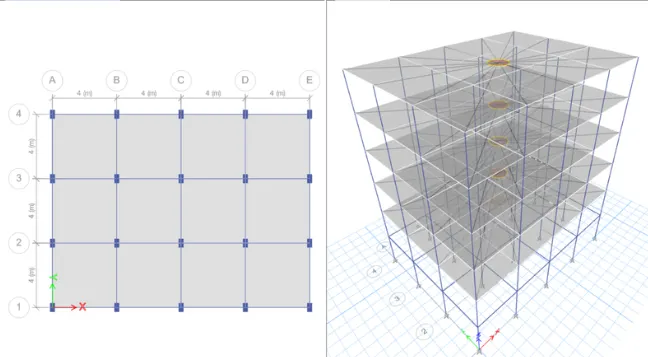
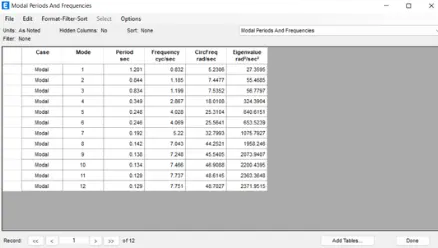
modal-c:
the post size is different 550mmx300mm
edit the properties of the column itself and run the analysis and place the column in the x-direction orientation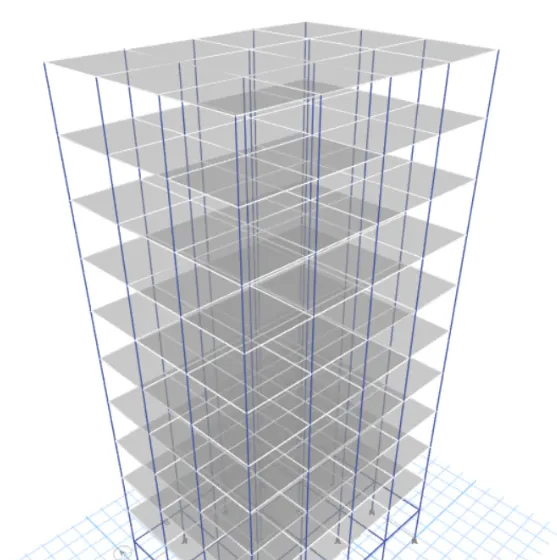
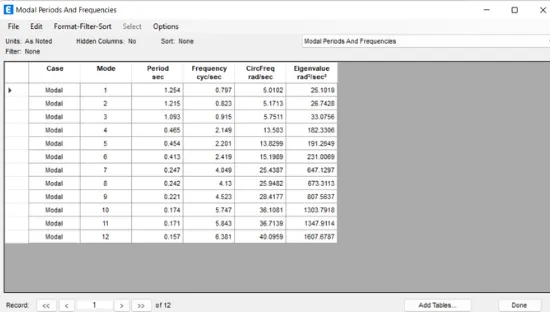
modal-D The column size is different 300x550mm and the direction is placed in the y direction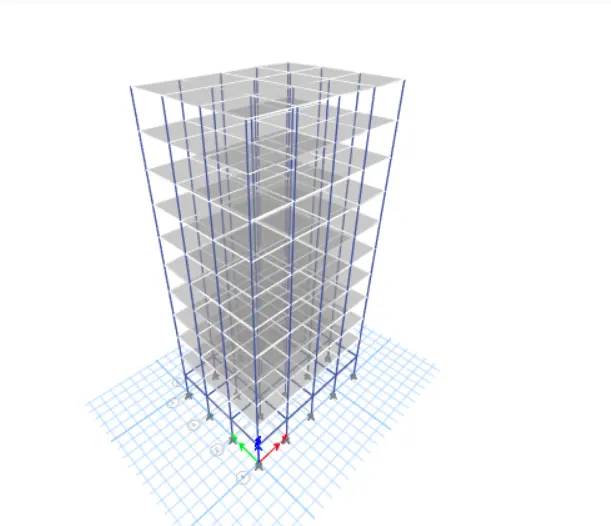
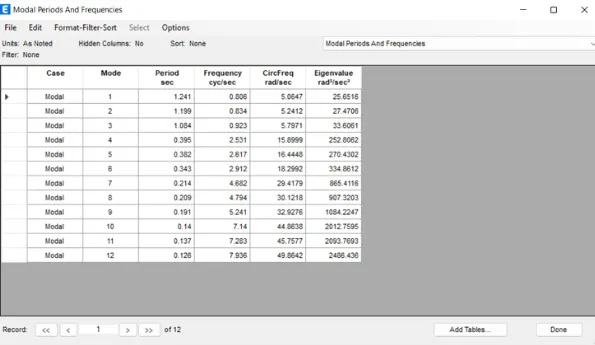
modal-E: 10-story building with different column sizes, the top 5 floors are 400x400 mm and the bottom is 600x600 mm
edit the column properties and add a new column with dimensions of 400x400 mm
and set the building visibility range to 6-10 and hide the beam and floors
select all columns and assign 400x400mm column and display all floors and run analysis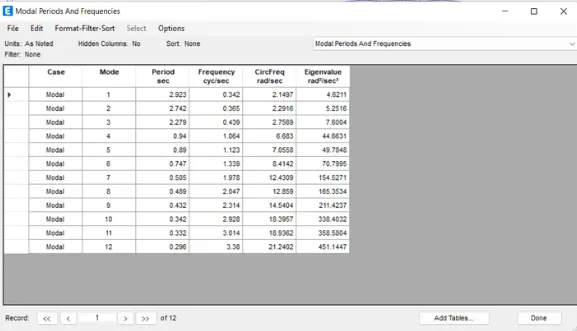
modal-F
the dimensions of the columns are uniform 600x600mm
select the highest floor as 6 to 10 and hide the beam and floor
select all columns and assign a column and run the analysis
modal-G:
A 25-story building with different column sizes along the building height
upper floor 5-400x400mm
middle floors 10-600x600mm
lower -Floor- 10-800x800m
edit floor add 15 floors and set similar floor -1
hide beams and floors
define section frames add column size is 800x800 mm
select the building extent display option and set the lower floor to 10 upper and lower floors
select all columns, assign column 800x800mm
select middle 11-20 stores assign column 600x600mm
the upper 5 floors are 400x400mm
add live load on floors 3 kn/m^2, wall load is 10 kn/m
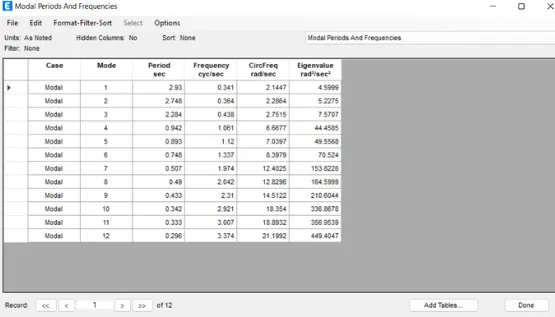
add the membrane and run the analysis
modal -H
modal -H as 25 The storey column is uniform along the height of the building
the dimension of the column is 800 x 800 mm
select all columns and assign column 800x800mm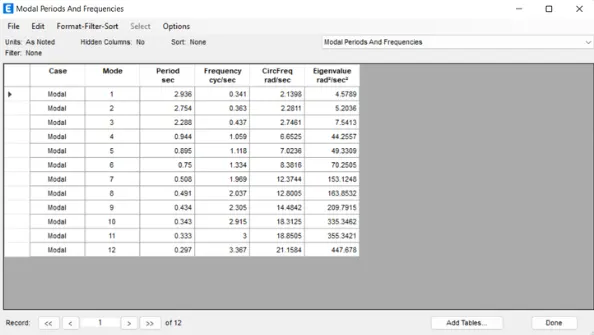
modal -j
is only increase in live load on each floor is 10%
3.3 kn/m^2 is used and a modal analysis is performed
modal-k
is also increased by 20% of the payload and applied
and run the modal analysis
RESULTS:
i)COMPARISON:
(a) Effect of stiffness on the time period between building E and building F:
Building E (This is a 10-story building with different column sizes):
Modal frequency and analysis: 2.74 s
Building F (this is a 10-story building with the same size columns):
Modal frequency and analysis: 2.79 s.
(b) Effect of stiffness on the time period between building G and building H:
Building G (25-story building with different column sizes):
Modal periods and frequencies: 6.66 s.
Building H (25 story building with the same column size):
Modal periods and frequencies: 7.07 s.
- If we compare the above buildings with different column sizes and different column sizes of 10-story buildings, we can see that there are large differences between their modal periods and frequencies.
- But if we see building G and building H with different column sizes and with the same column sizes as the 25-story building, we can see that building G with different column sizes is more stable than building H with the same column sizes.
- Because with the same column sizes, the mass is concentrated in the upper floors. And the weight is directly proportional to the lateral load acting on the building, which causes more lateral displacement of the building, resulting in a longer period of time.
(ii) COMPARISON:
(a) Effect of MASS on the time period between building H, building K, and building J:
Building H (25-story building with the same size columns with a useful load of 3Kn/m2):
Modal periods and frequencies: 7.07 s.
Building J (25-storey building with a useful load of 3.3 kn/m2):
Modal periods and frequencies: 7.09 s.
Building K (25-storey building with a useful load of 3.6 kn/m2):
Modal periods and frequencies: 7.10 s.
- As we can see after observing their modal periods and frequencies of these three buildings, we observe that there is not much difference between the time periods of these buildings.
- We have an even load, so there is a difference, but not that big.
(iii) COMPARISON:
(a) Effect of building height on the time period between Building A, Building B, Building F, and Building H:
Building A (this is a 2-story building):
Modal periods and frequencies: 0.68 s.
Building B (it is a 5-story building):
Modal periods and frequencies: 0.78 s.
Building F (This is a 10-story building):
Modal periods and frequencies: 2.79 s
Building H (it is, among other things, a 25-story building):
Modal periods and frequencies: 7.07 s.
- After observing the modal periods and frequencies of the given buildings, we can say that the time period increases with the increasing height of the building.
- It is obvious that if the height of the building increases, the time periods of the building also increase. It can be said that the height of the building is directly proportional to the time period according to the IS code, so the construction time increases with the height.
(iv) COMPARISON:
(a) Effect of column orientation on the time period between Building B, Building C, and Building D:
Building B (This is a 5-story building with column dimensions of 400X400 mm):
Modal periods and frequencies: 0.78 s.
Building C (This is a 5-story building with column dimensions of 550X300 mm, which is oriented in the X direction):
Modal periods and frequencies: 0.87 s.
Building D (This is a 5-story building with column dimensions of 300X550 mm, which is oriented in the Y direction):
Modal periods and frequencies: 2.74 s.
- For building B, we have the same 400X400mm column size throughout the building, so the response of the building in each direction should be similar. Due to the same size of the columns in both directions i.e. X and Y direction.
- For building C we have larger size of columns in X direction i.e. 550X300mm and for building D we provide larger size of columns in Y direction i.e. 300X550mm, that means floor deflection will be higher in building D than in building C.
(v) COMPARISON:
(a) Effect of flexural stiffness of structural elements on the shapes of building B shape:
Flexural stiffness of structural elements on mode shapes:
Bending stiffness of beams close to zero (zero inertia): 2.74 s.
Full bending stiffness of the beam: 0.78 s.
- From the above observation, we can see that if we do not consider the stiffness of the beam, we get more than double the actual time.
(vi) COMPARISON:
(a) Effect of axial stiffness of vertical members on building shape shapes H:
The axial cross-section for columns is close to NIL:
Modal periods and frequencies: 8.14 s.
Full axial section for columns:
Modal periods and frequencies: 7.07 s.
- After observing from the above, we can say that the axial stiffness plays an important role in the time period.
(vii) COMPARISON:
(a) Effect of degree of strength on column based on building mode shapes B:
Column supports are attached:
Modal periods and frequencies: 0.78 s.
Column supports are fixed:
Modal periods and frequencies: 0.75 s.
- From the above observation, we can conclude that the greater the column fixation, the shorter the time period and the less it will deviate.
- So the time period is shortened if the condition changes from pinned to fixed.