Project 1
AIM: - To create the state-flow chart or the Simulink for the given flow chart and plot with respective time for the fuel cell power, Battery power, and FC Operating state (running, standby).
ABSTRACT: -
The given flow chart which power demand as the input, according to the demand and the comparison with the fuel cell power range (maximum and minimum), the energy management system needs to decide the following operations that will provide power supply to the system.
- Use of Fuel cell system
- Use of Battery
CONSIDERATIONS: -
|
Input Power Demand |
Power supply from |
|
0-100 |
Battery |
|
101-1000 |
Fuel cell |
|
1001-1200 |
Battery |
The above table data explains that considering the range (Mini, Max) that Battery and Fuel cell can operate.
Using the State flow chart, with the above considerations of operation range will develop the given flowchart and plot the outputs.
Flow chart Explanation:
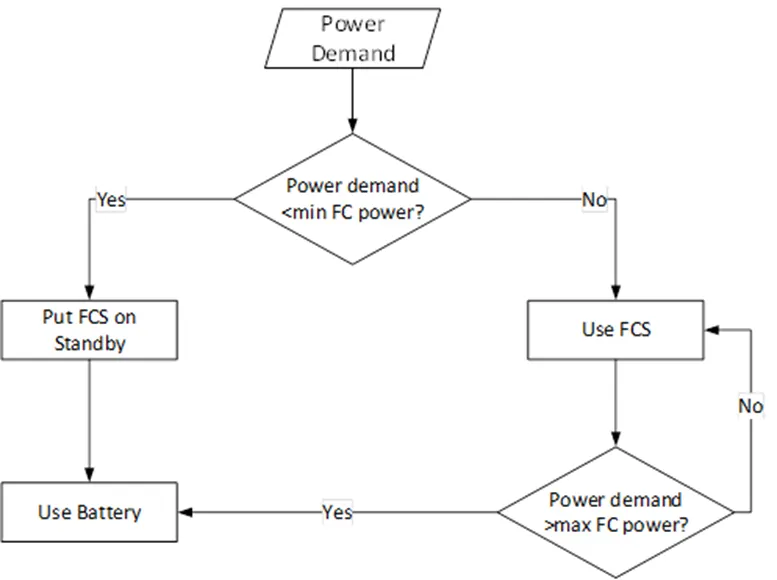
The given flow chart explains that if the input power demand of the system is less than the ‘min FC power’ then the input power demand must be satisfied by the Battery power system else by the fuel cell system. If the input power is beyond the ‘max FC power’ then the input power demand must be satisfied by the Battery power system. While the input power demand is in the minimum and maximum range of the fuel cell then the input power demand must be satisfied by the fuel cell power system.
State-Flow Chart:
Explanation:
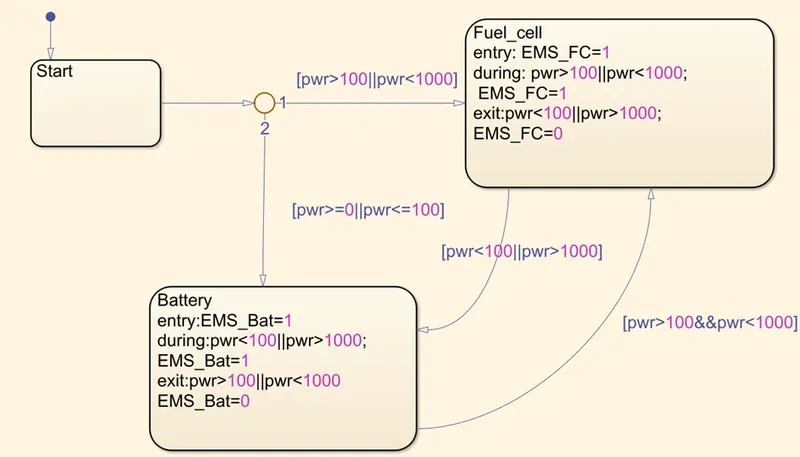
We have two states 1. Fuel cell, 2. Battery.
- When the input power demand is greater than 100 or less than 1000 then the State 1 fuel cell will be on and shown in the display as 1.
- When the input power demand is less than 100 or greater than 1000 then the State 2 Battery will be on and shown in the display as 1.
- When the EMS is in state 1 and the input power demand becomes less than 100 or greater than 1000 the state will jump to state 2.
- When the EMS is in state 2 and the input power demand becomes greater than 100 or less than 1000 the state will jump to state 1.
- When the input power demand is continuously in between the range of fuel cell (>100, <1000) then EMS is state 1 and is shown in the display as 1.
- When the input power demand is continuously outside the range of the fuel cell (>100, <1000) then EMS is state 2 and is shown in the display as 1.
Power_Demand_EMS Model
Block used in the Model
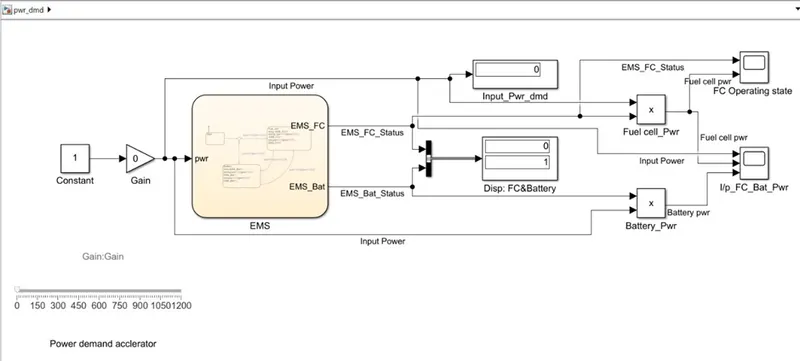
1. State flow chart: (EMS)Providing the instruction for the functioning of the model.
- Gain and Constant block: The constant block connected to the Gain block will receive the Input power demand from the accelerator.
- Horizontal slider: This block will work as a power demand accelerator and can vary the input power demand so that we can observe the change of states while simulation. The range is set between 0 to 1200. It is connected to the gain block which will pass the power demand value to the EMS.
- Bus Selector: This will receive the signals of the states/outputs from the EMS and will be kept in the single bus which will project the result in the Display.
- Display Block: To view the status of states and the input power demand value.
- Product Block: To get the power to provide the battery and fuel cell to project the desired outputs.
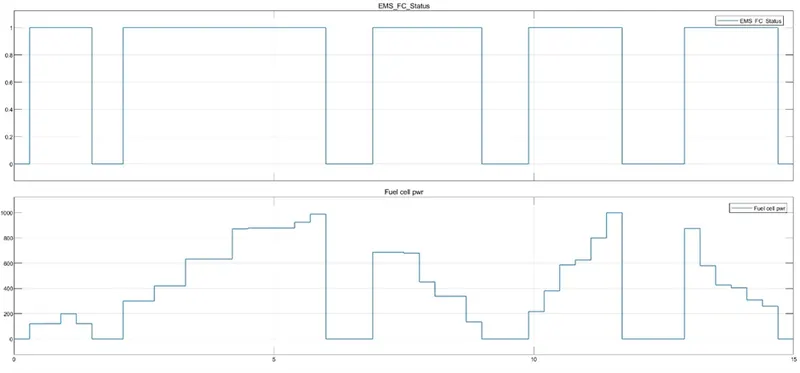
- Scope Block: To plot the fuel cell power, battery power, and the operating status of FC against the time.
Model Explanation:
- The input power demand by varying the slider the value will receive by the gain block which is the input of EMS. As per the instruction provided in the EMS the power supply will provide by either battery or fuel cell according to the input power demand.
- The status of the operation of the battery or the fuel cell can be viewed in the display, when the state status is On or in during it will display as 1, or else it will display 0.
- Run the simulation by slowing the pace by 0.1 times so that we can vary the power demand value smoothly.
- Accordingly, we will plot the outputs of fuel cell power, battery power, and the operating status of FC against the time.
Results:
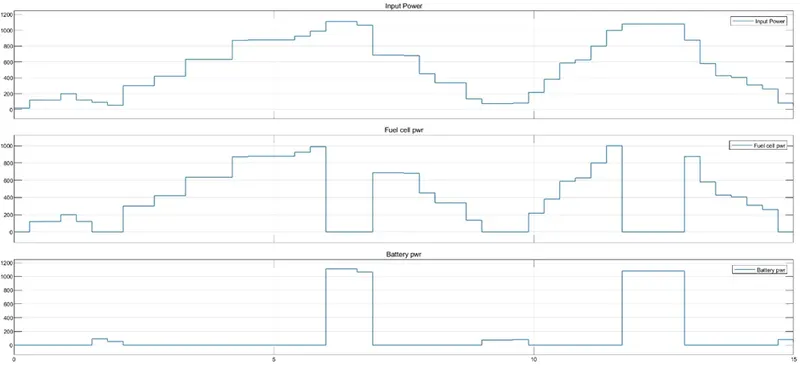
- Input Power, Fuel cell, and Battery Power
- FC operating status
Conclusion:
The Input power demand got managed by the EMS which is shared by Battey power and fuel cell power as per the instruction given in the flowchart.