Project 1
-- Data cleaning on Automobile 1985 dataset and perform descriptive analytics
I have worked on the dataset for conversion of raw data into a form that will make it easy to understand & interpret, ie., rearranging, ordering, and manipulating data to provide insightful information about the provided data.
The dataset is about cars from 1985, It consists of:
Number of Instances: 205
Number of Attributes: 26 total
15 continuous
1 integer
10 nominal
import pandas as pd
import numpy as np
import seaborn as sns
import matplotlib.pyplot as plt
import numpy as np
import seaborn as sns
import matplotlib.pyplot as plt
df = pd.read_csv('auto.csv')
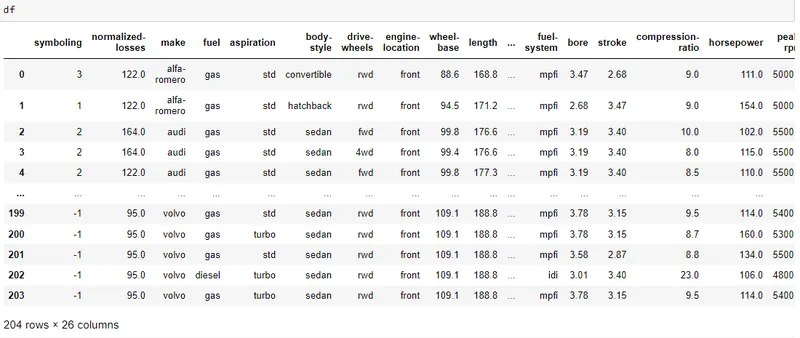
df
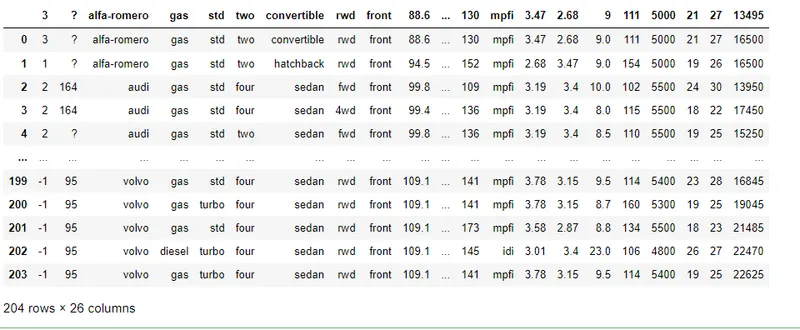
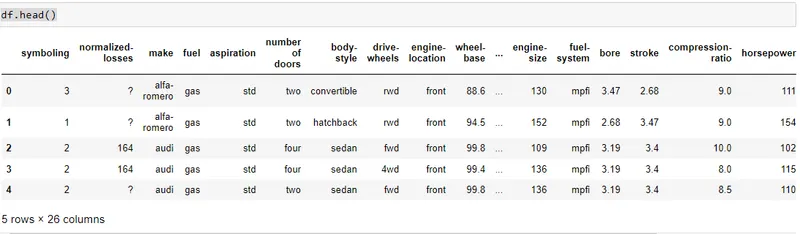
Renaming the columns:
df.columns = ["symboling", "normalized-losses", "make", "fuel", "aspiration", "number of doors", "body-style", "drive-wheels", "engine-location",
"wheel-base","length", "width", "height", "curb-weight", "engine-type", "num-of-cylinders", "engine-size", "fuel-system", "bore",
"stroke", "compression-ratio", "horsepower", "peak-rpm", "city-mpg", "highway-mpg", "price"]
"wheel-base","length", "width", "height", "curb-weight", "engine-type", "num-of-cylinders", "engine-size", "fuel-system", "bore",
"stroke", "compression-ratio", "horsepower", "peak-rpm", "city-mpg", "highway-mpg", "price"]
#Display the column names
print(list(df.columns))
print(list(df.columns))
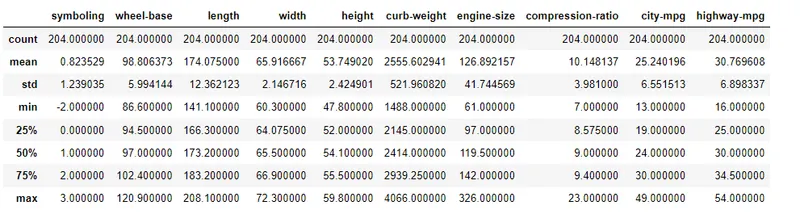
df.describe()
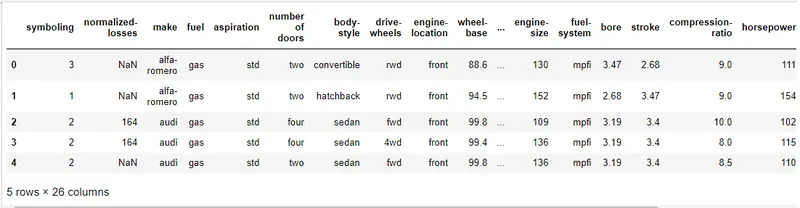
df = df.replace('?', np.NAN) # Replacing the empty(?) values with NaN.
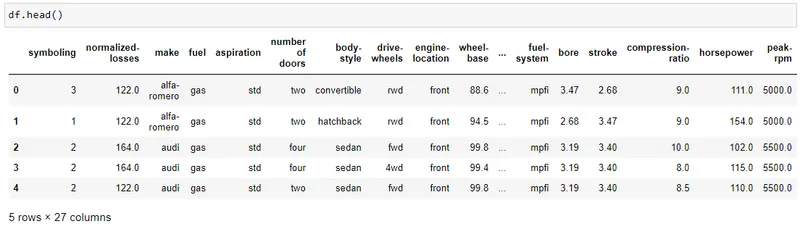
df.head()
df.isnull().sum()
symboling             0
normalized-losses    40
make                  0
fuel                  0
aspiration            0
number of doors       2
body-style            0
drive-wheels          0
engine-location       0
wheel-base            0
length                0
width                 0
height                0
curb-weight           0
engine-type           0
num-of-cylinders      0
engine-size           0
fuel-system           0
bore                  4
stroke                4
compression-ratio     0
horsepower            2
peak-rpm              2
city-mpg              0
highway-mpg           0
price                 4
dtype: int64


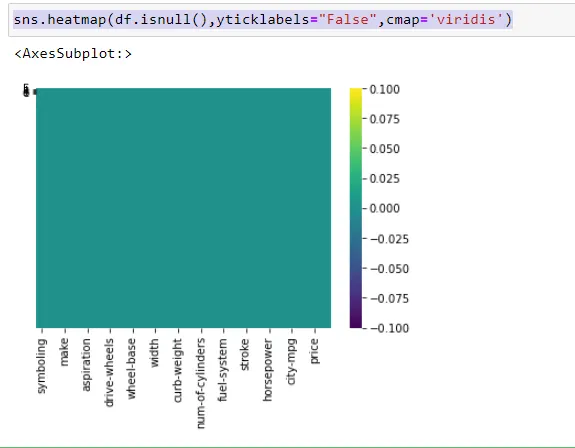
sns.heatmap(df.isnull(),yticklabels="False",cmap='viridis')


## Replacing NaN values with mean in each column
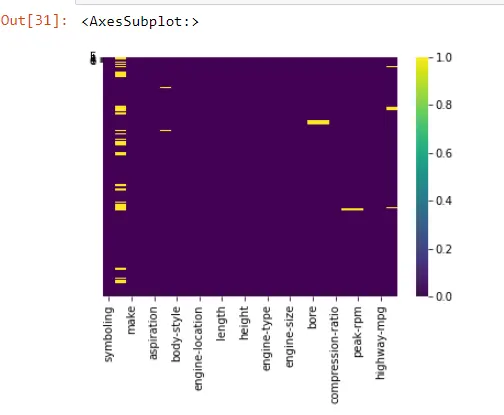
### Replacing the NaN values with mean for each column which has null values
df[["price"]]=df[["price"]].astype(str).astype(float)
mean = df[["price"]].mean(axis=0, skipna= True)
#print('mean value is: ',mean)
df[["price"]] = df[["price"]].replace(np.NaN, mean)
mean = df[["price"]].mean(axis=0, skipna= True)
#print('mean value is: ',mean)
df[["price"]] = df[["price"]].replace(np.NaN, mean)
df[["normalized-losses"]]=df[["normalized-losses"]].astype(str).astype(float)
mean = df[["normalized-losses"]].mean(axis=0, skipna= True)
#print('mean value is: ',mean)
df[["normalized-losses"]] = df[["normalized-losses"]].replace(np.NaN, mean)
mean = df[["normalized-losses"]].mean(axis=0, skipna= True)
#print('mean value is: ',mean)
df[["normalized-losses"]] = df[["normalized-losses"]].replace(np.NaN, mean)
df[["bore"]]=df[["bore"]].astype(str).astype(float)
mean = df[["bore"]].mean(axis=0, skipna= True)
#print('mean value is: ',mean)
df[["bore"]] = df[["bore"]].replace(np.NaN, mean)
mean = df[["bore"]].mean(axis=0, skipna= True)
#print('mean value is: ',mean)
df[["bore"]] = df[["bore"]].replace(np.NaN, mean)
df[["stroke"]]=df[["stroke"]].astype(str).astype(float)
mean = df[["stroke"]].mean(axis=0, skipna= True)
#print('mean value is: ',mean)
df[["stroke"]] = df[["stroke"]].replace(np.NaN, mean)
mean = df[["stroke"]].mean(axis=0, skipna= True)
#print('mean value is: ',mean)
df[["stroke"]] = df[["stroke"]].replace(np.NaN, mean)
df[["horsepower"]]=df[["horsepower"]].astype(str).astype(float)
mean = df[["horsepower"]].mean(axis=0, skipna= True)
#print('mean value is: ',mean)
df[["horsepower"]] = df[["horsepower"]].replace(np.NaN, mean)
mean = df[["horsepower"]].mean(axis=0, skipna= True)
#print('mean value is: ',mean)
df[["horsepower"]] = df[["horsepower"]].replace(np.NaN, mean)
df[["peak-rpm"]]=df[["peak-rpm"]].astype(str).astype(float)
mean = df[["peak-rpm"]].mean(axis=0, skipna= True)
#print('mean value is: ',mean)
df[["peak-rpm"]] = df[["peak-rpm"]].replace(np.NaN, mean)
mean = df[["peak-rpm"]].mean(axis=0, skipna= True)
#print('mean value is: ',mean)
df[["peak-rpm"]] = df[["peak-rpm"]].replace(np.NaN, mean)
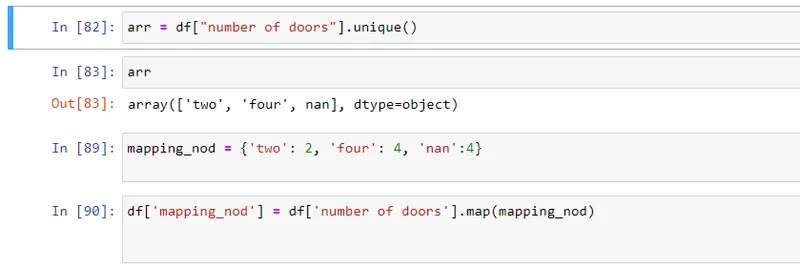
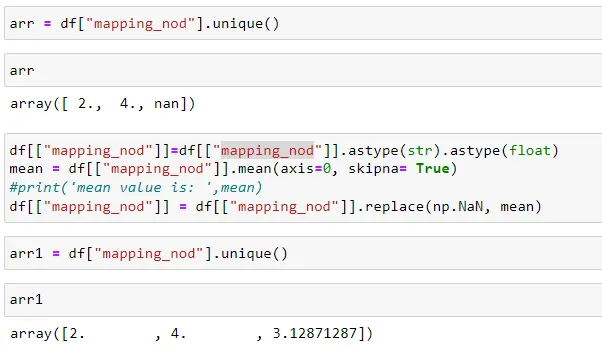
### Here in "number of doors" columns there is string values which needs to be replaced by integers using a mapping function
df=df.drop(['number of doors'],axis=1) #Drop the column of "number of doors"
print(df.info())
<class 'pandas.core.frame.DataFrame'>
RangeIndex: 204 entries, 0 to 203
Data columns (total 26 columns):
 #   Column             Non-Null Count  Dtype
---  ------             --------------  -----
 0   symboling          204 non-null    int64
 1   normalized-losses  204 non-null    float64
 2   make               204 non-null    object
 3   fuel               204 non-null    object
 4   aspiration         204 non-null    object
 5   body-style         204 non-null    object
 6   drive-wheels       204 non-null    object
 7   engine-location    204 non-null    object
 8   wheel-base         204 non-null    float64
 9   length             204 non-null    float64
 10  width              204 non-null    float64
 11  height             204 non-null    float64
 12  curb-weight        204 non-null    int64
 13  engine-type        204 non-null    object
 14  num-of-cylinders   204 non-null    object
 15  engine-size        204 non-null    int64
 16  fuel-system        204 non-null    object
 17  bore               204 non-null    float64
 18  stroke             204 non-null    float64
 19  compression-ratio  204 non-null    float64
 20  horsepower         204 non-null    float64
 21  peak-rpm           204 non-null    float64
 22  city-mpg           204 non-null    int64
 23  highway-mpg        204 non-null    int64
 24  price              204 non-null    float64
 25  mapping_nod        204 non-null    float64
dtypes: float64(12), int64(5), object(9)
memory usage: 41.6+ KB
None
In [115]:
df.isnull().sum()
symboling            0
normalized-losses    0
make                 0
fuel                 0
aspiration           0
body-style           0
drive-wheels         0
engine-location      0
wheel-base           0
length               0
width                0
height               0
curb-weight          0
engine-type          0
num-of-cylinders     0
engine-size          0
fuel-system          0
bore                 0
stroke               0
compression-ratio    0
horsepower           0
peak-rpm             0
city-mpg             0
highway-mpg          0
price                0
mapping_nod          0
dtype: int64


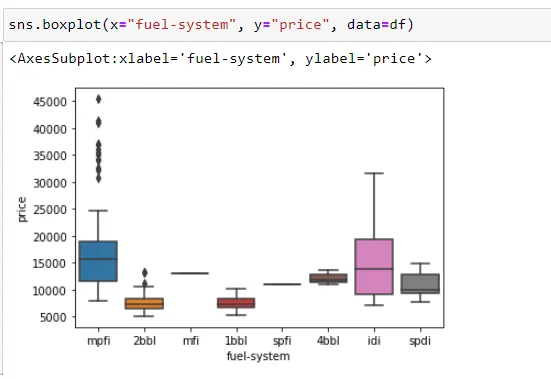
## Exploratory Data Analysis (EDA)
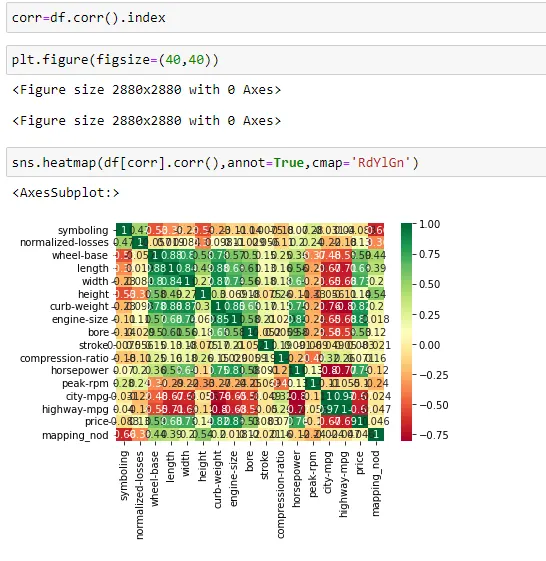
## Heat map
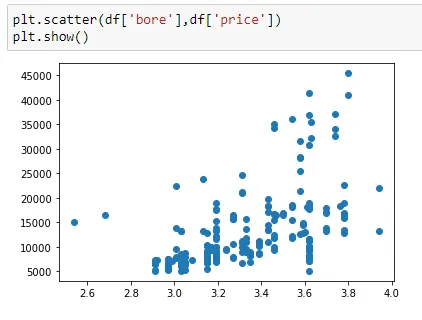
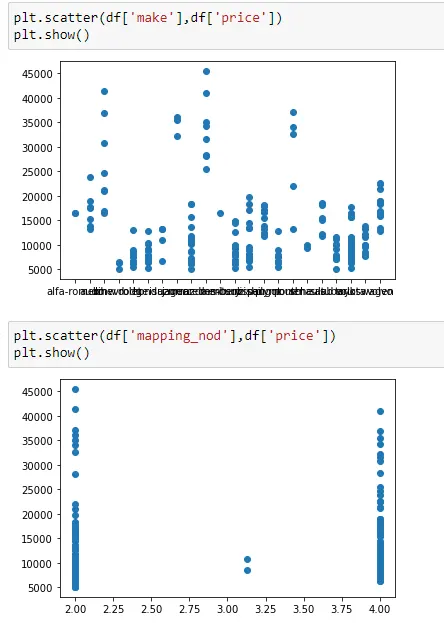
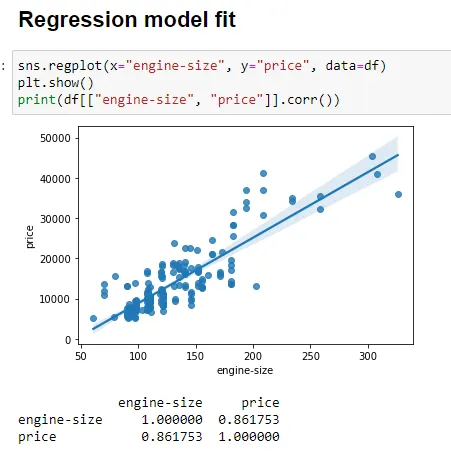
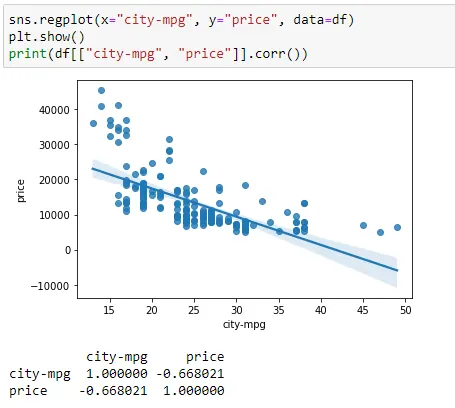
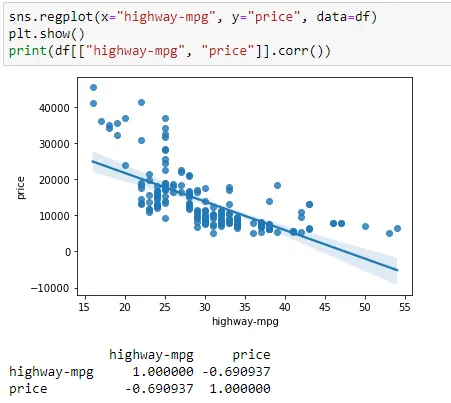
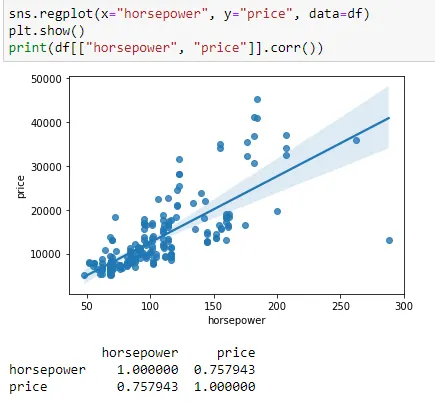
## Scatter plots