Project 1
Create a stateflow or Simulink model for the following flowchart.
Load the .mat file into the workspace.
The input to the model would be the power demand.
The output should be:
- Fuel cell power
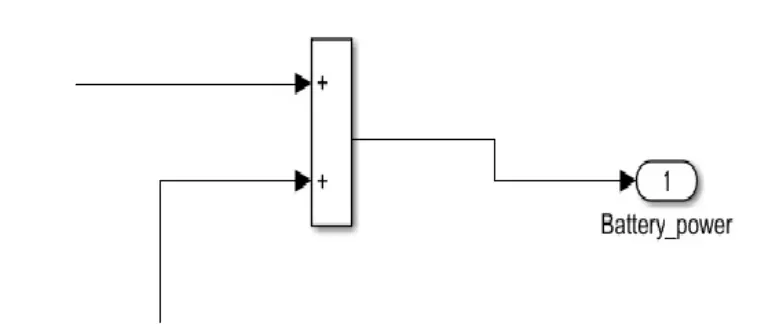
- Battery power
- FC Operating state (running, standby)
Create plot of these outputs against time.
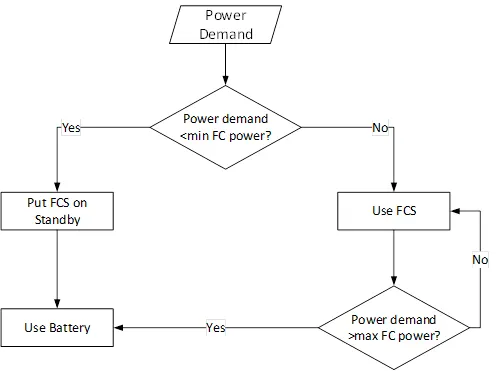
(Note- The simulink model file should be compulsorily attached)
Ans:
Objective:
To create a stateflow or simulink model for the flow chart and to plot the graph for the Fuel cell power,Battery Power,Fuel Cell operating state(running , Standby).
To model the flow chart we have to assume the maximum and minimum value of the power demand for fuel cell and the battery.The minimum power demand is considered as 100W and Maximum Power Demand is considered 1000W.The 100 W and 1000W is power demand is suppiled by the Fuel Cell and the other demand is suppiled by the battery.
Power Demand Suppiled by
0-100 Battery
101-1000 Fuel Cell
1001-1200 Battery
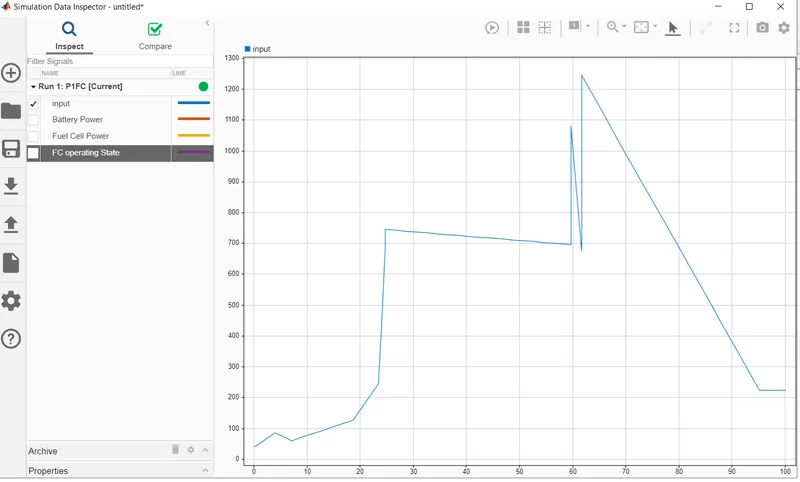
For the power demand 1200 the signal is created in the signal builder block
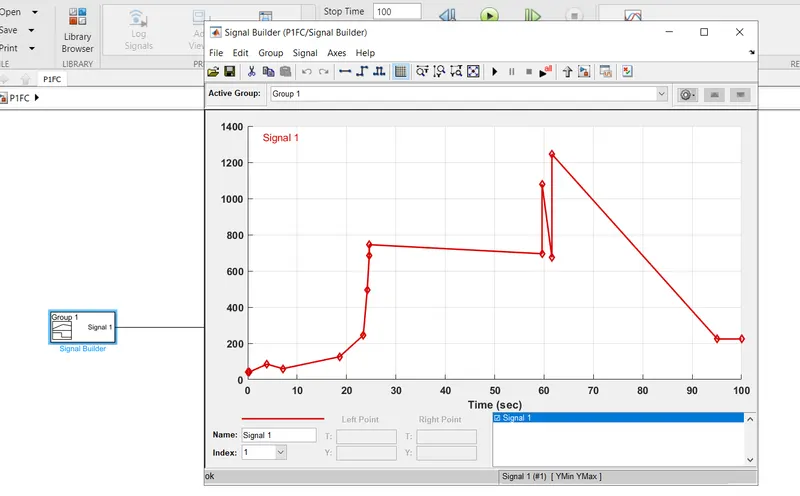
The nodes can be varied by clicking and and dragging is required.
A simulink can be done by using the following blocks
1.Interval test
2.Scope
3.Constant
4.Signal Builder
5.Constant
6.Sum
Steps for creating simulink model
Step 1:Place the signal builder block and create the signal for the power demand.
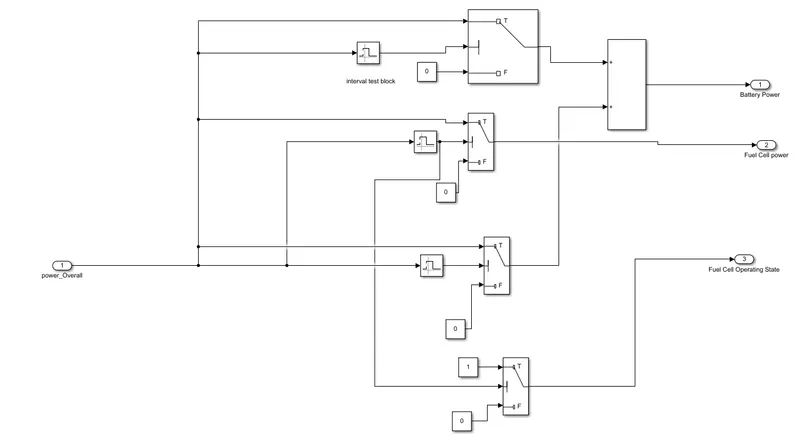
Step 2:Interval Test block create maximum and minimum value will be suppiled by the battery
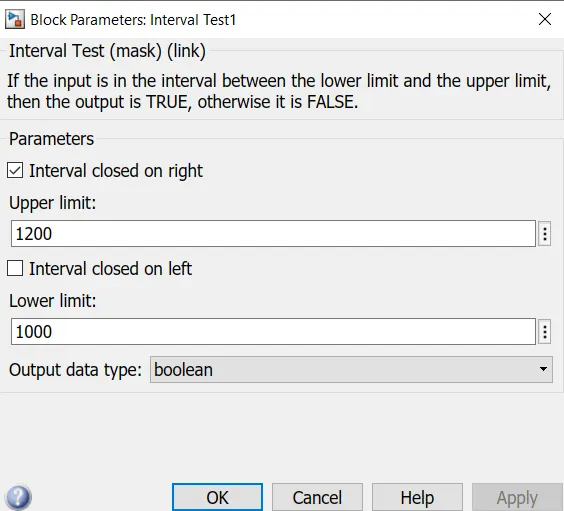
Step 3:
Use the Switch and make the power demand limit
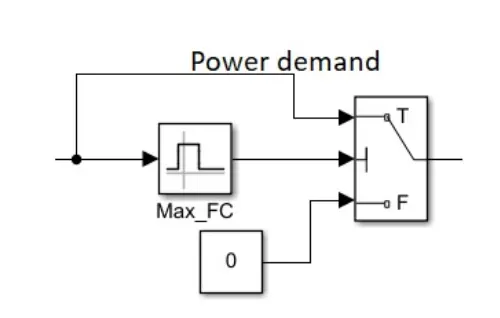
Step 4:
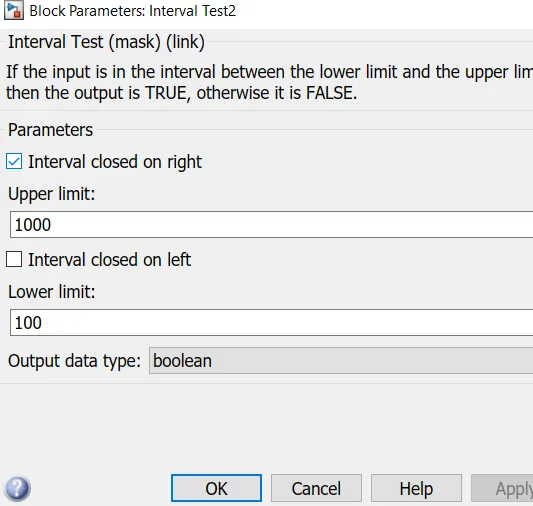
Interval Test block create maximum 1000 and minimum value 100will be suppiled by the battery
Step5:
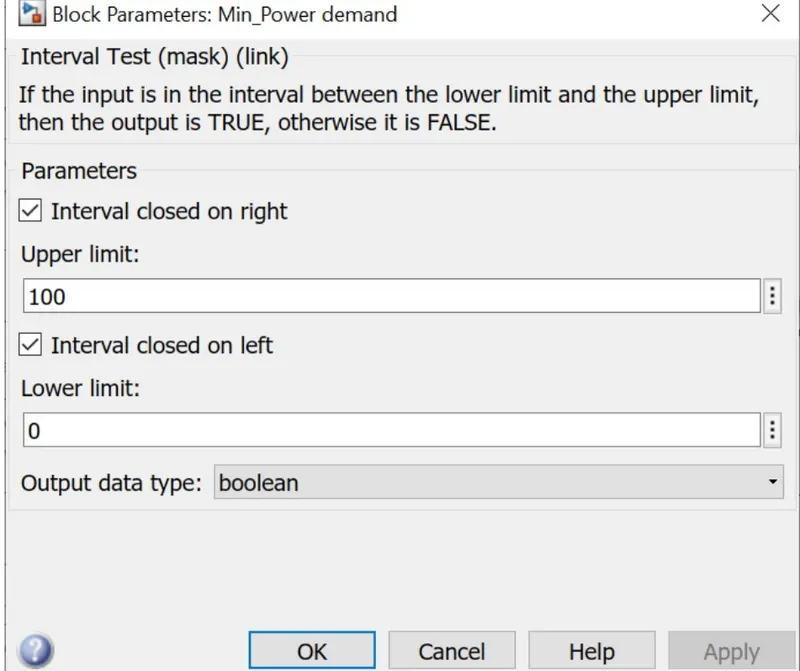
Interval Test block create maximum 100 and minimum value 0will be suppiled by the battery
Step6:
Step7
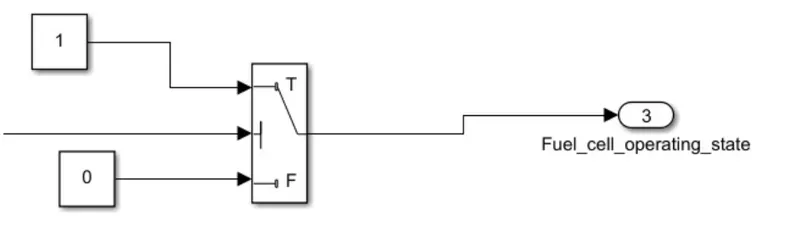
In this block the power is between 100 to 1000 output from the switch from 1 ON state and 1000 to 100 will be OFF State.
The Overall Block diagram
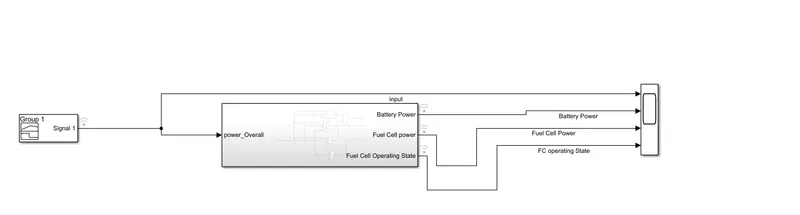
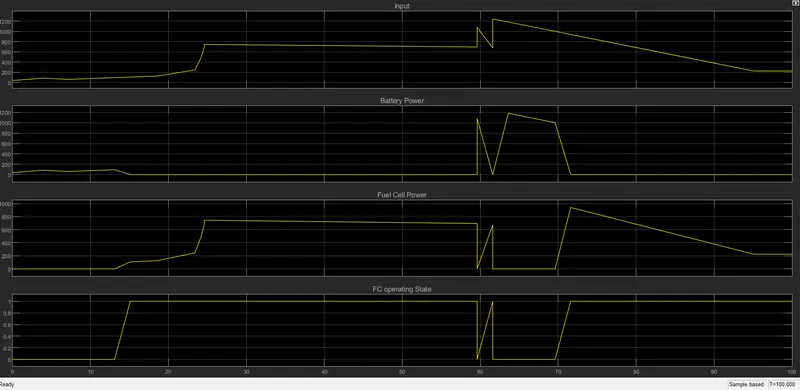
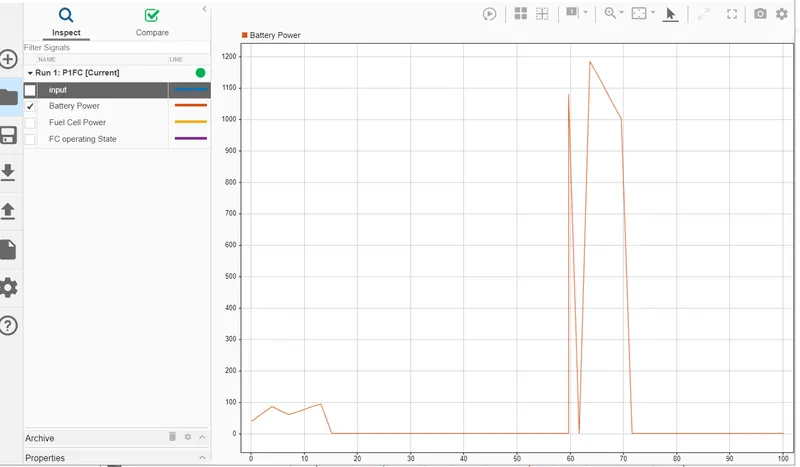
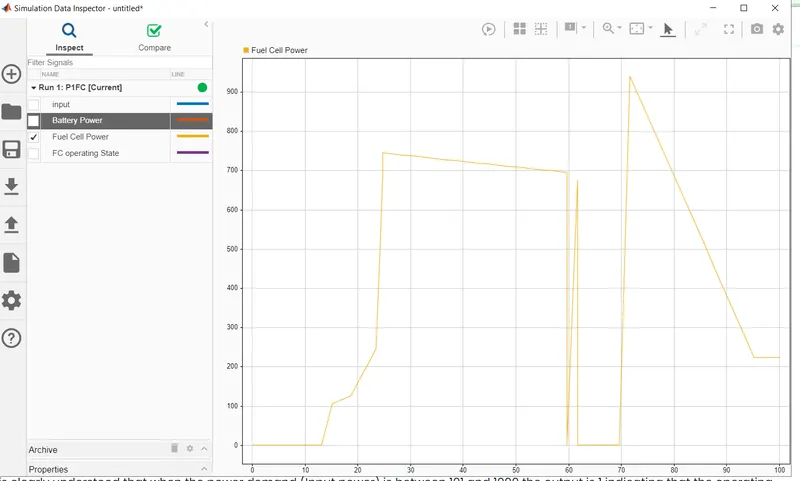
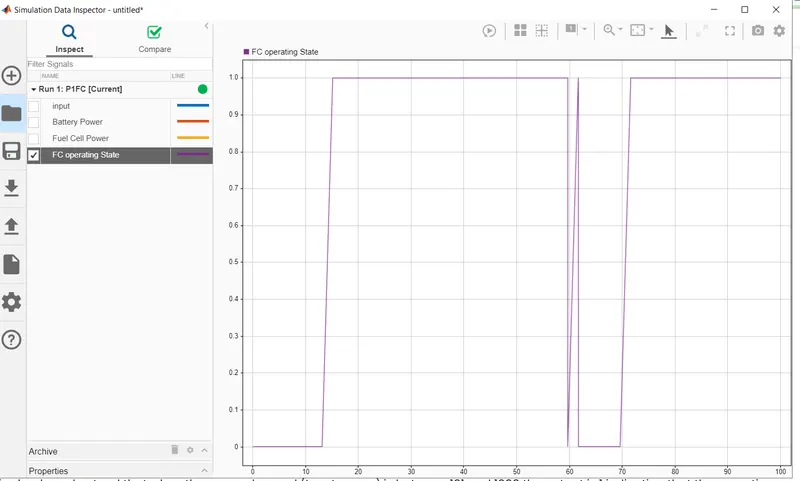
Result :Any Power drawn below 100 and above 1000 is suppiled by the battery.The basic power demand is suppiled by the fuel cell 101 to 1000.
The Fuel Operating State is 1 is ON and 0 is OFF