Project 1
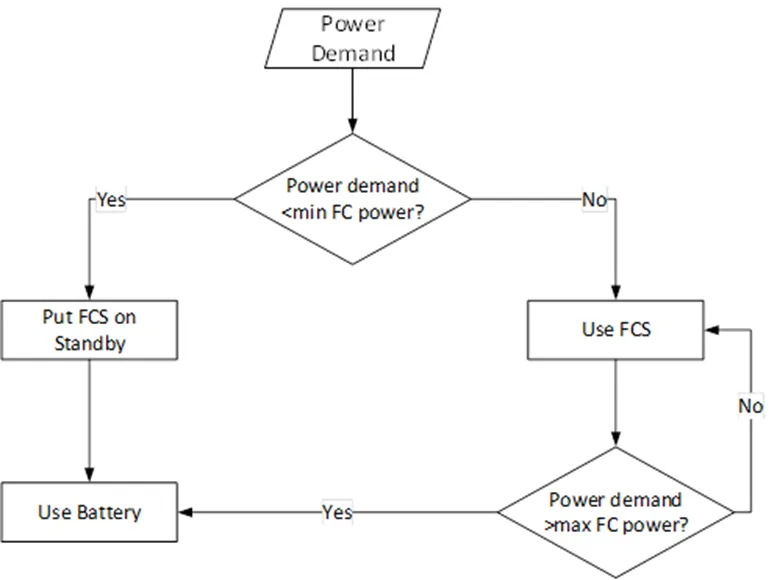
Create a stateflow or Simulink model for the following flowchart.
Load the .mat file into the workspace.
The input to the model would be the power demand.
The output should be:
- Fuel cell power
- Battery power
- FC Operating state (running, standby)
Solution:
Based on the given input to create the Simulink, the logic analysis is required.
Steps:
- If the power Demand is less than the Min Fuel Cell power, then battery is in operating mode and Fuel cell status is standby
- If the power demand is more than the Min fuel Cell power then the Fuel cell operates and Fuel Cell status is running mode.
- If the power demand is more than the max fuel cell power then the battery operates and Fuel Cell status is standby mode.
To work on this logic, the power demand is assumed in different stages.
|
Power Demand |
Operating energy source |
|
0 to 1000 w |
Battery |
|
1001w to 9000w |
Fuel Cell |
|
9001w to 10000w |
Battery |
The Simulink model is as shown below:
Power Demand is shown using the signal Builder block in the Simulink:
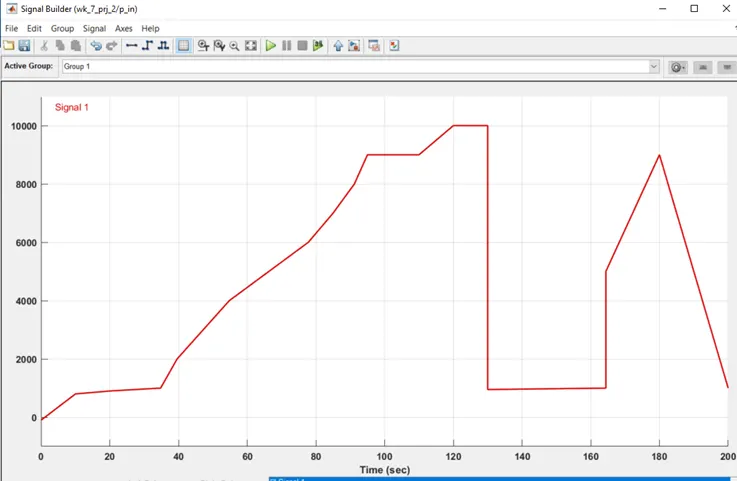
The signal is taken for 200 Seconds of time. In which,
|
Time |
Operating energy Source |
|
0-34.8s signal is in 0 to 1000 w zone |
Battery |
|
34.8 to 110s signal is in 1000w to 9000w zone |
Fuel Cell operates |
|
110s to 130s signal is in 9000w to 10000w zone |
Battery operates |
|
130s to 164.4 s signal is in 0 to 1000w zone |
Battery operates |
|
164.4s to 200s signal is in 1000 w to 9000w zone |
Fuel cell operates. |
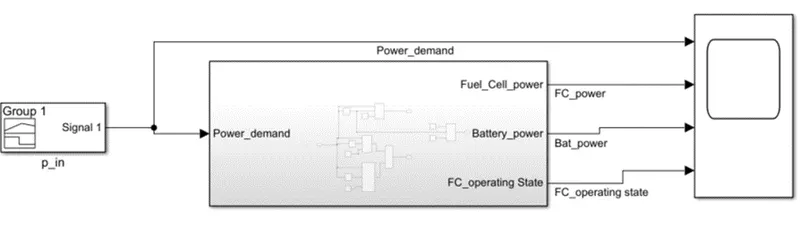
Signal builder is connected to the subsystem which takes the input from power demand and output is the signal either through the fuel cell or the battery and the status of the fuel cell.
Simulink Model:
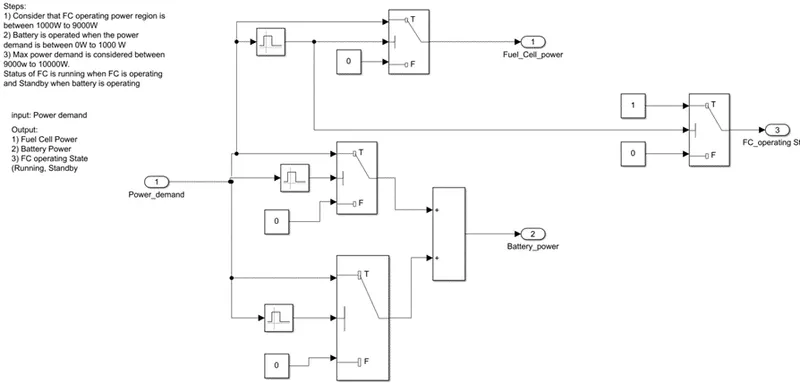
Inside the Power-demand Subsystem:
Steps in creating the Simulink model:
- Power demand is created using the signal builder block.
- Outputs required are Battery power, Fuel cell power, Fuel cell status. To develop them the switch logics are created.
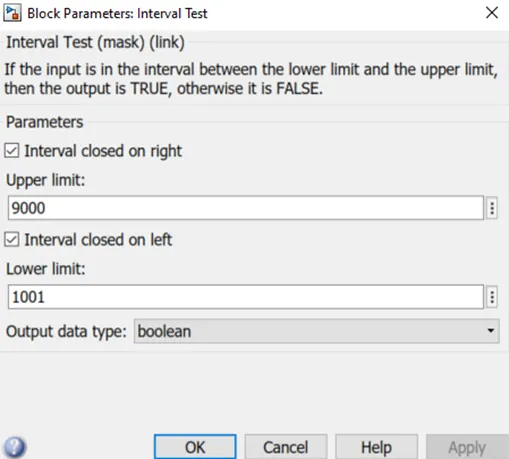
- Interval test block is taken to create the limits for the battery, and fuel cell output’s purpose.
Fuel cell Power limits:
Battery_power_limits:
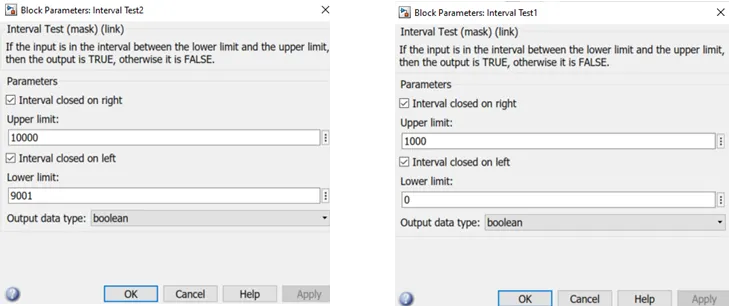
- Interval test inputs are given to the switches by setting the limits as > threshold.
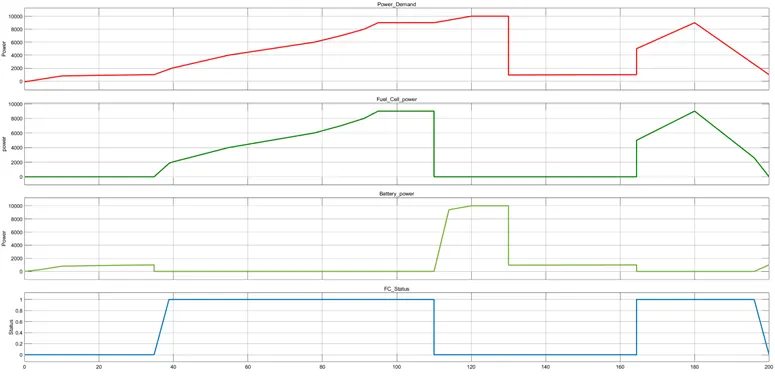
Now the Simulink model is saved and run the simulation by connecting the output ports of the sub-system to the scope.
Scope output:
Conclusion:
As per the time zones analysed in the above table,
|
Time inputs as per signal builder block |
Operating energy Source estimation |
Operating source |
Fuel Cell Status |
|
0-34.8s signal is in 0 to 1000 w zone |
Battery |
Battery |
Fuel cell standby |
|
34.8 to 110s signal is in 1000w to 9000w zone |
Fuel Cell operates |
Fuel Cell |
Fuel cell running |
|
110s to 130s signal is in 9000w to 10000w zone |
Battery operates |
Battery |
Fuel cell standby |
|
130s to 164.4 s signal is in 0 to 1000w zone |
Battery operates |
Battery |
Fuel cell standby |
|
164.4s to 200s signal is in 1000 w to 9000w zone |
Fuel cell operates. |
Fuel cell |
Fuel cell running |