Project 1
Aim :
To develop a forward energy based fuel consumption model of a conventional vehicle in MATLAB and simulink.
Objective :
- Understand the concept of forward energy based fuel consumption model of a conventional vehicle.
- To understand the functioning various vehicle componets including engine, torque converter, transmission system, longitudinal dynamics, etc.
- Development of a Matlab script used to load all the variables required for running the Simulink model.
- Development of the simulink model of the vehicle.
- Development of a MATLAB script to do some basic post-process calculations and generate results and plots.
- Analyzing the results.
Theory :
Energy based models-Model structure :
There are two basic types of structure for the energy-based ,models.
1) Forward Model : Dynamic simulation of the system.
2) Backward Model : Quasi-Static simulation of the system.
Forward models simulate from source to sink, that is from the input to the engine to the wheels, in order to assess vehicle performance.
Backward models simulate from the source to the sink, so, the input is the vehicle speed and acceleration, and the engine input is calculated backwards.
Forward- facing vehicle simulation :
One dimensional powertrain simulation used for a dynamic concept assessment and controller development. This simulation priciple is commonly referred to as forward- facing simulation as shown in figure. A drive cycle in terms of vehicle speed is often used as a reference for a driver model to track. For on-road vehicles the load model is usually in terms of a fixed vehicle mass subjected to gravitational forces, areodynamic drag and rolling resistance. A driver model can in its simplest form ba a simple PI controller tracking a speed reference. For off road working machines with additional power consumers, the load and operator can be much more complex to model.

The detail level of the component models is usually higher than in backward-facing simulations and include fundamental dynamic characteristics. For instance, a model of a hydrostatic transmission can be expanded to consider control unit and swash plate dynamics, oil compressibility and mechanical inertias, but without including detailed effects such as pressure fluctuation due to the individual piston motions. In general forward-facing simulation includes more system states and is conducted with small time steps. The execution time is therefore also longer. With forward-facing simulation, critical control aspects can be investigated and used for concept scoring, such as mode shifting and pump/motor displacement control.
Backward-facing vehicle simulation :
A widely used simuation principle for the preliminary sizing is Quasi-static backward facing simulation. The principle is based on a pre-defined drive cycle that is prescribed to the vehicle power output as shown in figuere. The required operation of each component is then sequentically calculated backwards in order to fulfil that cycle. The final step in the calculation is commonly to summarise the power load on the engine and drive the fuel consumption through a map of the Brake Specific fuel consumption. No driver model is thus needed and potentially a very simple load model as well. This in particular can be useful in off-road working machines with varying ground conditions and interaction with for instance a gravel pile, which needs a relatively complex model to accurately predict the wheel counterforce.
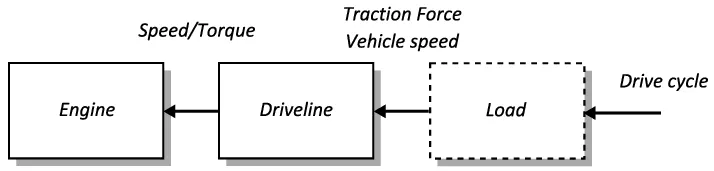
A pre-recorder cycle in terms of vehicle speed and tractive force can be used instead. The models are often based on static equations and efficiency maps, similar to the detail level described in the previous section. The models are typically simulated with few system states and with large time steps, which make the execution time very short. This type of simulation is useful in the preliminary sizing and selection since exactly the same performance is achieved in every simulation. Backward-facing simulations are therefore also ideal for simulation based design optimisation.
Powertrain sizing :
Based on the individual power requirement for the drive cycle, effect of areodynamic drag, rolling resistance and inertial component can be analyzed. High power is required to sustain high vehicle speeds, due to the increasing drag component. From the overall power plot, the maximum positive power is the power that needs to be procided at the wheels by the powertrain to complete the cycle. This sets the minimum powertrain sizing requirement. Additionally, if all the potential braking energy is to be captured, then the regenerative unit must be at least be designed to handle maximum negative power for the cycle.
Drive cycle development :
Althrough the regulatory drive cycles are important as they form part of the certification processes and are well developed, they only form a part of the vehicle development process as they do not represent all the driving conditions that the manufacturer wants to develop for. The manufactuer might have tests representing different driving scenarious and also might have more aggressive tests depending on the application.
Therefore, for an optimized design and to minimize the development time, it is important to be able to develop drive cycles, which can be either used in simulations or vehicle testing. Cycles that depend on certain vehicle capability can be relatively developed. For example, to test the vehicle towing capacity upto a grade, need to specify towing load, speed, grade and time of operation. Multiple cycles can be added to test the capability of the powertrain. For developing a drive cycle from a real world driving trip, the data is divided into kinematic sequences. The sequences are classified into distinct clusters.
Probability of the occurrence of each type of sequences are classified into distinct clusters. Probability of the occurrence of each type of sequence based on their probabilities and a cycle is built based on the selection of cycle type, minimum cycle duration, distance, number of stops, average and top speeds, etc.
To model the internal physical properties of the element and the losses, there are two kinds of approaches one is Map based models and Analytical models.
MATLAB initializing Code :
A MATLAB script "Project1_initFile.m" is to load the variable to the workspace that is to be used for further calculation/processing for the simulink model. A typical midsize car with a 1.9L engine and a 4-speed automatic transmission is considered. Data is taken from ADVISOR data base developed by NREL, USA. Transmission shift map and controller is taken from simulink exaple data base.
%%%%%%%%%%%%%%%%%%%%%%%%%%%%%%%%%%%%%%%%%%%%%%%%%%%%%%%%%%%%%%%%%%%%%
%% Skill-Lync -> Hybrid Drives Development
% Project - Conventional Vehicle Model
% By: Kaviyarasan K

%% Description:
% Initialization File
% Initialization file for loading the variables for the Conventional vehicle simulation model

clear all;
close all;
clc;

%% Vehicle Parameters
M = 1500;       % Vehicle weight [kg]
Cr = 0.015;     % Rolling resistance coefficient
Rw = 0.35;      % Rolling radius [m]
Cd = 0.33;      % Drag coefficient
Af = 2;         % Frontal area [m2]
rhoa = 1.225;   % Air density [kg/m3]
Vwind = 0;      % Wind velocity [kmph]
g = 9.81;       % Gravitational acceleration [m/s2]
theta = 0;      % Slope [deg]
myu_road_tire = 1; % Coefficient of friction between tire - road interface

%% Powertrain Parameters
FDR = 3.73;                         % Final Drive Ratio / Diff Ratio
DiffEff = 0.99;                     % Differential efficiency (assumed independent of operating conditions)

NumGear = 4;                        % Number of gears in transmission
TransGear = [1:NumGear];            % Transmission Gears
TransRatio = [3.06, 1.62, 1, 0.7];  % Corresponding Transmission ratios
TransEff = 0.90;                    % Transmission efficiency (assumed independent of operating conditions)

TC_SR = [0, .5, .6, .7, .8, .87, .92, .94, .96, .97, 1];   % Torque Converter Speed Ratio (Matlab default) -> TurbSpd/PumpSpd
TC_TR = [2.232, 1.5462, 1.4058, 1.2746, 1.1528, 1.0732, 1.0192, 1, 1, 1, 1];   % Torque Converter Torque Ratio (Matlab default) -> TurbTrq/PumpTrq
TC_Cf = 1e-4 * [.72558, .66322, .63463, .59042, .51331, .4144, .29287, .22444, .12186, .04386, 0]; % Torque Converter Capacity Factor (Matlab default) -> PumpTrq/PumpSpd^2 [Nm/rpm^2]

load Vehicle_Data/Engine_data_1_9L_Saturn_95kW
load Vehicle_Data/Trans_Shift_map

%% Driver Parameters
Kp = 10;                    % P gain for driver PI model
Ki = 1;                     % I gain for driver PI model
%Drive_Cycle_Select = 1;     % Drive cycle selection


%% Inputting the desired DriveCycle
Drive_Cycle_Select = input(sprintf('Select a Drive Cycle: n 1. UDDS n 2. HWFET n 3. FTP n 4. US06 n 5. NEDC n 6. WLTP n Your selection is: '));
% Drive cycle values in m/s

% Loading Drive Cycle values. Variables: cyc_time, cyc_vel
if Drive_Cycle_Select == 1
    load DriveCycles/UDDS;

elseif Drive_Cycle_Select == 2
    load DriveCycles/HWFET;

elseif Drive_Cycle_Select == 3
    load DriveCycles/FTP;

elseif Drive_Cycle_Select == 4
    load DriveCycles/US06;

elseif Drive_Cycle_Select == 5
    load DriveCycles/NEDC;

elseif Drive_Cycle_Select == 6
    load DriveCycles/WLTP;

end

time_end = cyc_time(end);   %End time from drive cycle
vel_end = cyc_vel(end);     %End Velocity from drive cycle

%% Running Simulink Model
sim('Project1_VehicleModel_stu_16a');   % Run Simulink model

%% Running Post Processing Script
Project1_ProcessingFile;        % Run Post processing Matlab script
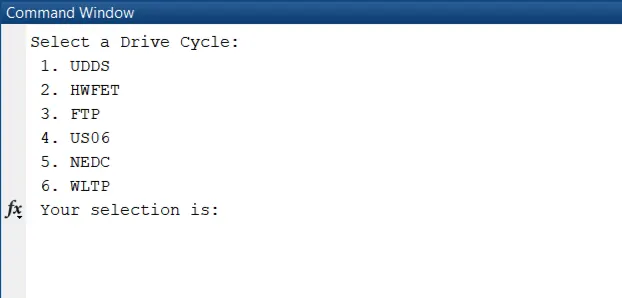
The code assigns various vehicle , powertrain and driver parameters. The MATLAB file "Engine_data_1_9L_Saturn_95kW" loads the engine parameters including Engine efficiency map, Engine fuel map, Engine inertia Engine map speed, Engine map torque and maximum torque values. The MATLAB file "Trans_shift_map" provides the necessary data required for the control logic of Transmission control unit. This code is designed such a way that it asks for the drive cycle that need to be used for the study and the user input decides the desired drive cycle for the study. The screenshot of the command window asking for the drive cycle of study is shown in figure. For the chosen drive cycle, the simulink vehicle model will be run automatically, and after that MATLAB post processing script will be run automatically for providing the necessary plots for the study.
Simulink vehicle model :
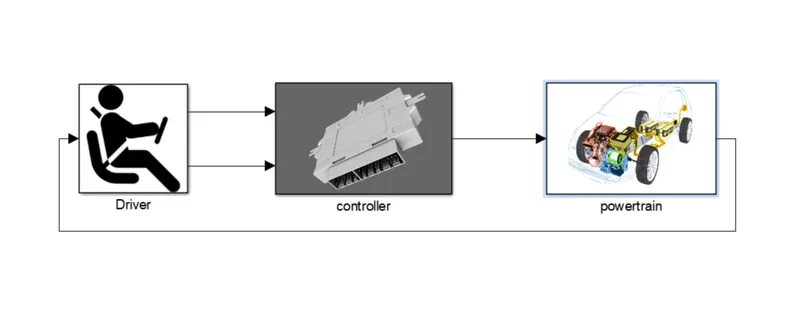
The simulink model consist of three main subsystem are Driver, Controller, Powertrain as shown in figure. The Driver subsystem generates the accelerator and brake pedal outputs to match the desired and actual vehicle speed. The Controller block represents the electronic control units, which generates the desired engine torque, desired transmission gear and desired brake torque based on the driver inputs. The Powertrain subsystem represents the actual vehicle consisting of all vehicle components which inputs the control signals from controller and provides actual vehicle motion characteristics.
Driver Block :
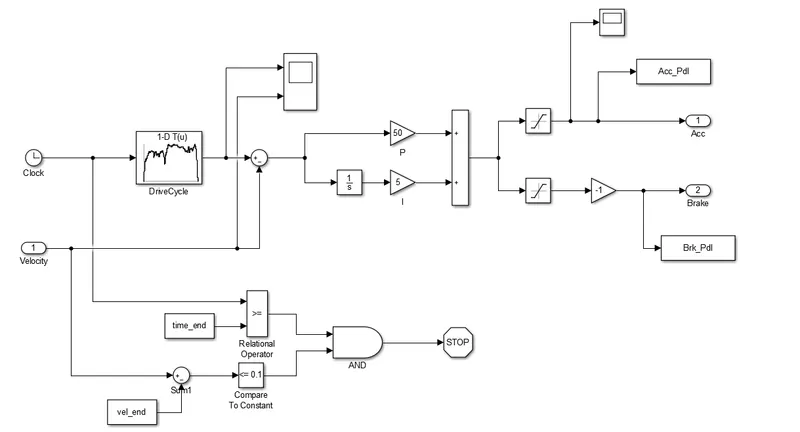
This block is basically a PI controller. A PI controller is a feedback control loop that calculates an error signal by taking the difference between the output of a system. It multiplies the error with constant gain for P and for I , it integrates and them multiply with a smaller gain. The constant value for P and I are found by trial-and-error method. Here, the error is the difference between the desired vehicle speed and the actual vehicle speed.
The error could be positive or negative. The integrator block used to keeps on adding the error is then divided into two since the driver block need to produce the signal for acceleration and brake pedal. The saturation block extracts the positive and negative signal as the acceleration pedal is passed on between the values 0 and 100 while for the brake pedal , the values between 100 and 0 are extracted. The comparative block compares the actual time and end time of drive cycle, similarly the current velocity is compared with the end velocity.
Controller Block :
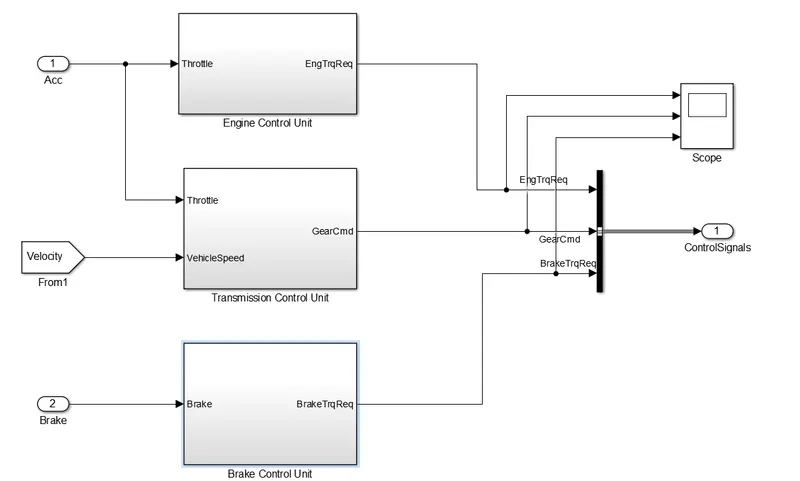
The output of the driver block which is the acceleration and brake pedal signal is passed on to the Controller block. The controller block consist of three control unit are Engine Control unit, Transmission control unit and Brake control unit. All these data from the three control unit goes to the bus creator. The bus creator is used to combine all these three signals to a one signal. This combined signal is then sent to the Powertrain block.
Engine control unit :
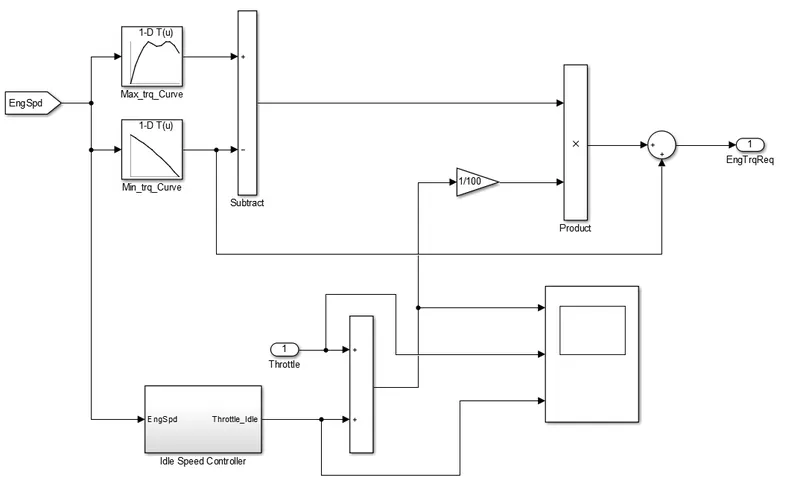
The engine control unit has idle speed controller to make sure that the engine is idling and doesn't go beyond idle speed. The signal from the idel speed controller is added to the throttle request from the Driver block is then converted into engine torque request based on the maximum and minimum torque curves made from 1D lookup table. A sample output from the scope for the UDDS drive cycle is shown in figure.
Idle speed controller :
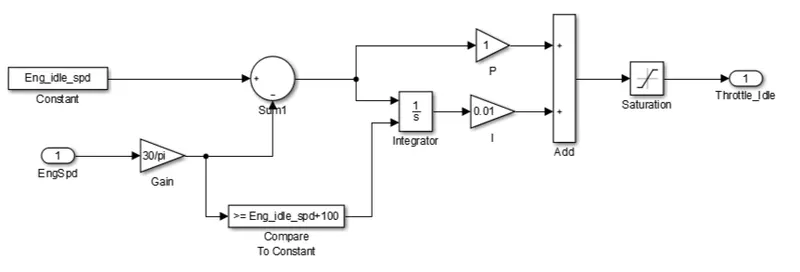
The idle speed controller is a PI controller where the engine speed and the idle speed of the engine is compared. The error is then multiplied with constant P and the integrated error is multiplied with constant I.
Transmission control unit :
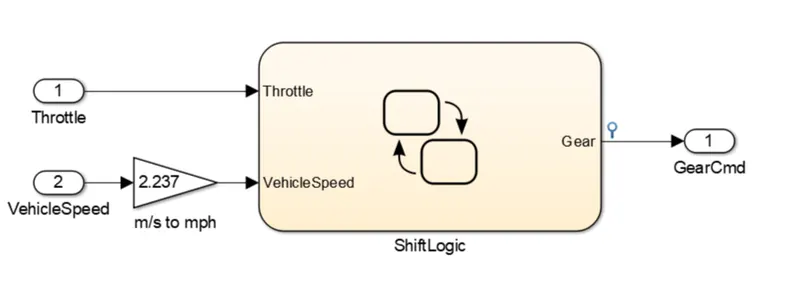
It uses a state logic and provided the current gear of the vehicle. The state is defined by comparing the throttle signal and vehicle speed. The shiftlogic is the logic control block for defining the gear.
Shift Logic :
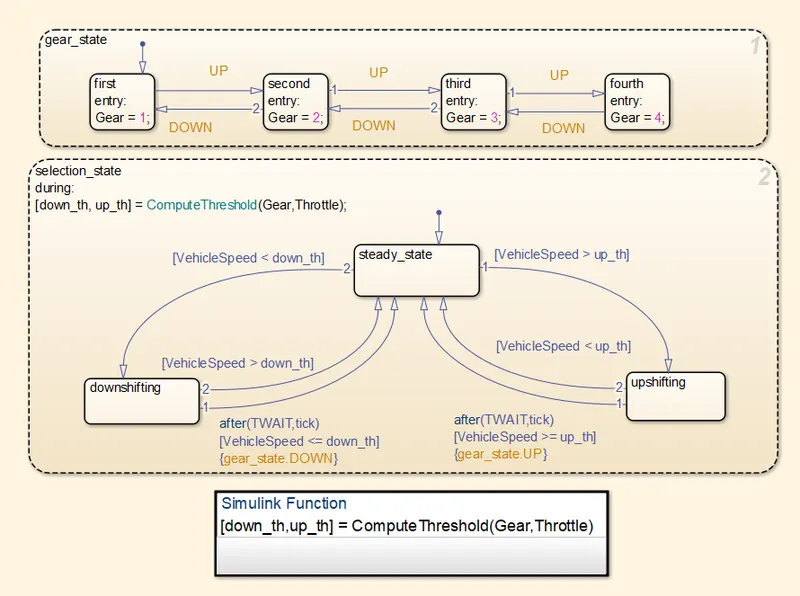
The gear_state is defined between 4 states as the vehicle has four gears in total. The UP and DOWN values are calculated using another state selection_state. When in selection_gear state, a function ComputeThteshold is calculated where the inputs are Gear and Throattle. the output will be down_th and up_th for the function which are speed limits. The outputs from the function is fed in, then the downshift and upshift is done based on vehicle speed and the parameter inputs from matlab file trans_shif_map.
Brake control unit :
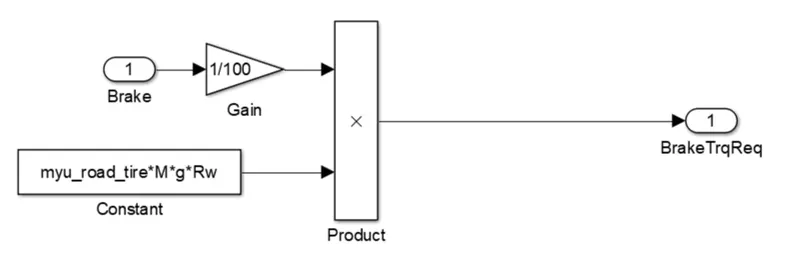
The Brake pedal signal from the driver block is multiplied with the maximum friction, which gives the maximum braking torque. The gain block is used convert to actual value from the percentage.
Powertrain Block :
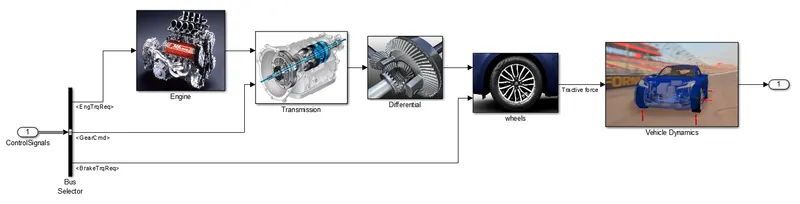
The Powertrain block consists of five main subsystems are Engine, Transmission, Differential, Wheels and Vehicle Dynamics. The signals from the controller block are extracted using the bus selsector, which consists of the signal for Engine torque requirement, Gear command and Brake torque requirement.
Engine :
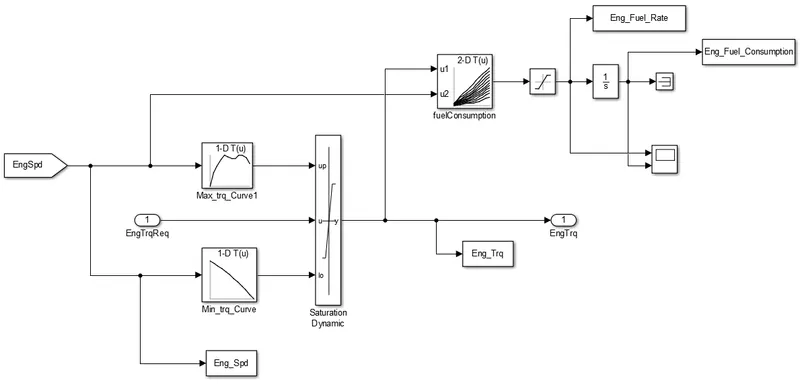
The Engine blocks takes in Engine torque requirement as input and it is compared with the maximum and minimum torque curve and is maintained between the required range using the saturation dynamic block. The maximum and minimum torque curve are found using the lookup table according to the engine speed from the data from the matlab file "Engine_data_1_9L_saturn_95kW" . The engine torque requirement after filtraction is passed to the 2D lookup table along with engine speed where the fuel consumption rate is found. The saturation block ensures that the fuel rate value is positive and integrating it gives the total engine fuel consumption. The required parameters are transferred to the workspace using to workspace blocks.
Transmission :
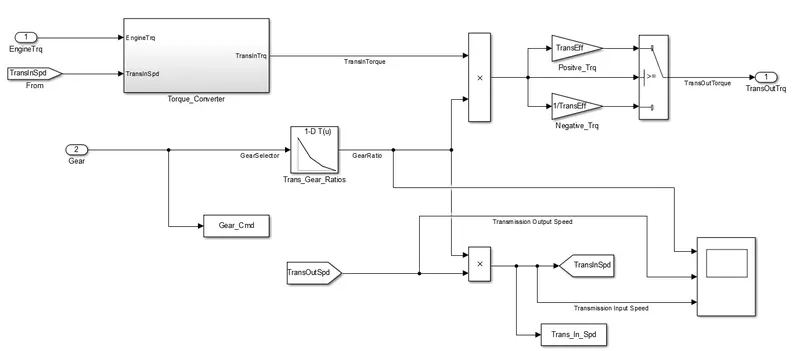
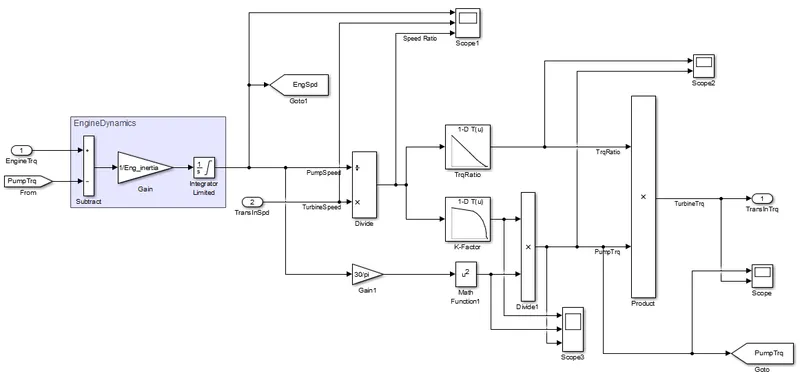
The transmission takes engine torque and gear as inputs. The signals are then passed into torque converter. The transmission torque from the torque converter is passed into the gear system where the speed and torque changes as per the gear reduction. The selected gear corresponding to a particular time is used to find the corresponding gear ratio value using the lookup table and is multiplied with torque from the torque convertor.
Torque convertor :
Differential :
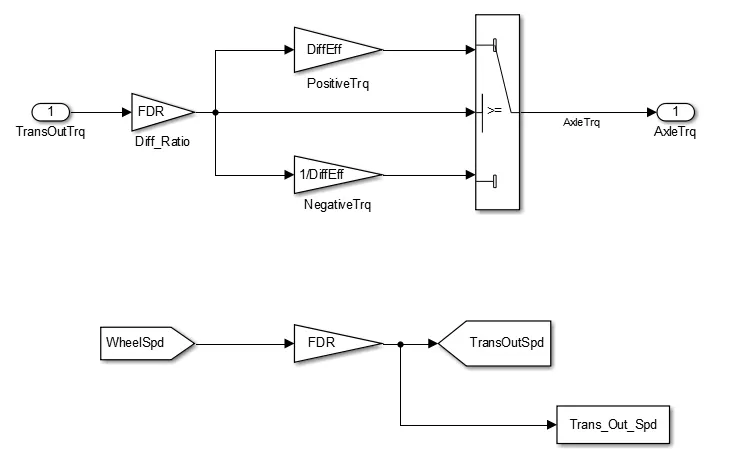
The Differential subsystem takes the output from the transmission system and reduce it as the gear ratio of the differential. The switch block is used to compensate for the negative and positive sign values. The required parameters are transferred between the other subsystems and the command window using the goto and to workspace blocks.
Wheels :
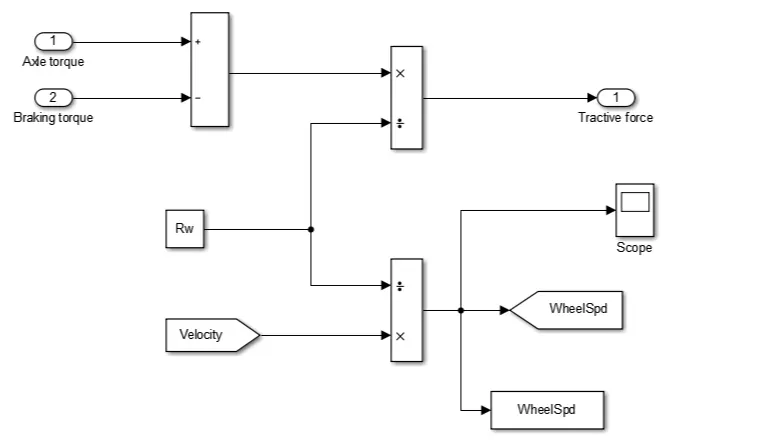
The Wheels subsystem takes the axle torque and brake torque as the input. The brake torque is to reduce the axle torque to maintain the desired vehicle speed. Dividing the dynamic radius of the wheel with equivalent torque and vehicle velocity gives the tractive force and the wheel speed.
Vehicle Dynamics :
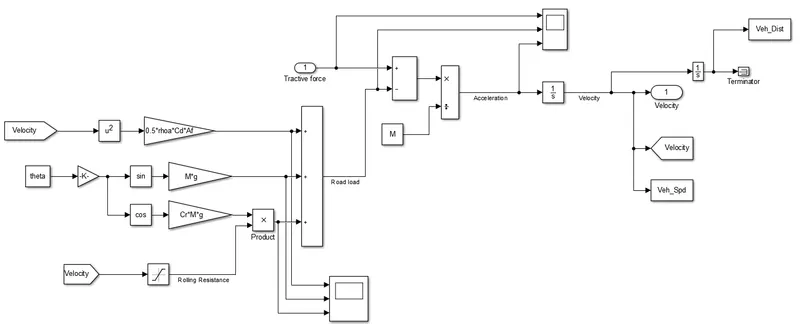
The vehicle dynamics block is used to find the vehicle dynamic characteristics like velocity, acceleration and distance travelled from the tractive force. The vehicle force corresponding to the actual vehicle is the difference between the tractive and the road load. The road losd constitutes the drag, rolling and grading resistance. The velocity saturation is multiplied with the rolling resistance to ensure that it is avoided when the vehicle is not in motion.
MATLAB Post processing code :
The MATLAB script "Project1_ProcessingFile" is used to analyze the data from the simulink model and to generate plots. After the simulink vehicle model is run some of the data are sent to the workspace which is used to plot different parameters for the study of conventional vehicle in MATLAB.
%%%%%%%%%%%%%%%%%%%%%%%%%%%%%%%%%%%%%%%%%%%%%%%%%%%%%%%%%%%%%%%%%%%%%
%% Skill-Lync -> Hybrid Drives Development
% Project - Conventional Vehicle Model
% By: Kaviyarasan K

% Description:
% The following file is to used with the Initialization file and Simulink
% results for post-processing of the data.

%% Post-Processing File
%  File for post-processing the Conventional vehicle simulation model data

close all;
%% Renaming variables
Time = tout;
Acc_Pdl = Acc_Pdl;          % Accelerator pedal [%]
Brk_Pdl = Brk_Pdl;          % Brake pedal [%]
Gear_Cmd = Gear_Cmd;        % Transmission gear
Trans_In_Spd = Trans_In_Spd*30/pi;  % Transmission input speed [rpm]
Trans_Out_Spd = Trans_Out_Spd*30/pi;% Transmission output speed [rpm]
Eng_Trq = Eng_Trq;          % Engine brake torque [Nm]
Eng_Spd = Eng_Spd*30/pi;    % Engine speed [rpm]
Eng_Fuel_Consump = Eng_Fuel_Consumption;    % Engine fuel consumption [g]
Enf_Fuel_Rate = Eng_Fuel_Rate;  % Engine Fuel COnsumption rate [g/s]
Veh_Dist = Veh_Dist/1000;   % Distance traveled by vehicle [km]
Veh_Spd = Veh_Spd*18/5;     % Vehicle speed [kmph]
%WheelSpd = WheelSpd*30/pi;
WheelSpd = (Veh_Spd.*60)./(2.*pi.*Rw);     % Wheel rpm


%% Data Analysis
Eng_Pwr = Eng_Spd.*pi./30.*Eng_Trq./1000;   % Engine brake power [kW]
rho_petrol = 0.7197;                    % Density of petrol [kg/L]
kmpl = Veh_Dist(end)/(Eng_Fuel_Consump(end)/1000/rho_petrol);    % Fuel economy [kmpl]


%% Plotting vehicle characteristics time trace

% Plot: Transmission Input and Output, Wheel Speed
figure(1)
plot(Time, Trans_In_Spd, 'linewidth', 1, 'Color', 'green');
hold on;
plot(Time, Trans_Out_Spd, 'linewidth', 1, 'Color', 'black');
hold on;
plot(Time, WheelSpd, 'linewidth', 1, 'Color', 'red');
hold on;
plot(Time, Eng_Spd, 'linewidth', 1, 'Color', 'blue');

ylabel('Speed [rpm]');
xlabel('Time [s]');
xlim([0, Time(end)]);
ylim([0, 5000]);
legend('Trans Input','Trans Output','Wheel Speed','Engine Speed');
grid on;

% Plot: Engine Torque, Engine Power, Fuel Rate & Fuel Consumption
figure (2)
subplot(2,2,1)
plot(Time, Eng_Trq, 'linewidth', 1, 'Color', 'green');
xlabel('Time [s]');
ylabel('Torque [Nm]');
legend('Engine Torque');
grid on;
xlim([0, Time(end)]);
ylim([-50 200])

subplot(2,2,2)
plot(Time, Eng_Pwr, 'linewidth', 1, 'Color', 'black');
xlabel('Time [s]');
ylabel('Power [Nm]');
legend('Engine Power');
grid on;
xlim([0, Time(end)]);
ylim([-20 60])

subplot(2,2,3)
plot(Time, Enf_Fuel_Rate, 'linewidth', 1, 'Color', 'red');
xlabel('Time [s]');
ylabel('Fuel Rate [g/s]');
legend('Engine Fuel Rate');
grid on;
xlim([0, Time(end)]);
ylim([-1.5 2])

subplot(2,2,4)
plot(Time, Eng_Fuel_Consump, 'linewidth', 1, 'Color', 'blue');
xlabel('Time [s]');
ylabel('Fuel Consump [g]');
legend('Engine Fuel Consumption');
grid on;
xlim([0, Time(end)]);


% Plot: Accelerator & Brake Pedal, Gear, Vehicle actual & desired speed,
% Vehicle DIstance
figure (3)
subplot(3,1,1)
plot(Time, Acc_Pdl, 'linewidth', 1, 'Color', 'black');
hold on;
plot(Time, Brk_Pdl, 'linewidth', 1, 'Color', 'red');
ylabel('Pedal [%]')
xlim([0, Time(end)]);
legend('Accel','Brake');
grid on;

subplot(3,1,2)
hold on;
grid on;
plot(Time, Gear_Cmd, 'linewidth', 1, 'Color', 'black');
xlim([0, Time(end)]);
ylim([0 5]);
xlabel('Time [s]');
ylabel('Gear');

subplot(3,1,3)
hold on;
grid on;
plot(cyc_time, (cyc_vel.*(18./5)),'linewidth', 1,'Color', 'black');
plot(Time, Veh_Spd, 'linewidth', 1, 'Color', 'red');
legend('Desired','Actual');
xlim([0, Time(end)]);
ylim([0,125]);
xlabel('Time [s]');
ylabel('Velocity [km/h]');

figure(4)
plot(Time, Veh_Dist, 'linewidth', 1, 'Color', 'black');
xlim([0, Time(end)]);
xlabel('Time [s]');
ylabel('Distance [km]');
title('Vehicle Distance')
grid on;


%% Plotting engine operating points on engine fuel map
figure('Name','Engine Operating Points');
hold on
grid on
title('Engine Operating Points','fontsize',12);
p1=plot(Eng_map_spd*30/pi,Eng_max_trq,'linewidth',2,'color','r');
p2=line([Eng_map_spd(end)*30/pi Eng_map_spd(end)*30/pi],[0 Eng_max_trq(end)]);
set(p2,'linewidth',1,'linestyle','--','color','k');
p3=line([Eng_map_spd(1)*30/pi Eng_map_spd(1)*30/pi],[0 Eng_max_trq(1)]);
set(p3,'linewidth',1,'linestyle','--','color','k');
[c,h] = contour(Eng_map_spd'*30/pi,Eng_map_trq,Eng_fuel_map');
clabel(c,h);
xlabel('Engine Speed [rpm]');
ylabel('Engine Torque [Nm]');
title('Engine Fuel Consumption Map [g/s]');
p4 = plot(Eng_Spd,Eng_Trq,'.','color','k');
legend([p1 p4],{'Max Curve','Operating Points'});
axis([Eng_map_spd(1)*30/pi Eng_map_spd(end)*30/pi 0 Eng_map_trq(end)]);
For the study of the developed vehicle model with various drive cycle, the code to plot the following relations are made,
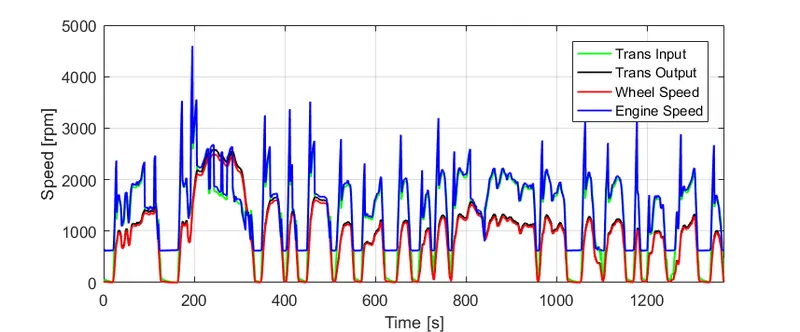
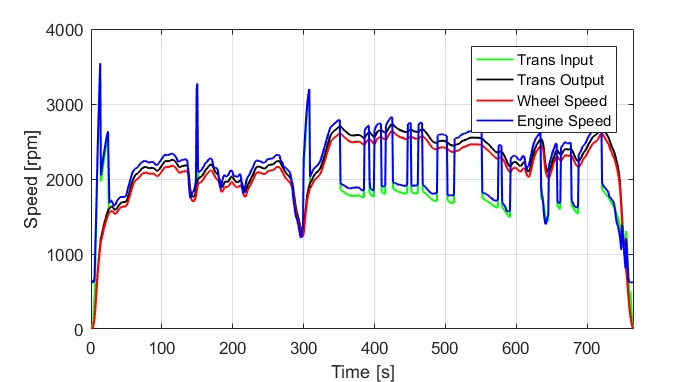
- The time trace for engine, transmission input, transmission output and wheel speed on one plot.
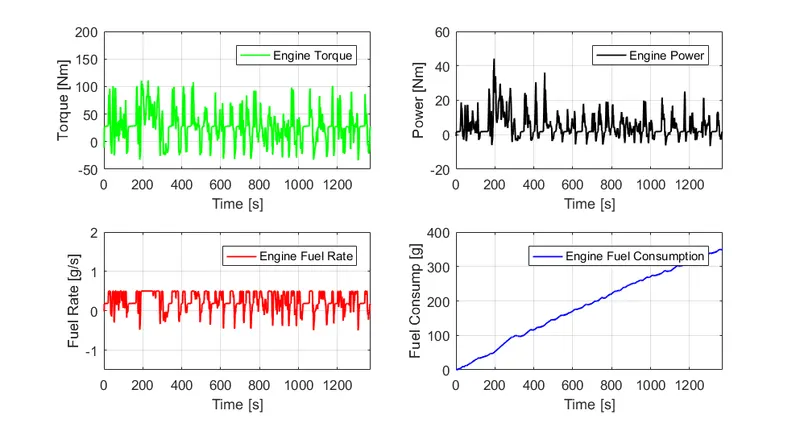
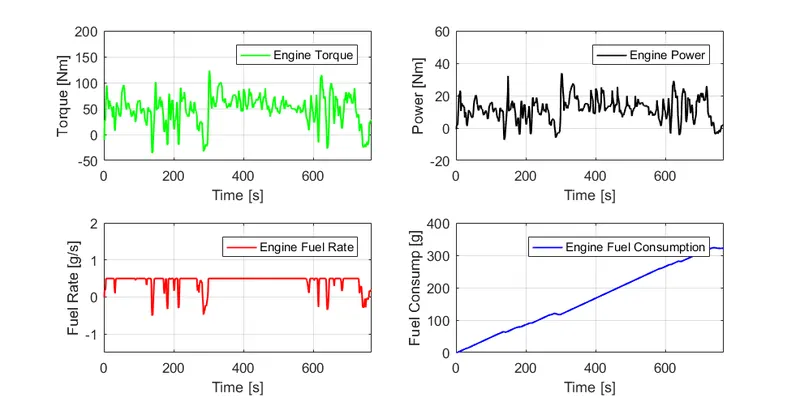
- The engine torque, engine power, fuel rate and fuel consumption using subplots.
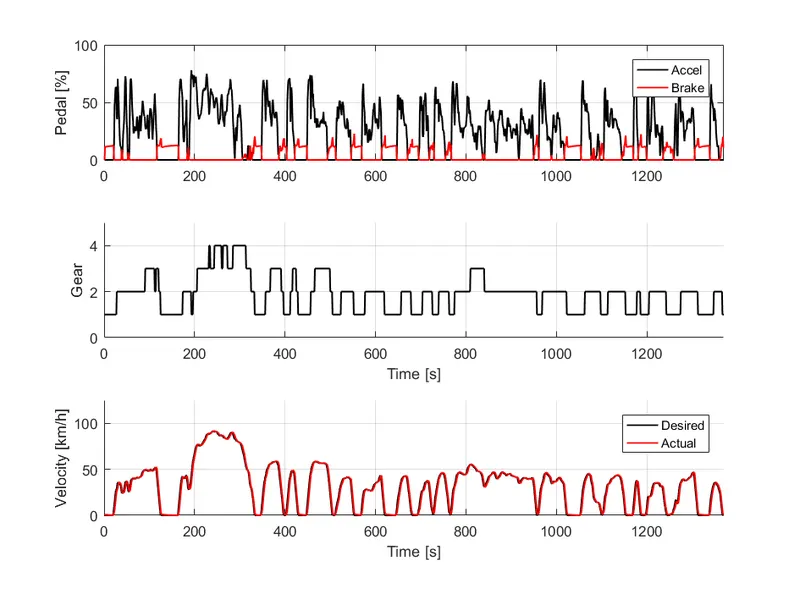
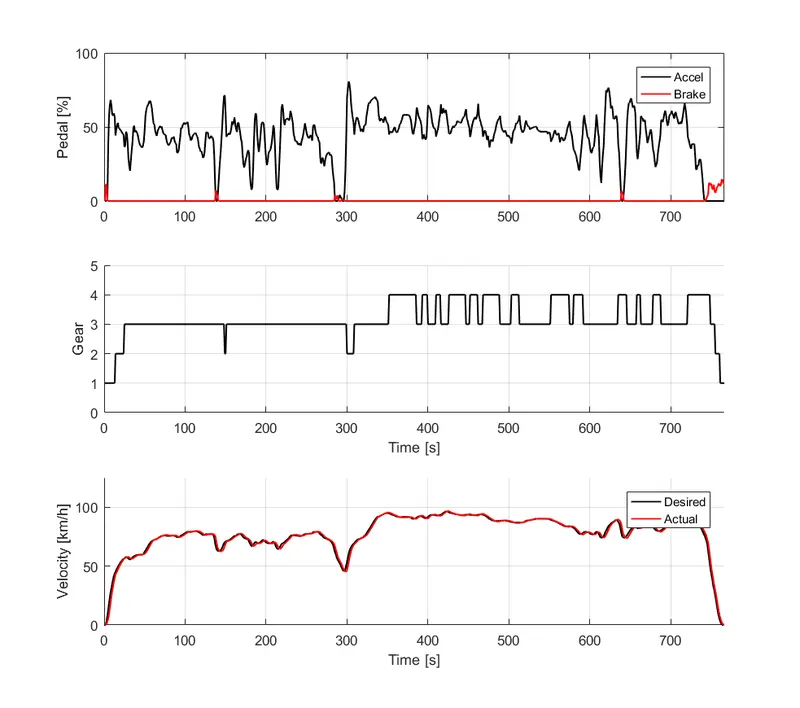
- The accelerator and brake pedal, gear command, vehicle desired and actual speed, vehicle distance using subplots.
- The engine operating points on the engine fuel map.
Study of the developed model for UDDS and HWEET drive cycle :
plots for various speed [rpm]:
This first plot is for time trace for engine, transmission input, transmission output and wheel speed. from this plot we see the engine speed(blue curve) is always high and the wheel speed(red curve) is low when compaired to engine speed. this is happen from the units persent between this two. the transmission loss and the differential loss are the reason for this variations.
For UDDS drive cycle ,
For HWFET drive cycle,
Plots for engine torque, power, fuel rate and fuel consumption :
The drive cycle velocity for HWEET is more in the higher range than the UDDS. The power requirement is directly proportional to the power of three for the aerodynamic drag and directly proportional to the rolling and grading resistance. since, the proportion of higher velocity is more predominant in HWFET the vehicle requires more power to run HWFET than UDDS which means that, the fuel consumption of UDDS is less than HWFET even through the drive cycle time is more for UDDS.
For UDDS drive cycle,
For HWFET drive cycle,
plots for Accleration, Brake pedal, Gear position :
The UDDS drive cycle seems to have more prominent varying velocity over time than HWFET. Therefore, more brake pedal has to be used for UDDS than HWEET which can be observed from the first subplot. The more the brake pedal is pressed, the more will be the energy loss, which in turn means that less will be the fuel economy number.
The second plot is shows the current gear position of the vehicle as the required speed it change the gear automatically by the automatic transmission system present in this system. Third plot is shows the current velocity of the vehicle.
For UDDS drive cycle,
For HWFET drive cycle,
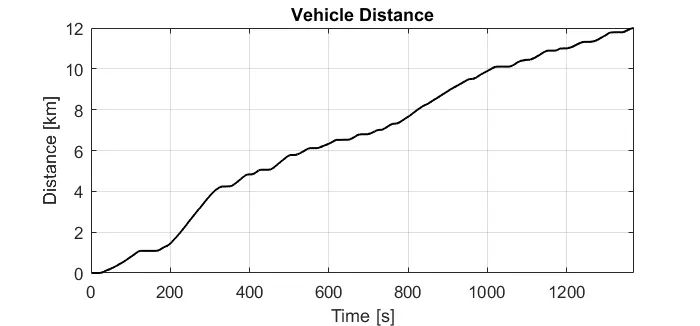
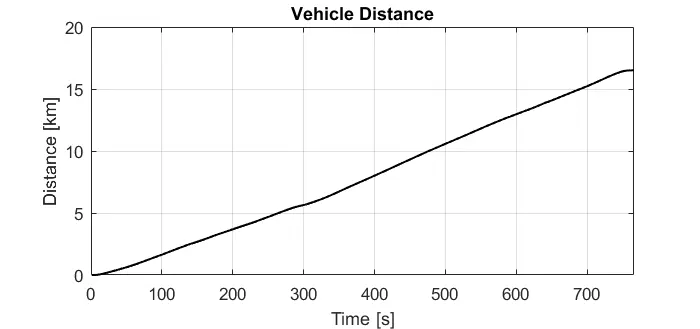
Plots for distance travel :
- Fuel Economy Numbers(kmpl) for UDDS is 14.2054
- Fuel Economy Numbers(kmpl) for HWEET is 16.5012
This variation is purely based on drive cycle which is easily observable from figure this information on variation of velocity with respect to time. And the plot shows that the vehicle tavel distance in kmph.
For UDDS drive cycle,
For HWFET drive cycle,
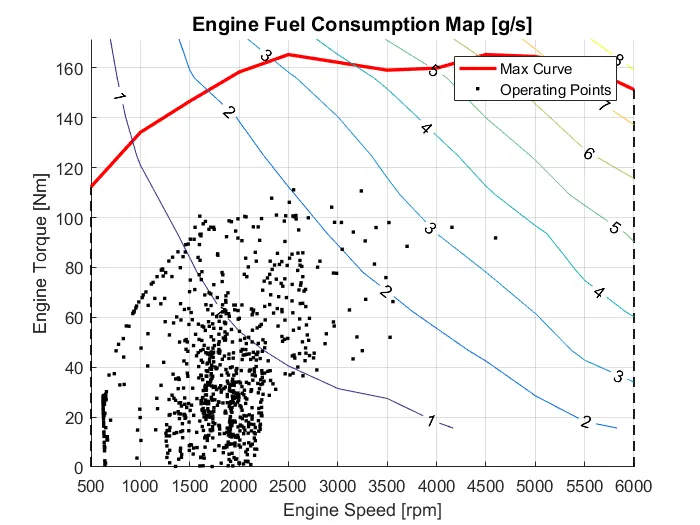
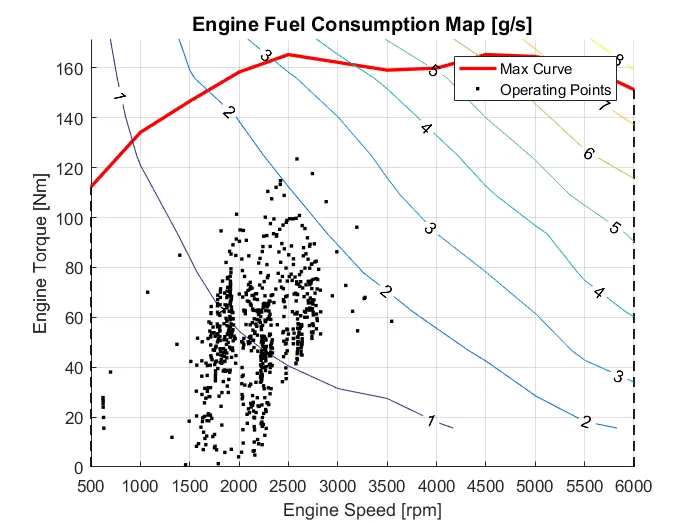
Plots for Engine operating points :
This plot is for finding the engine operating points on the fuel consumption map to know about is it operating inside the fuel economical map or not. From the figure the operating points are seemed to be extreme for UDDS drive cycle. These figures shows that the engine is capable of going in higher velocity than requires in both drive cycle as the max engine speed possible is 6000 rpm. For the cases, the operating parameters are within the engine torque curve.
For UDDS drive cycle,
For HWFET drive cycle,
Conclusion :
The MATLAB script for both initializing and post processing has be successfully made, and a forward energy-based fuel consumption simulink model of a conventional vehicle is also developed successfully and the functions are checked. The comparative study of using UDDS and HWFET drive cycles for the developed vehicle model is analyzed.