Project 1
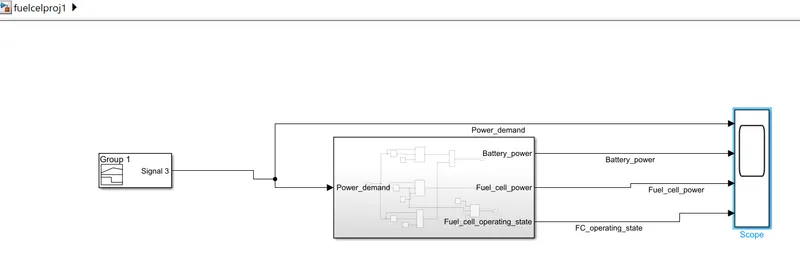
The simulink model for the flowchart is given below. The input is given with the help of signal builder.
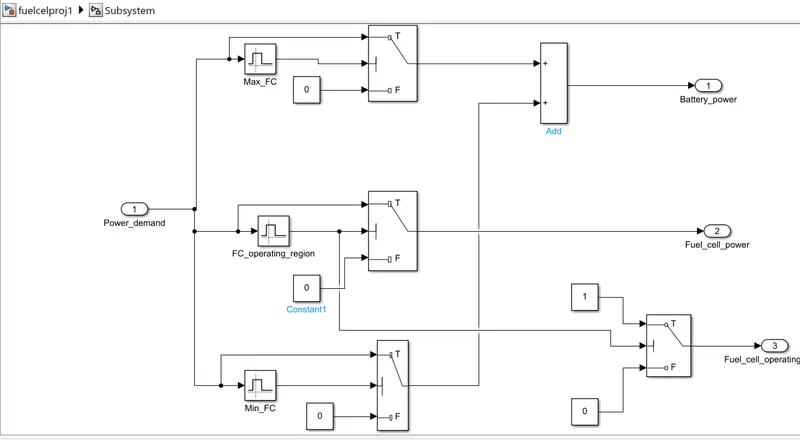
The subsystem of the above model is shown below. The power demand is given as below.
- For the battery power, the maximum fuel cell is given between 1000 to 1100.
- For Fuel cell power, fuel cell operating region is given between 0 to 1000.
- For fuel cell operating region, minimum fuel cell is given between 0 to 100.
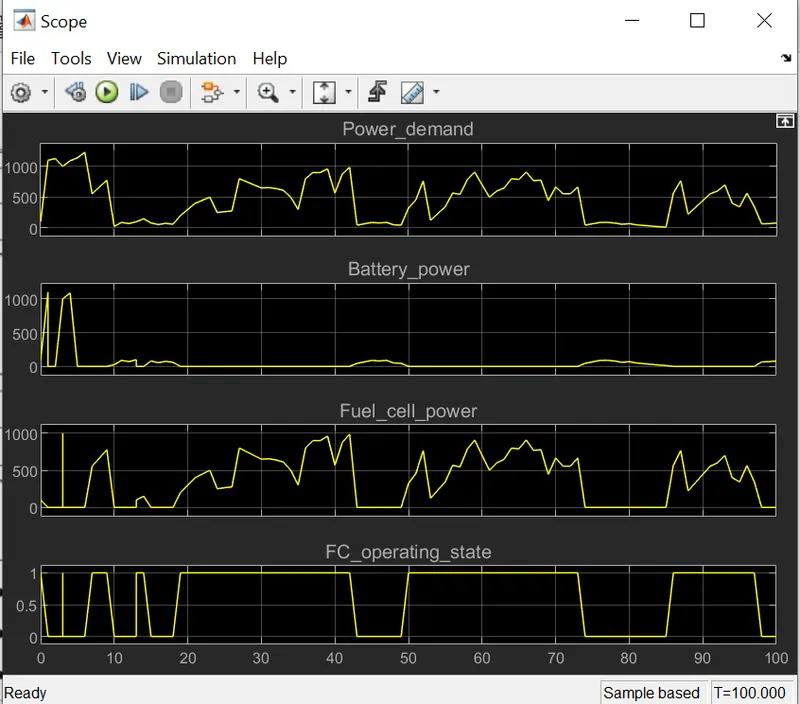
The result for power demand, battery power, fuel cell power and fuel cell operating power is shown below.