Project 1
EXPLANATION:
convectional vehicle:
convectional vehicles use an internal combustion engine fueled by gasoline or diesel to power the wheels .In this the heat engine uses the principle of heat releases through combustion of a fuel with an oxidizer in a combustion chamber to create expanding gases which pushes against a piston creating forces and torque output.
In this vehicle engine converts chemical energy stored in the fuel into heat which is used to produce useful work.Typically use fossil fuels like petroleum ie diesel or petrol. The most popular type of engine is used in this system is 4 stroke reciprocating engine . Engine in cylinder process can be represented by ideal thermodynamic cycles such as otto cycle , diesel cycle . otto cycle is a ideal cycle that describes the cycle process for spark ignited si engine and the diesel cycle is ideal cycle that describes for compression ignited ci engine .
energy and performance of vehicle:
In this system trge power demand on the wheel need to instant supplied by the powertrain.In the other words the power coming from the powertrain dictates the power demand on the wheels . In this vehicle the powertrain is consists of an engine connected to the wheels through a transmission therefore the power comes from the engine through the transmission
Forward-facing model:
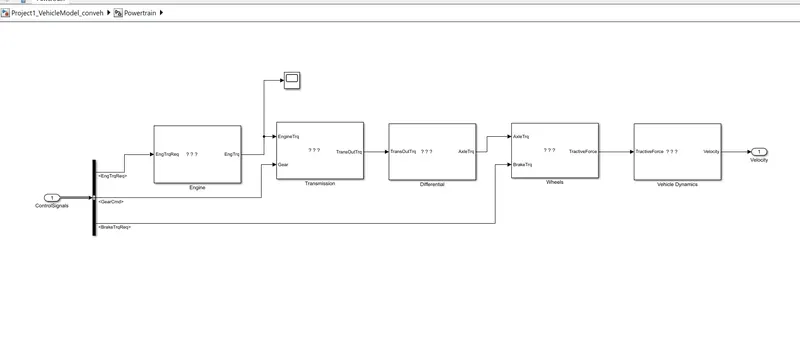
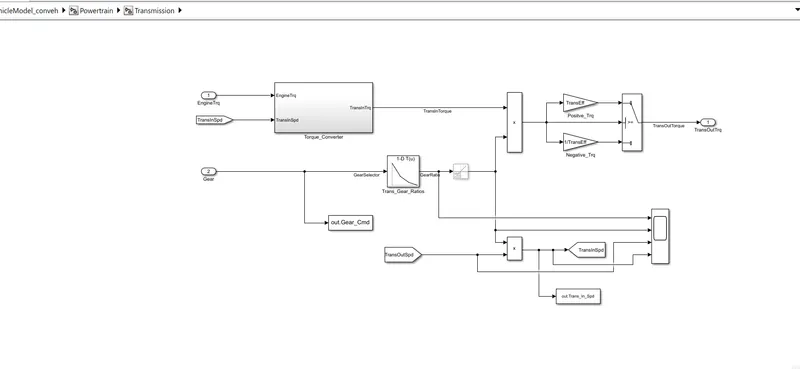
Forward-facing models represent dynamic models with the correct causality. A forward-facing vehicle model features a driver model, which provides torque demand in the form of desired ICE torque and brake torque (positive and negative torque), to meet the speed trace from a drivecycle. The topology of the forward-facing model used in this investigation is shown in Figure. A basic driver model typically uses one or more Proportional-Integral (PI) controllers to achieve the torque demand, with reference to the desired speed trace. This is discussed further in the next section. The torque produced by the ICE propagates through the transmission and final drive ratios, before ending up as torque applied at the wheels. This is then exerted to the vehicle mass via force on the tyre contact patch. The vehiclespeed that results from the applied force is propagated back through the drivetrain, and returns to the ICE as angular velocity at the crankshaft. Brake torque is applied directly at the wheels.
matlab script :
Matlab script used to load all the variables required for running the Simulink model and for post-processing. The drive cycle selection is also done here. Before running the Simulink vehicle model, run this initialization script
% Skill-Lync -> Hybrid Drives Development
% Project 1 - Conventional Vehicle Model

% Description:

% Initialization File
% Initialization file for loading the variables for the Conventional vehicle simulation model

% Vehicle Parameters
M = 1500;       % Vehicle weight [kg]
Cr = 0.015;     % Rolling resistance coefficient
Rw = 0.35;      % Rolling radius [m]
Cd = 0.33;      % Drag coefficient
Af = 2;         % Frontal area [m2]
rhoa = 1.225;   % Air density [kg/m3]
Vwind = 0;      % Wind velocity [kmph]
g = 9.81;       % Gravitational acceleration [m/s2]
theta = 0;      % Slope [deg]
myu_road_tire = 1; % Coefficient of friction between tire - road interface

% Powertrain Parameters
FDR = 3.73;                         % Final Drive Ratio / Diff Ratio
DiffEff = 0.99;                     % Differential efficiency (assumed independent of operating conditions)

NumGear = 4;                        % Number of gears in transmission
TransGear = [1:NumGear];            % Transmission Gears
TransRatio = [3.06, 1.62, 1, 0.7];  % Corresponding Transmission ratios
TransEff = 0.90;                    % Transmission efficiency (assumed independent of operating conditions)

TC_SR = [0, .5, .6, .7, .8, .87, .92, .94, .96, .97, 1];   % Torque Converter Speed Ratio (Matlab default) -> TurbSpd/PumpSpd
TC_TR = [2.232, 1.5462, 1.4058, 1.2746, 1.1528, 1.0732, 1.0192, 1, 1, 1, 1];   % Torque Converter Torque Ratio (Matlab default) -> TurbTrq/PumpTrq
TC_Cf = 1e-4 * [.72558, .66322, .63463, .59042, .51331, .4144, .29287, .22444, .12186, .04386, 0]; % Torque Converter Capacity Factor (Matlab default) -> PumpTrq/PumpSpd^2 [Nm/rpm^2]

load Vehicle_Data/Engine_data_1_9L_Saturn_95kW
load Vehicle_Data/Trans_Shift_map

%% Driver Parameters
Kp = 10;                    % P gain for driver PI model
Ki = 1;                     % I gain for driver PI model
Drive_Cycle_Select = 2;     % Drive cycle selection

% Drive cycle values in m/s

if Drive_Cycle_Select == 1
    load DriveCycles/UDDS;

elseif Drive_Cycle_Select == 2
    load DriveCycles/HWFET;

elseif Drive_Cycle_Select == 3
    load DriveCycles/FTP;

elseif Drive_Cycle_Select == 4
    load DriveCycles/US06;

elseif Drive_Cycle_Select == 5
    load DriveCycles/NEDC;

elseif Drive_Cycle_Select == 6
    load DriveCycles/WLTP;

end

time_end = cyc_time(end);
vel_end = cyc_vel(end);
vehicle model:
driver model:
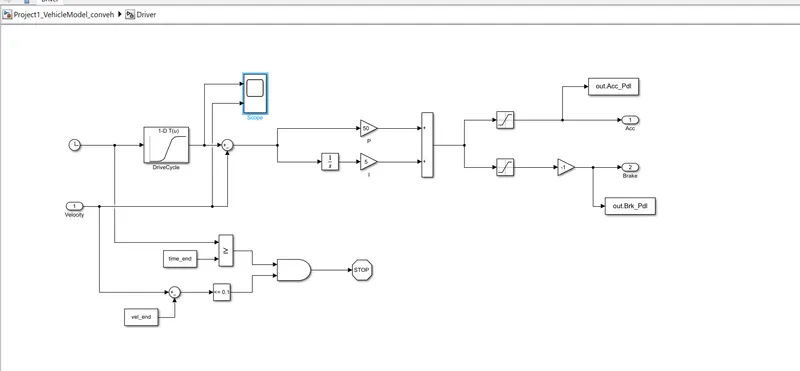
scopes for driver model
udds cycle :
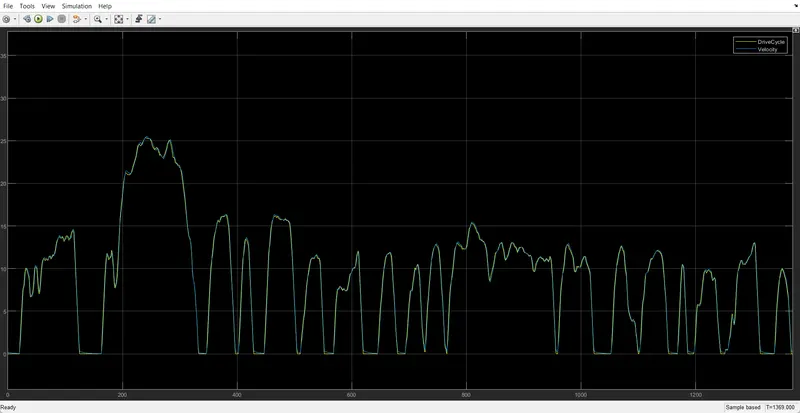
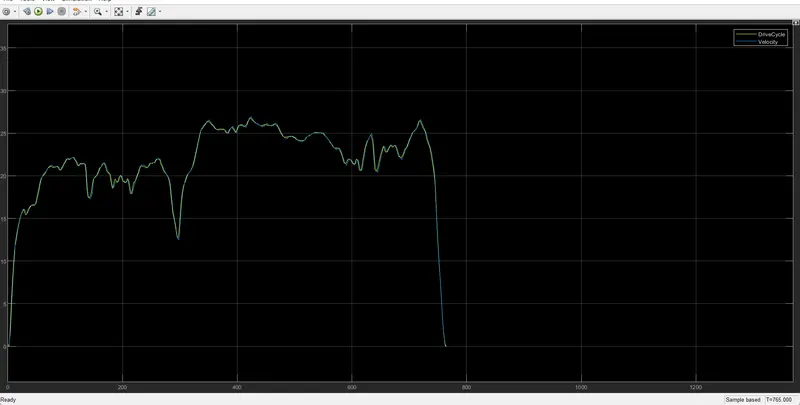
for HWFET cycle:
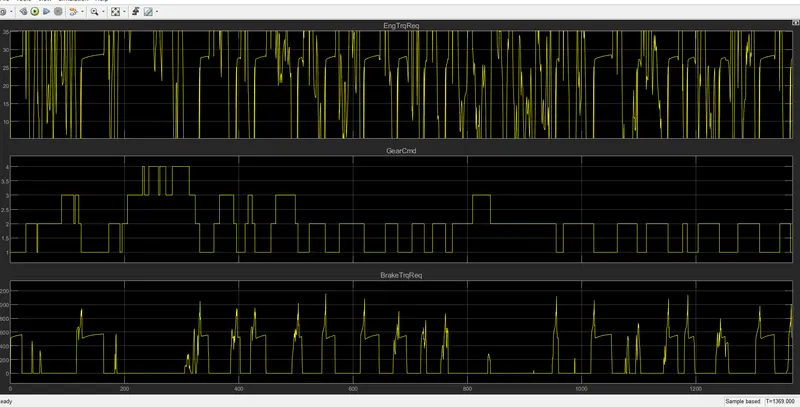
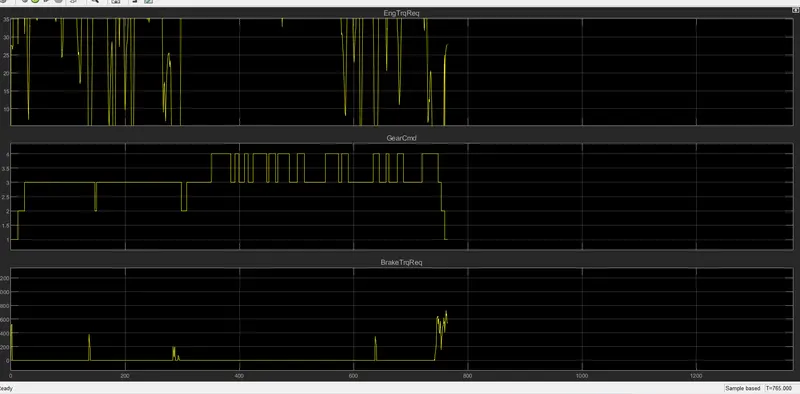
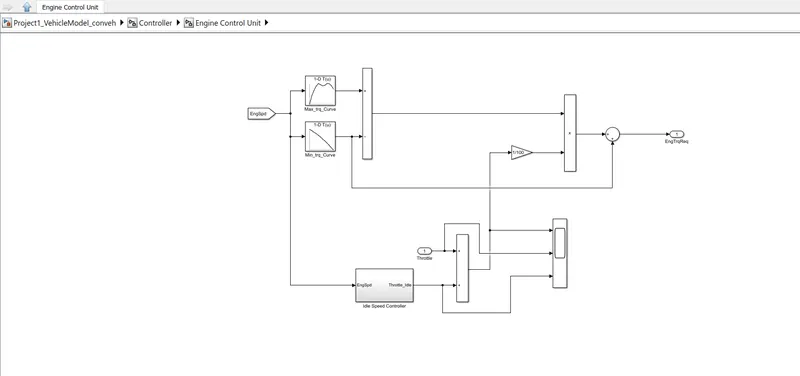
controller block:
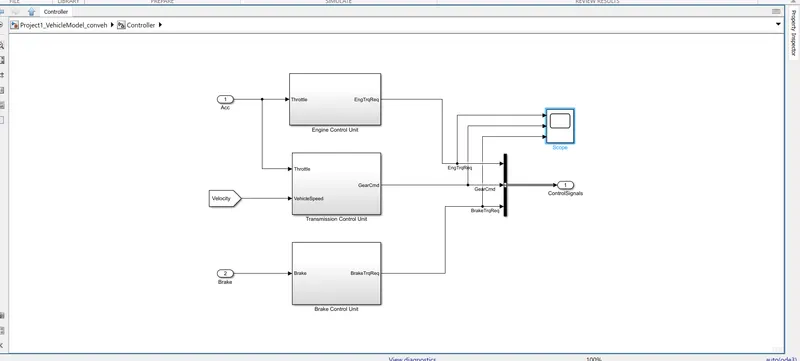
scope for controller model:
UDDS CYCLE:
HWFET CYCLE:
engine control unit model:
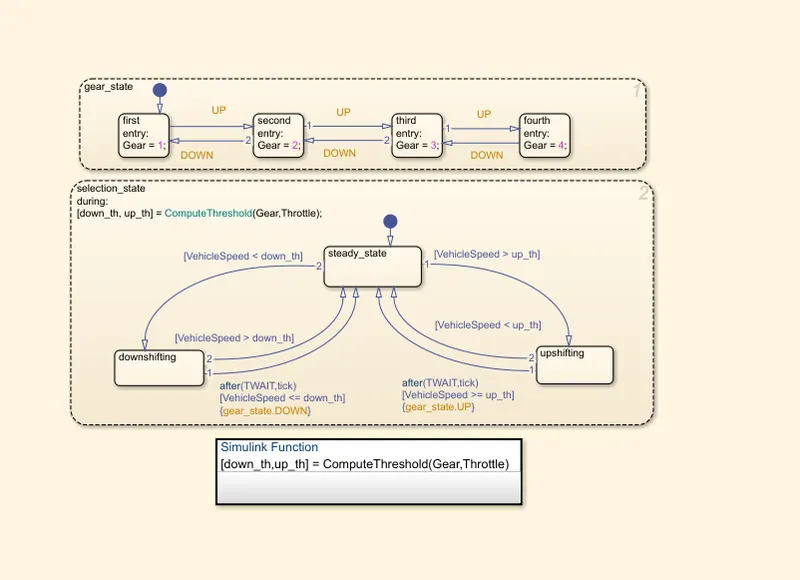
transmission control unit:
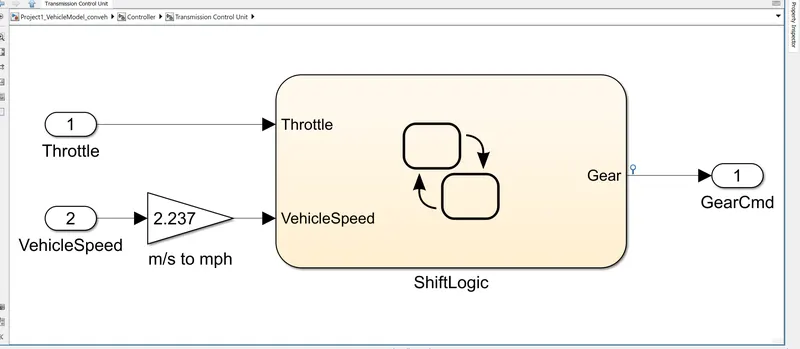
shift logic:
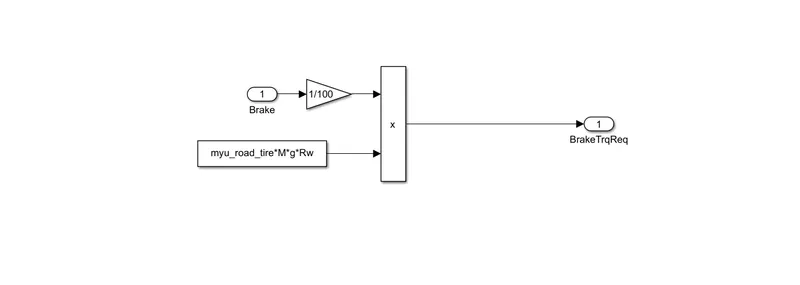
brake control unit:
power train model:
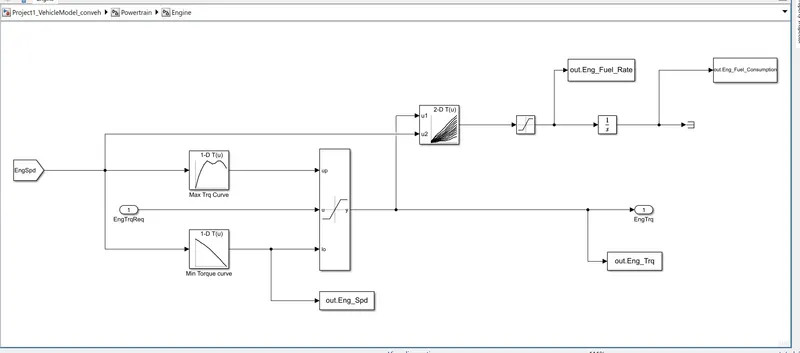
engine model:
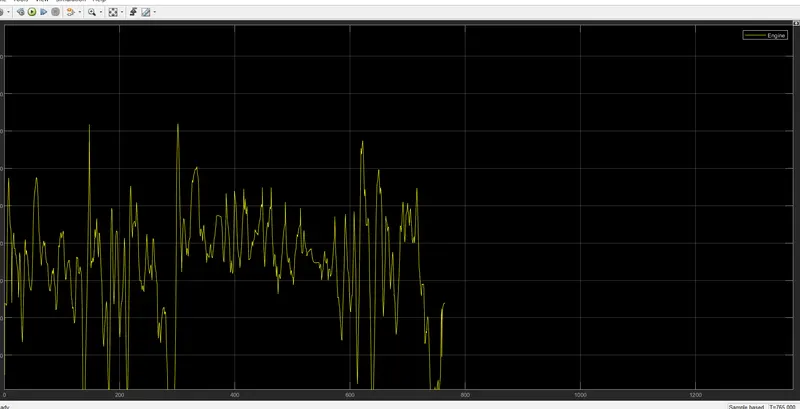
scopes for engine model:HWFET CYCLE:
TRANSMISSION MODEL:
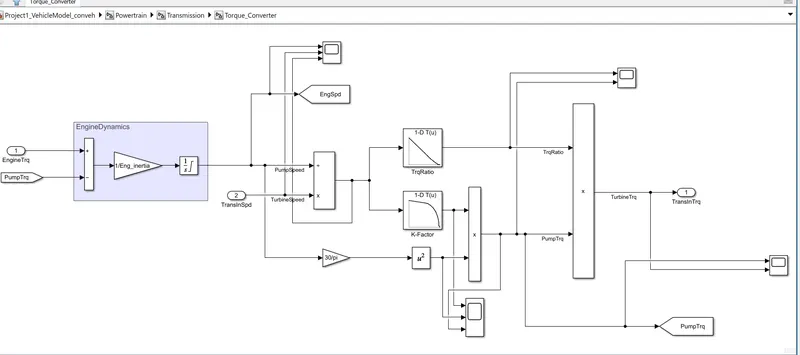
torque converter:
transmission udds cycle:
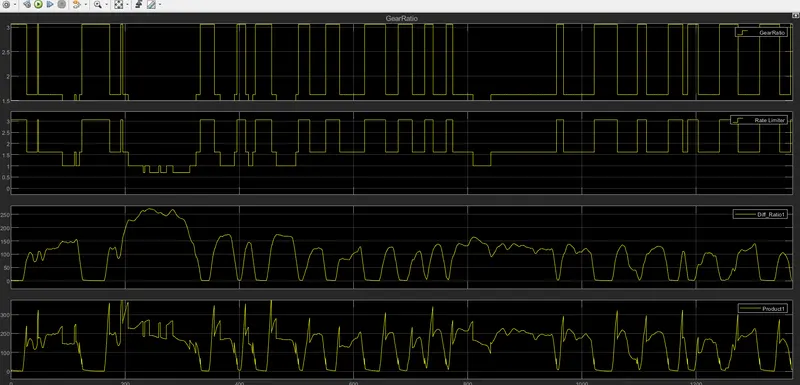
hwfet cycle:
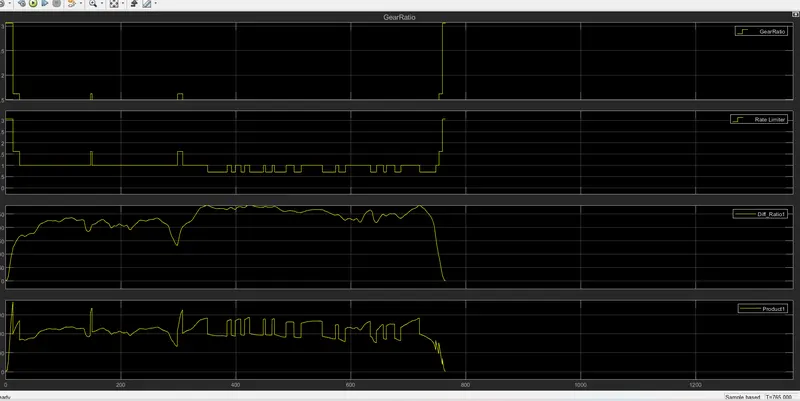
differential model:
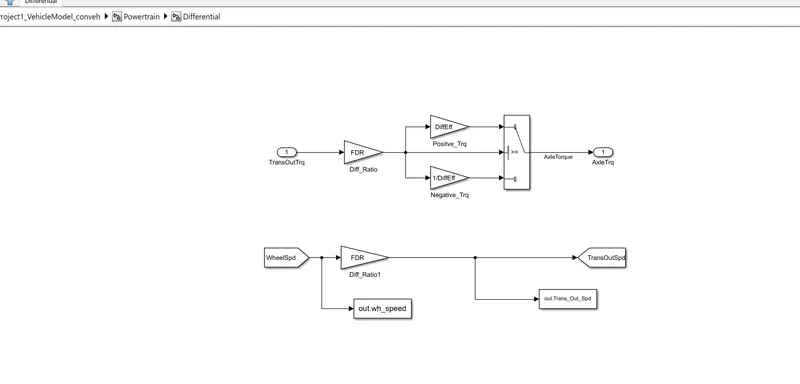
wheels model:
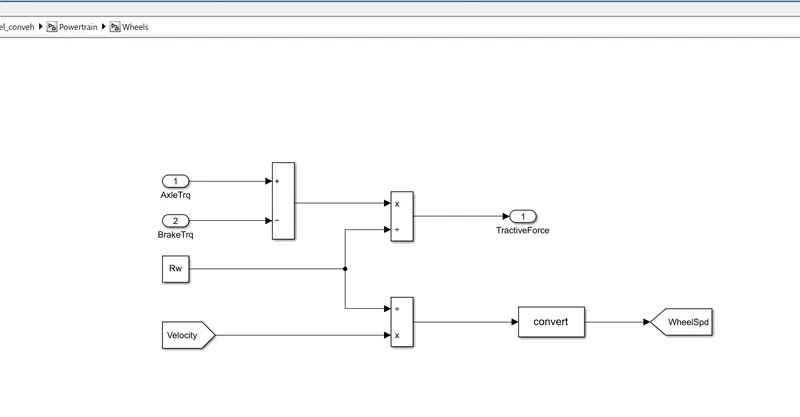
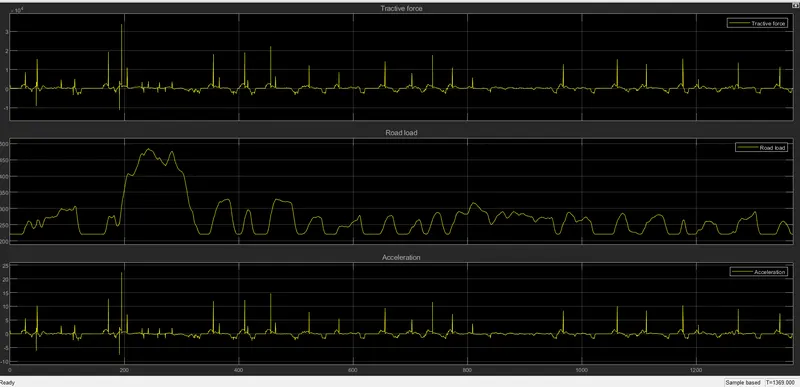
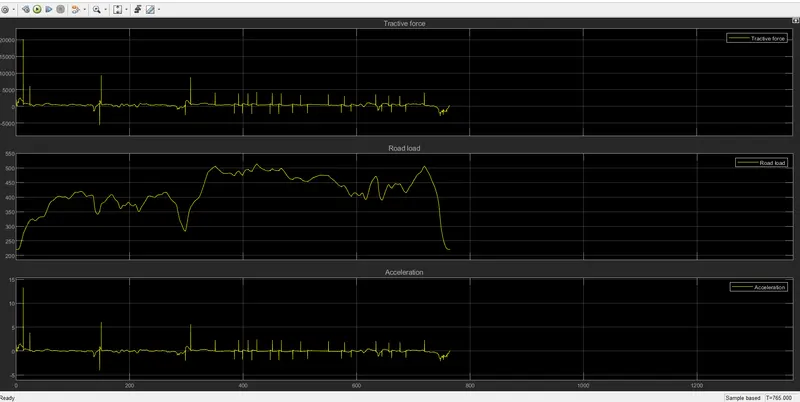
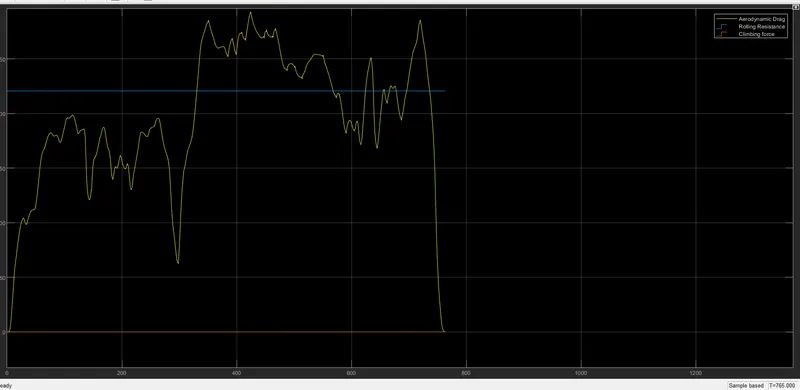
vehicle dynamics model:
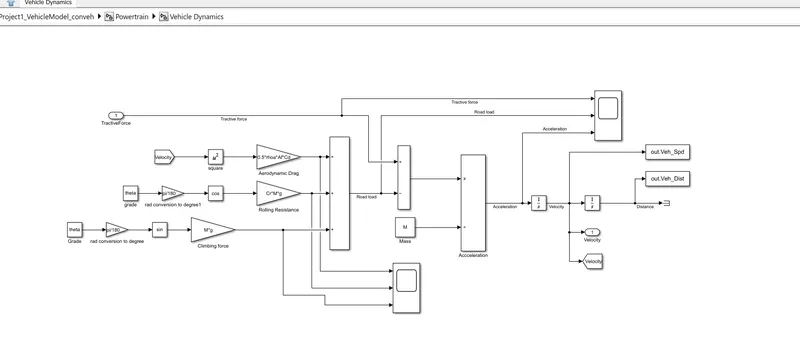
vehicle dynamics udds cycle:
hwfet cycle :
processing file :
%% Skill-Lync -> Hybrid Drives Development
% Project 1 - Conventional Vehicle Model


% Description:
% The following file is to used with the Initialization file and Simulink
% results for post-processing of the data.
% The file is incomplete, has some examples of how the data is imported
% into a readable format, data analysis and plotting examples.
% Based on the project task, use commands in a similar format as given
% below, to analyse the data and generate required plots.
% You can change variable names if desired

% Post-Processing File
%  File for post-processing the Conventional vehicle simulation model data

% Renaming variables
Time = out.tout;
Acc_Pdl = out.Acc_Pdl;          % Accelerator pedal [%]
Brk_Pdl = out.Brk_Pdl;          % Brake pedal [%]
Gear_Cmd = out.Gear_Cmd;        % Transmission gear
Trans_In_Spd = out.Trans_In_Spd*30/pi;  % Transmission input speed [rpm]
Trans_Out_Spd = out.Trans_Out_Spd*30/pi;% Transmission output speed [rpm]
Eng_Trq = out.Eng_Trq;          % Engine brake torque [Nm]
Eng_Spd = out.Eng_Spd*30/pi;    % Engine speed [rpm]
Eng_Fuel_Consump = out.Eng_Fuel_Consumption;    % Engine fuel consumption [g]
Veh_Dist = out.Veh_Dist/1000;   % Distance traveled by vehicle [km]
Veh_Spd = out.Veh_Spd*18/5;     % Vehicle speed [kmph]
wheel_spd = out.wh_speed;
fuel_rate = out.Eng_Fuel_Rate;


%%Data Analysis
Eng_Pwr = Eng_Spd*pi/30*Eng_Trq/1000;   % Engine brake power [kW]
rho_petrol = 0.7197;                    % Density of petrol [kg/L]
kmpl = Veh_Dist(end)/(Eng_Fuel_Consump(end)/1000/rho_petrol);    % Fuel economy [kmpl]


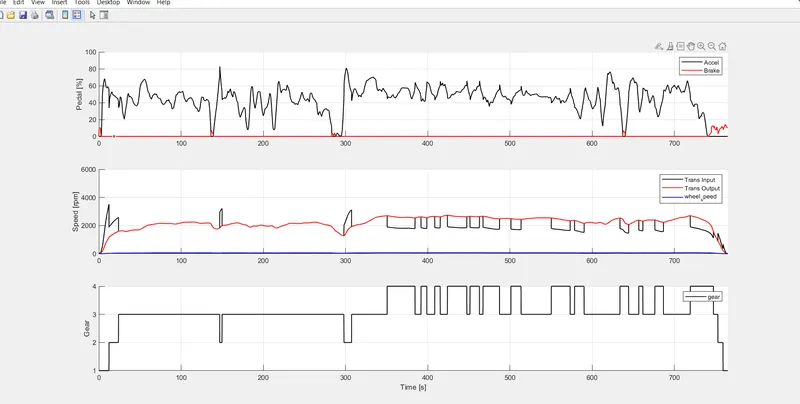
%Plotting vehicle characteristics time trace
figure(1)
subplot(3,1,1)
hold on
grid on
plot(Time, Acc_Pdl, 'linewidth', 1, 'Color', 'black');
plot(Time, Brk_Pdl, 'linewidth', 1, 'Color', 'red');
ylabel('Pedal [%]')
xlim([0, Time(end)]);
legend('Accel','Brake');
subplot(3,1,2)
hold on
grid on
plot(Time, Trans_In_Spd, 'linewidth', 1, 'Color', 'black');
plot(Time, Trans_Out_Spd, 'linewidth', 1, 'Color', 'red');
plot(Time,wheel_spd,'linewidth',1,'color','blue');
ylabel('Speed [rpm]')
xlim([0, Time(end)]);
ylim([0, 6000]);
legend('Trans Input','Trans Output','wheel_speed');
subplot(3,1,3)
hold on
grid on
plot(Time, Gear_Cmd, 'linewidth', 1, 'Color', 'black');
xlim([0, Time(end)]);
xlabel('Time [s]');
ylabel('Gear');
legend('gear');

%data conversion
Eng_spd = Eng_Spd.Data(:,1);
Eng_trq = Eng_Trq.Data(:,1);
Eng_pwr = Eng_Pwr.Data(:,1);
Eng_fuel_rate = fuel_rate.Data(:,1);
Eng_fuel_consump = Eng_Fuel_Consump.Data(:,1);
veh_dist = Veh_Dist.Data(:,1);
veh_spd = Veh_Spd.Data(:,1);

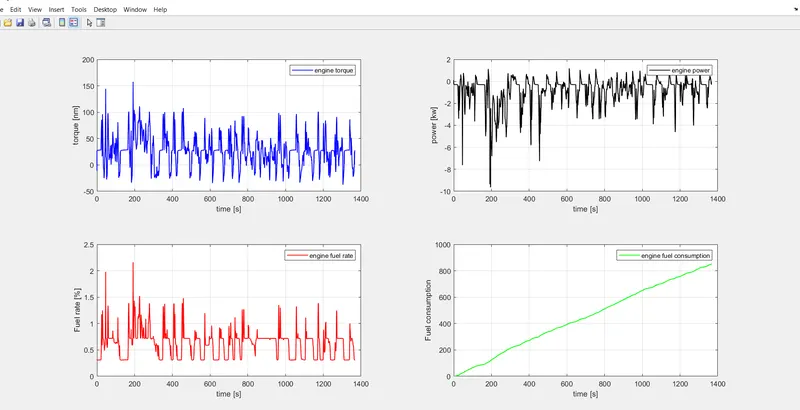
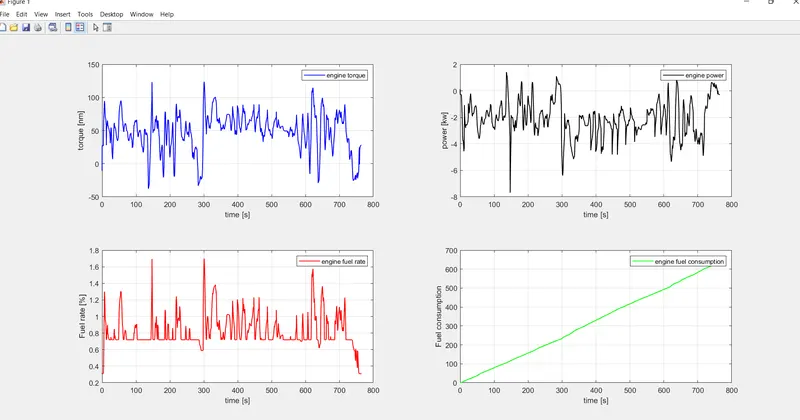
%plotting engine speed,engine torque,engine power,engine fuel rate,enginefuel consumption wrt time
figure(2)
subplot(2,2,1)
plot(Time,Eng_trq,'linewidth',1,'color','blue')
xlabel('time [s]')
ylabel('torque [nm]')
legend('engine torque')
grid on
subplot(2,2,2)
plot(Time,Eng_pwr,'linewidth',1,'color','black')
xlabel('time [s]')
ylabel('power [kw]')
legend('engine power')
grid on
subplot(2,2,3)
plot(Time,Eng_fuel_rate,'linewidth',1,'color','red')
xlabel('time [s]')
ylabel('Fuel rate [%]')
legend('engine fuel rate')
grid on
subplot(2,2,4)
plot(Time,Eng_fuel_consump,'linewidth',1,'color','green')
xlabel('time [s]')
ylabel('Fuel consumption')
legend('engine fuel consumption')
grid on

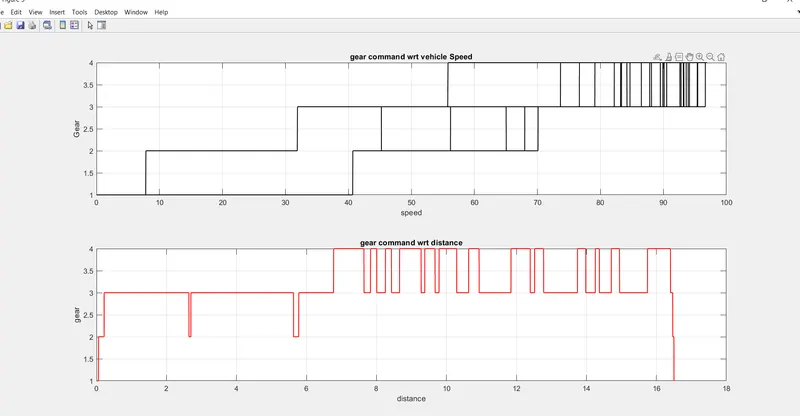
%plotting gear command with actual speed
figure(3)
subplot(2,1,1)
plot(veh_spd,Gear_Cmd,'linewidth',1,'color','k')
xlabel('speed')
ylabel('Gear')
grid on
title('gear command wrt vehicle Speed')
subplot(2,1,2)
plot(veh_dist,Gear_Cmd,'linewidth',1,'color','r')
xlabel('distance')
ylabel('gear')
grid on
title('gear command wrt distance')

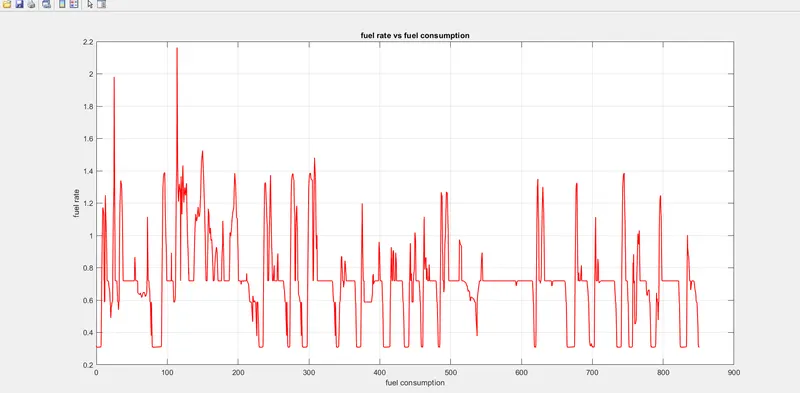
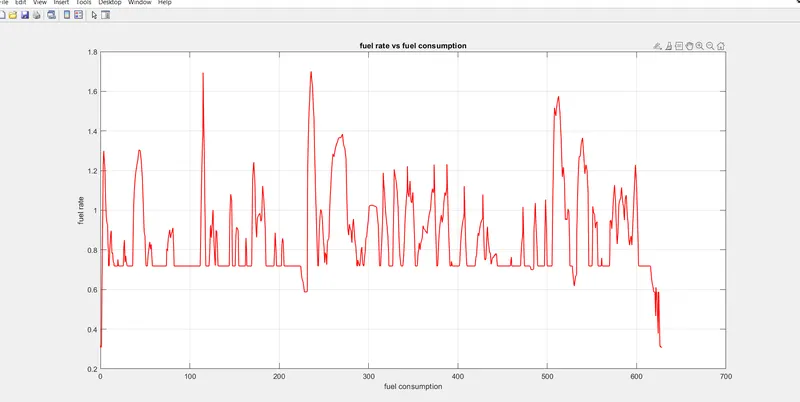
%plotting fuel rate with fuel consumption
figure(4)
plot(Eng_fuel_consump,Eng_fuel_rate,'linewidth',1,'color','r')
xlabel('fuel consumption')
ylabel('fuel rate')
title('fuel rate vs fuel consumption')
grid on

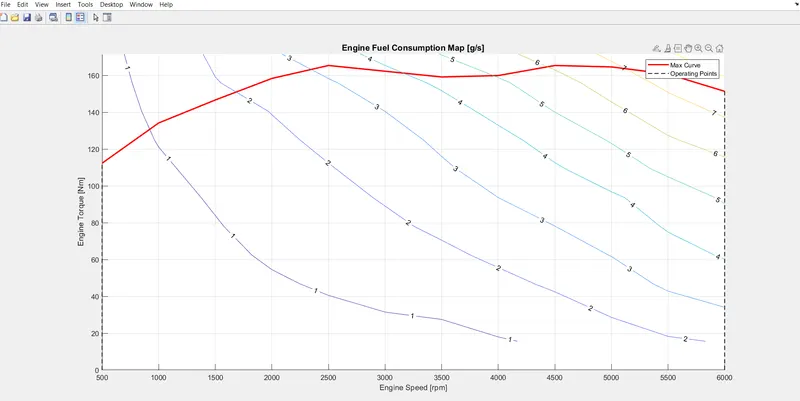
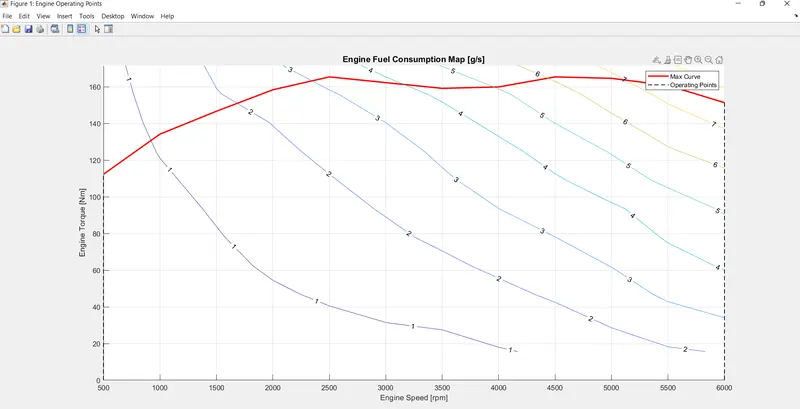
%Plotting engine operating points on engine fuel map
figure('Name','Engine Operating Points');
hold on
grid on
title('Engine Operating Points','fontsize',12);
p1=plot(Eng_map_spd*30/pi,Eng_max_trq,'linewidth',2,'color','r');
p2=line([Eng_map_spd(end)*30/pi Eng_map_spd(end)*30/pi],[0 Eng_max_trq(end)]);
set(p2,'linewidth',1,'linestyle','--','color','k');
p3=line([Eng_map_spd(1)*30/pi Eng_map_spd(1)*30/pi],[0 Eng_max_trq(1)]);
set(p3,'linewidth',1,'linestyle','--','color','k');
[c,h] = contour(Eng_map_spd'*30/pi,Eng_map_trq,Eng_fuel_map');
clabel(c,h);
xlabel('Engine Speed [rpm]');
ylabel('Engine Torque [Nm]');
title('Engine Fuel Consumption Map [g/s]');
legend([p1 p3],{'Max Curve','Operating Points'});
axis([Eng_map_spd(1)*30/pi Eng_map_spd(end)*30/pi 0 Eng_map_trq(end)]);
plots:
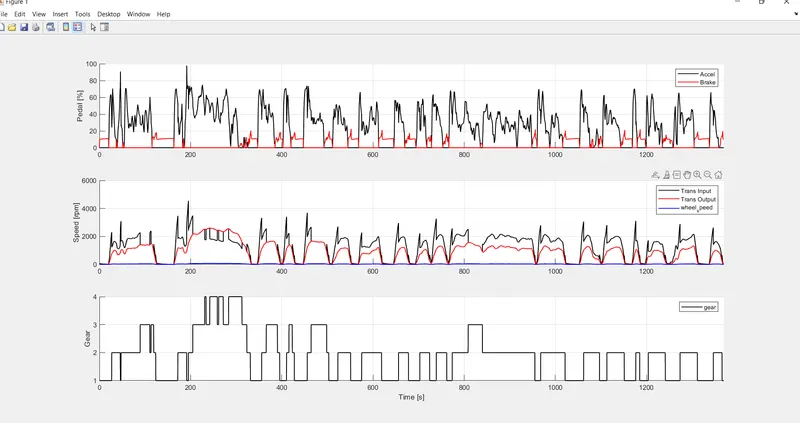
plotting between time trace transmission in/out and wheel speed and acceleration,brake pedals and gear command wrt time for both UDDS and HWFET cycles:
udds
hwfet
plotting vehicle characteristics of engine torque,engine power,engine fuel rate and engine fuel consumption wrt time
UDDS
HWFET
Plotting gear command vehicle desired with actual speed
UDDS
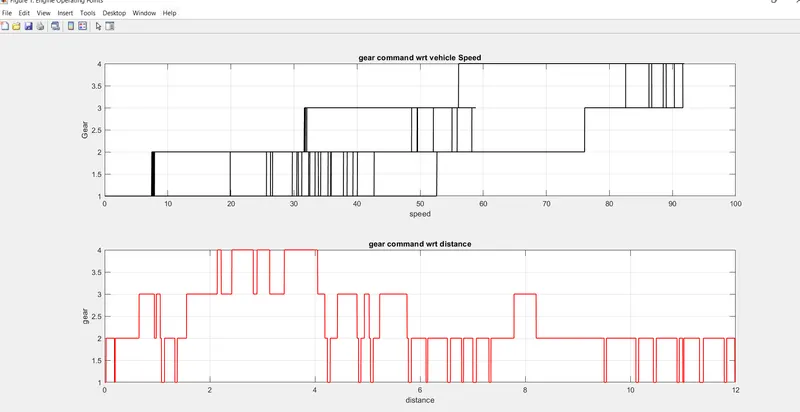
HWFET
Plotting fuel rate and fuel consumption
UDDS
HWFET
Plotting engine operating points on engine fuel map:
UDDS
HWFET
all the scopes and simulink models are compressed in zip file and uploaded