Project 1 - Parsing NASA thermodynamic data
fileparsing entire code:

close all
clear all
clc

%reading the data from file
temp = fopen('thermo.dat','r');
fgetl(temp)
temp_data = fgetl(temp)
a = strsplit(temp_data,' ');

%extracting global temp range
low = str2num(a{2});
mid = str2num(a{3});
high = str2num(a{4});
for j = 1:3
    fgetl(temp);
end
for i = 1:53
data = fgetl(temp);
a = strsplit(data,' ');
b = a{1};

%extract coefficients
line1 = fgetl(temp);
op1 = findstr(line1,'E');
coeff1 = line1(1:op1(1)+3);
coeff2 = line1(op1(1)+4:op1(2)+3);
coeff3 = line1(op1(2)+4:op1(3)+3);
coeff4 = line1(op1(3)+4:op1(4)+3);
coeff5 = line1(op1(4)+4:op1(5)+3);

a1 = str2num(coeff1);
a2 = str2num(coeff2);
a3 = str2num(coeff3);
a4 = str2num(coeff4);
a5 = str2num(coeff5);

line2 = fgetl(temp);
op2 = findstr(line2,'E');
coeff6 = line2(1:op2(1)+3);
coeff7 = line2(op2(1)+4:op2(2)+3);
coeff8 = line2(op2(2)+4:op2(3)+3);
coeff9 = line2(op2(3)+4:op2(4)+3);
coeff10 = line2(op2(4)+4:op2(5)+3);

a6 = str2num(coeff6);
a7 = str2num(coeff7);
a8 = str2num(coeff8);
a9 = str2num(coeff9);
a10 = str2num(coeff10);

line3 = fgetl(temp);
op3 = findstr(line3,'E');
coeff11 = line3(1:op3(1)+3);
coeff12 = line3(op3(1)+4:op3(2)+3);
coeff13 = line3(op3(2)+4:op3(3)+3);
coeff14 = line3(op3(3)+4:op3(4)+3);

a11 = str2num(coeff11);
a12 = str2num(coeff12);
a13 = str2num(coeff13);
a14 = str2num(coeff14);

%extract local temp
mlt = a(end-1);
midlt = str2double(mlt);
hlt = a(end-2);
highlt = str2double(hlt);
llt = a(end-3);
lowlt = str2double(llt);

%plot specific heat vs temp
T = linspace(lowlt,highlt,100);
R = 8.314;
[cp] = specific_heat(R,a1,a2,a3,a4,a5,a6,a7,a8,a9,a10,a11,a12,a13,a14,midlt,T);
figure(1)
plot(T,cp,'linewidth',3,'color','b')
xlabel('temperature')
ylabel('specificheat')
title(b)

%plot enthalpy vs temp
[ h ] =enthalpy(a1,a2,a3,a4,a5,a6,a7,a8,a9,a10,a11,a12,a13,a14,midlt,T,R);
figure(2)
plot(T,h,'linewidth',3,'color','g')
xlabel('temperature')
ylabel('enthalpy')
title(b)

%plot entropy vs temp
[s] = entropy(a1,a2,a3,a4,a5,a6,a7,a8,a9,a10,a11,a12,a13,a14,midlt,T,R);
figure(3)
plot(T,s,'linewidth',3,'color','y')
xlabel('temperature')
ylabel('entropy')
title(b)

% mkdir(b)
% cd(b)
% saveas(1,'specific heat','jpg')
% saveas(2,'enthalpy','jpg')
% saveas(3,'entropy','jpg')
% cd ..
[mw]=mol_weight(b);
end
fclose(temp);

specific heat function:
function [cp] = specific_heat(R,a1,a2,a3,a4,a5,a6,a7,a8,a9,a10,a11,a12,a13,a14,midlt,T)
for i = 1:100
    if(T(i)>midlt)
        cp(i) = R*(a1+a2*T(i))+(a3*T(i)^2)+(a4*T(i)^3)+(a5*T(i)^4);
    else
        cp(i) = R*(a8+(a9*T(i))+(a10*T(i)^2)+(a11*T(i)^3)+(a12*T(i)^4));
    end
end
end

enthalpy function:
function [h] = enthalpy(a1,a2,a3,a4,a5,a6,a7,a8,a9,a10,a11,a12,a13,a14,midlt,T,R)
for i = 1:100
    if(T(i)>midlt)
        h(i) = (a1+a2*T(i)/2+a3*T(i)^2/3+a4*T(i)^3/4+a5*T(i)^4/5+a6/T(i))*(T(i)*R);
    else
        h(i) = (a8+a9*T(i)/2+a10*T(i)^2/3+a11*T(i)^3/4+a12*T(i)^4/5+a13/T(i))*(T(i)*R);
    end
end
end

entropy function:
function [s] = entropy(a1,a2,a3,a4,a5,a6,a7,a8,a9,a10,a11,a12,a13,a14,midlt,T,R)
for i = 1:100
    if(T(i)>midlt)
        s(i) = (a1*log(T(i))+a2*T(i)+a3*T(i)^2/2+a4*T(i)^3/3+a5*T(i)^4/4+a7)*R;
    else
        s(i) = (a8*log(T(i))+a9*T(i)+a10*T(i)^2/2+a11*T(i)^3/3+a12*T(i)^4/4+a14)*R;
    end
end
end

molecular weight:
function [mw]=mol_weight(data)
element=['N','H','C','O','A'];
atm_wt=[14,1,12,16,40];
mw=0;
for i=1:length(data)
    for j=1:length(element)
        if  strcmp(data(i),element(j))
            mw=atm_wt(j)+mw;
            pos=j;
        end
    end
    k=str2num(data(i));
    if k>1
        mw=mw+atm_wt(pos)*(k-1);
    end
end
fprintf('%s species %s %f\n',data,'mol_mass',mw);
end
explanation:
parsing a file means reading the data from the file and applying some transformations to it and easily stored and manipulated the data
the file THERMO.dat contains coefficients required to solve specific heat, enthalpy, entropy
1.initially to read the data we use fopen command and fgetl command to extract the data from one line to another line and strsplit command to split the data
%reading the data from file
temp = fopen('thermo.dat','r')
fgetl(temp)
temp_data = fgetl(temp)
a = strsplit(temp_data,' ')
2.extracting the global temperature ranges using str2num so that string characters arrey is converted into numbers array
low = str2num(a{2})
mid = str2num(a{3})
high = str2num(a{4})
3.for finding all the 53 elements we create for loop to solve 53 elements
for i = 1:53
data = fgetl(temp)
a = strsplit(data,' ')
b = a{1}
extraction of coefficients for this we use findstr command to find string character E position from this we can access the local temperature esaily from this we have to find coefficients of line1 using fgetl command and also change the string characters to numbers
line1 = fgetl(temp)
op1 = findstr(line1,'E')
coeff1 = line1(1:op1(1)+3)
coeff2 = line1(op1(1)+4:op1(2)+3)
coeff3 = line1(op1(2)+4:op1(3)+3)
coeff4 = line1(op1(3)+4:op1(4)+3)
coeff5 = line1(op1(4)+4:op1(5)+3)
a1 = str2num(coeff1)
a2 = str2num(coeff2)
a3 = str2num(coeff3)
a4 = str2num(coeff4)
a5 = str2num(coeff5)
in the same way for line 2 and line 3 also we can extract the coefficients
4.for extracting low mid and high temperature we use str2double command for string to double precesion number
mlt = a(end-1)
midlt = str2double(mlt)
hlt = a(end-2)
highlt = str2double(hlt)
llt = a(end-3)
lowlt = str2double(llt)
5.plot between specific heat and temperature using linspace we have to take lowtemp and high temp in intervals of 100
we have to take function of specific heat and plot between cp and temperature
T = linspace(lowlt,highlt,100)
R = 8.314;
[cp] = specific_heat(R,a1,a2,a3,a4,a5,a6,a7,a8,a9,a10,a11,a12,a13,a14,midlt,T)
figure(1)
plot(T,cp,'linewidth',3,'color','b')
xlabel('temperature')
ylabel('specificheat')
title(b)
specific heat function:
function [cp] = specific_heat(R,a1,a2,a3,a4,a5,a6,a7,a8,a9,a10,a11,a12,a13,a14,midlt,T)
for i = 1:100
if(T(i)>midlt)
cp(i) = R*(a1+a2*T(i))+(a3*T(i)^2)+(a4*T(i)^3)+(a5*T(i)^4);
else
cp(i) = R*(a8+(a9*T(i))+(a10*T(i)^2)+(a11*T(i)^3)+(a12*T(i)^4));
end
end
end
In the same way we have to plot for enthalpy and entropy using seperate function for each of this
6.after finding plots we have to find molecular weight we have to write function for the elements N,H,C,O,A using strcmp command we compare the other elements to get the molecular weight
molecular weight function:
function [mw]=mol_weight(data)
element=['N','H','C','O','A'];
atm_wt=[14,1,12,16,40];
mw=0;
for i=1:length(data)
for j=1:length(element)
if strcmp(data(i),element(j))
mw=atm_wt(j)+mw;
pos=j;
end
end
k=str2num(data(i));
if k>1
mw=mw+atm_wt(pos)*(k-1);
end
end
fprintf('%s species %s %f\n',data,'mol_mass',mw);
end
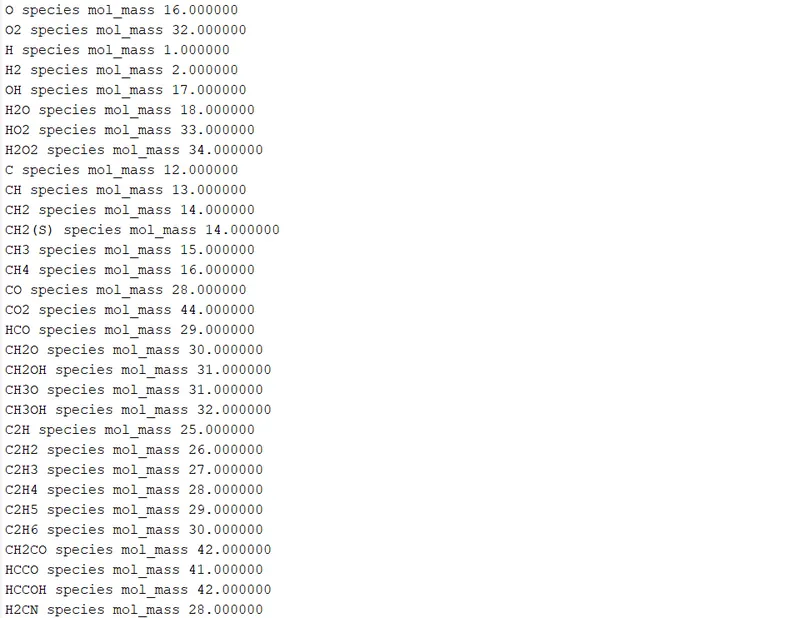
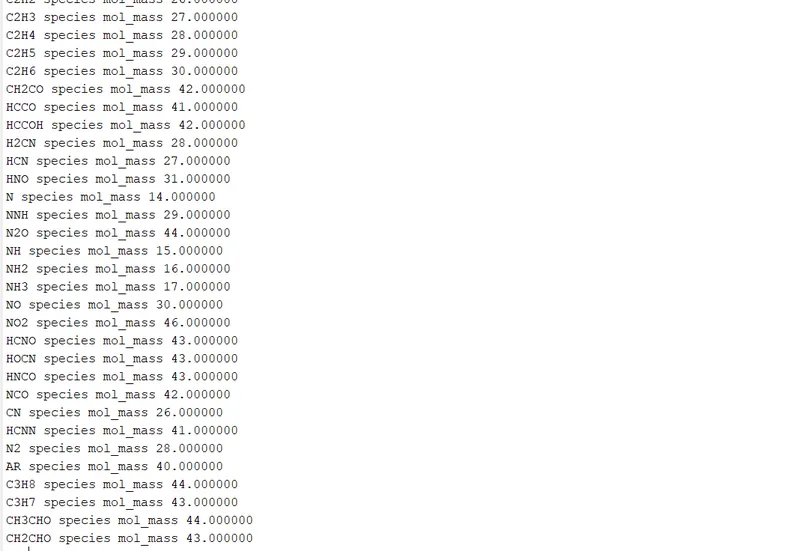
fprintf to read the all 53 molecular weights in a row
7.'mkdir' command is used for creating folders for all the 53 elements 'cd' is used for change in directory using 'save as' command to save the plots
mkdir(b)
cd(b)
saveas(1,'specific heat','jpg')
saveas(2,'enthalpy','jpg')
saveas(3,'entropy','jpg')
cd ..

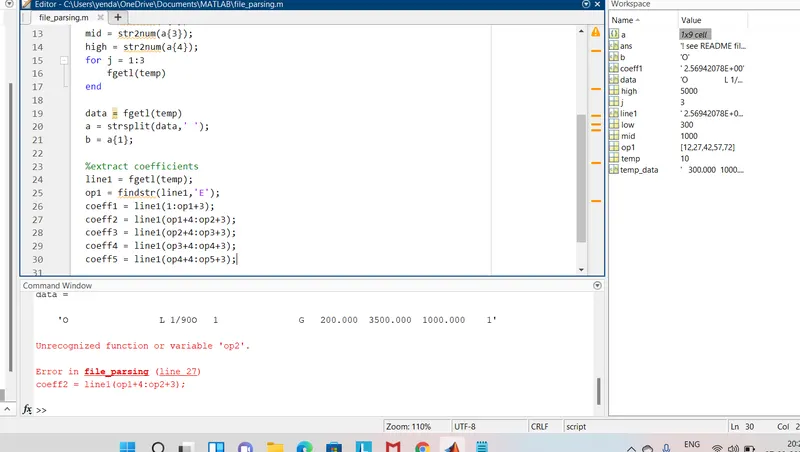
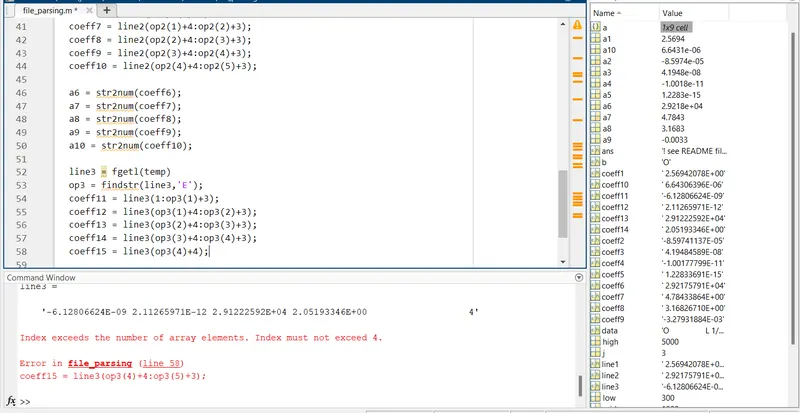
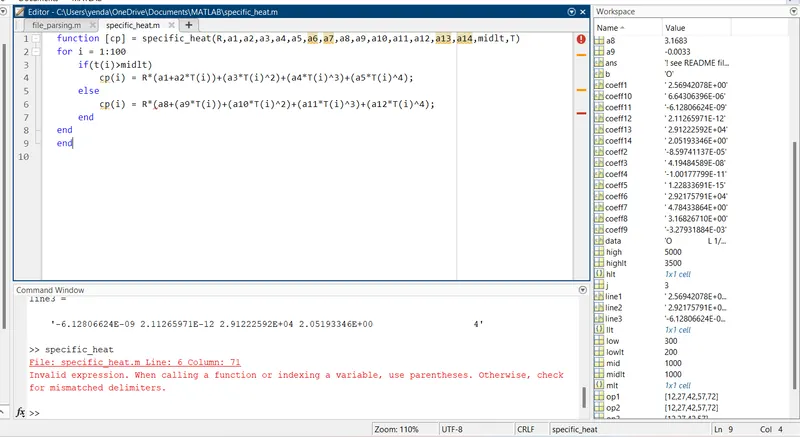
errors:
reference link:
https://skill-lync.com/student-projects/Parsing-NASA-thermodynamic-data-30668