Project 1
AIM AND INTRODUCTION :
To apply the dead loads, IRC live loads, Earthpresuure loads, wind loads, seismic loads for the given bridge structure at Ahmedabad metro rail project.
- Dead loads :
The dead loads of the structure are permanent loads that remain relatively over a long period of time.
The dead loads are self-weight of the structural elements like a beam, deck slab, column, wall, etc.
- IRS live loads :
The IRS live loading classified as
- metro rail loading,
- broad gauge loading,
- electric train loading,
- Guage A and Guage B loading.
Metro rail loading :
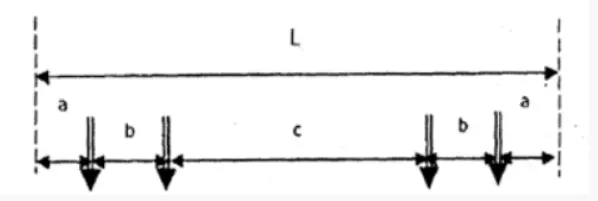
Axle load will be maximum of 17 tons, max number of cars are 6 nos,
The wheel configuration :
Length : a = 2150mm
b = 2200mm
c = 12400mm.
over all length of car is 21100mm.
Load generation = (length of vehicle + span ) / increment of loads.
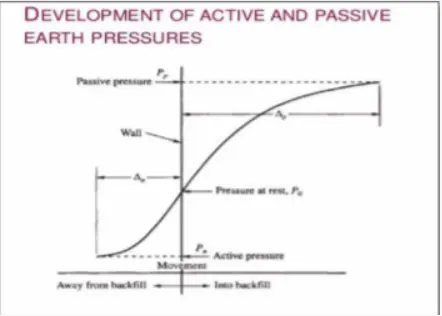
- Earth pressure loads :
1. Active Earth pressure.
Active Earth Pressure states that the wall moves away from the backfill, which is the soil that pushes the wall.
2. Passive Earth pressure.
Passive Earth pressure states that the wall moves towards the backfill, in this the structure will fail by sliding.
3. Earth pressure at Rest.
The vertical structure at rest and there will not be any displacement.
- wind loads :
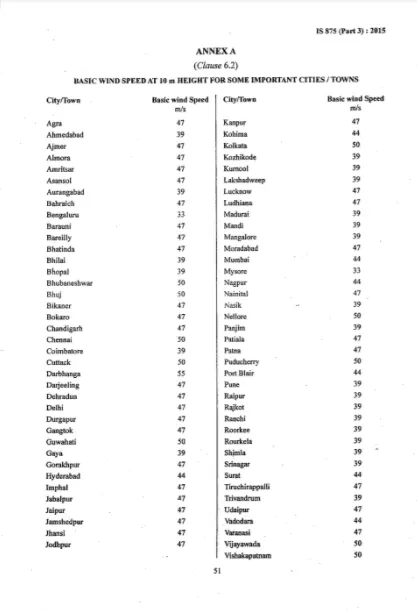
The wind speed is classified in to 5 different zones based on their location '
1.33 m/s
2.33-39 m/s
3.39 - 44 m/s
4.44 - 47 m/s
5.over 50 m/s
Design wind speed can be calculated using formula vz = vb * k1* k2* k3* k4
wind pressure : pz = 0.6 * vz * vz
- Seismic loads :
Seismic loads are classified based on 4 types of zone,
1. zone 2. (low)
2. zone 3. (moderate)
3. zone 4. (severe)
4. zone 5. ( very severe)
code book : IS 1893 part 3 for bridges and retaining walls
PROCEDURE :
- In this project we are going to apply the dead loads, live loads, earth pressure loads, wind loads, and seismic loads.
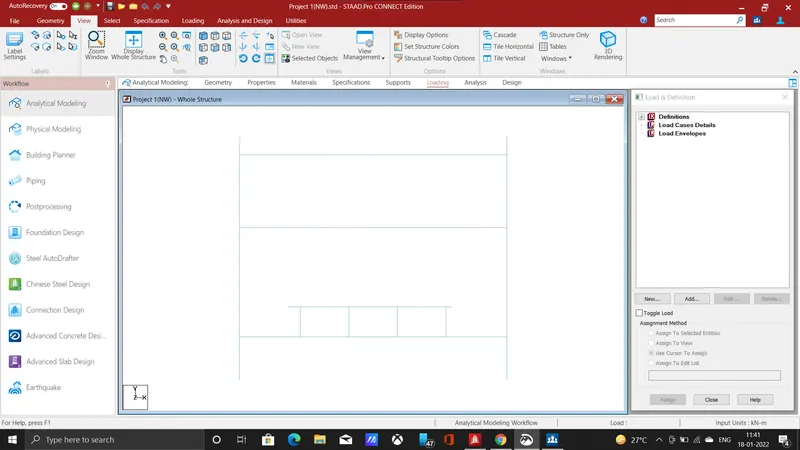
- This is the Front view of the Ahmedabad metro structure, which has 3 levels, the floor level, concourse level, platform level.
-
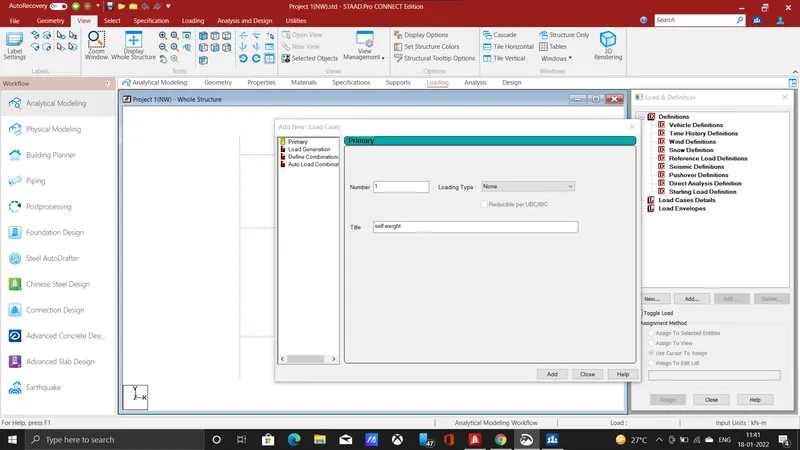
- first, we need to give a self-weight loading for the structure, click on load case details add a new load case, in that load case click on self weight thus the load gets added
-
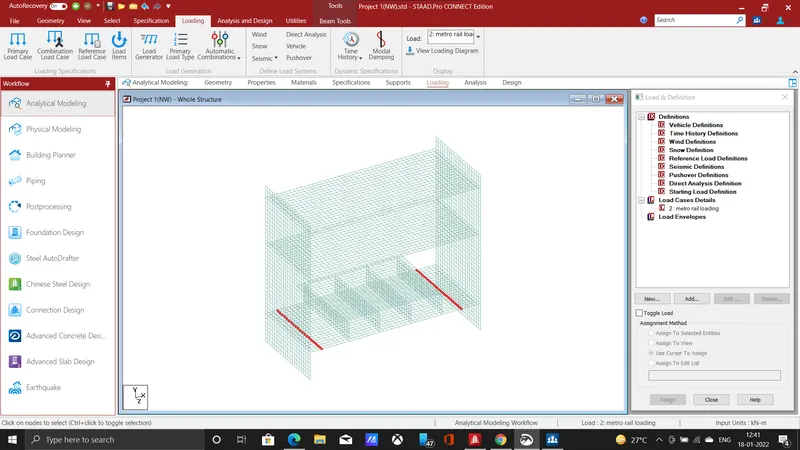
- After adding self weight load we need to give IRS METRO RAIL loading to the structure, the metro rail loading is need to be added at platform level.
- click on the load case details click add, enter as metro rail loading.
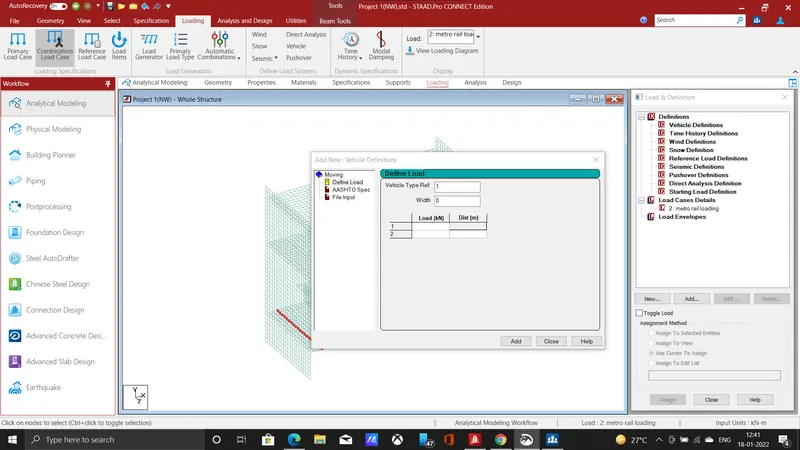
- In the definitions tab click on vehicle loading a dialog box will open and we need to define the moving load.
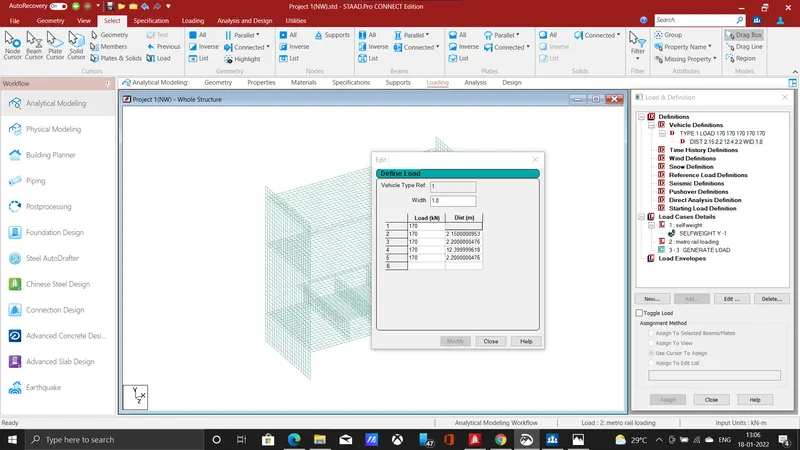
- In the load and distance column enter the values specified for metro rail loading which has constant loading of 170kN and distance varies accordingly with axle.
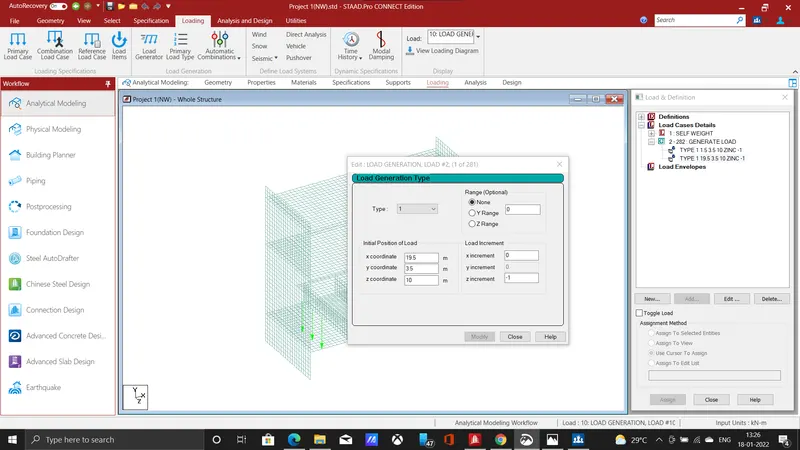
- after specifying the load and distance we need to enter the x,y,z co-ordinates to specify the load position.
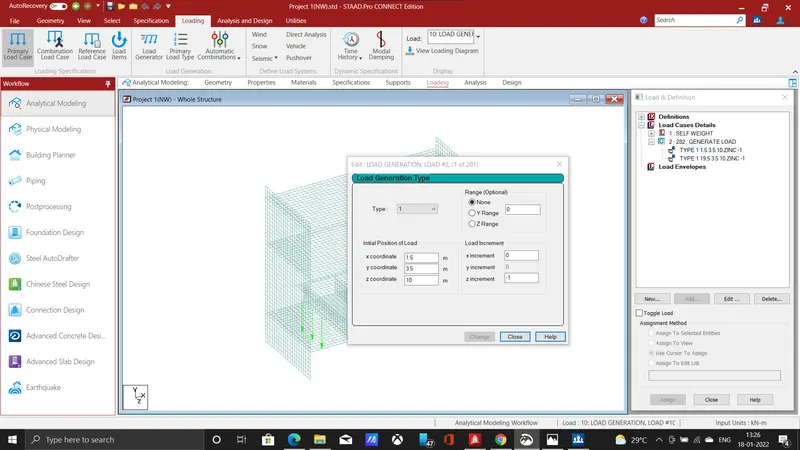
- similarly, specify the position of load on other side , hence the IRS metro rail loading is given to the structure
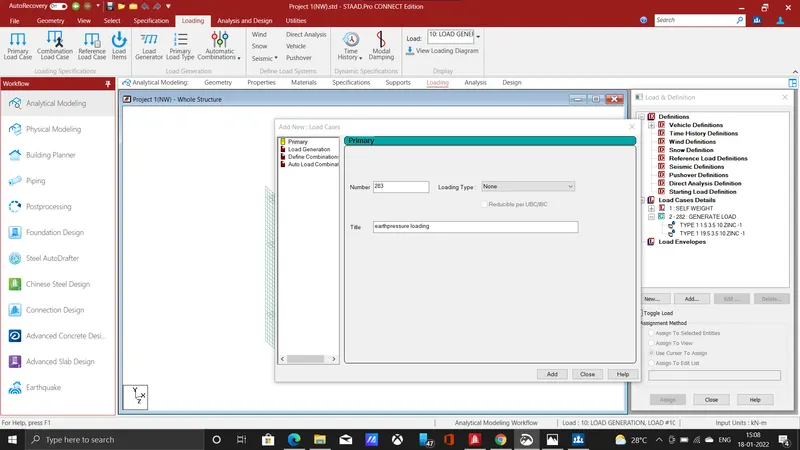
- next loading is Earth pressure loading, add a new load case detail, click on that and give title as earth pressure click add and close it.
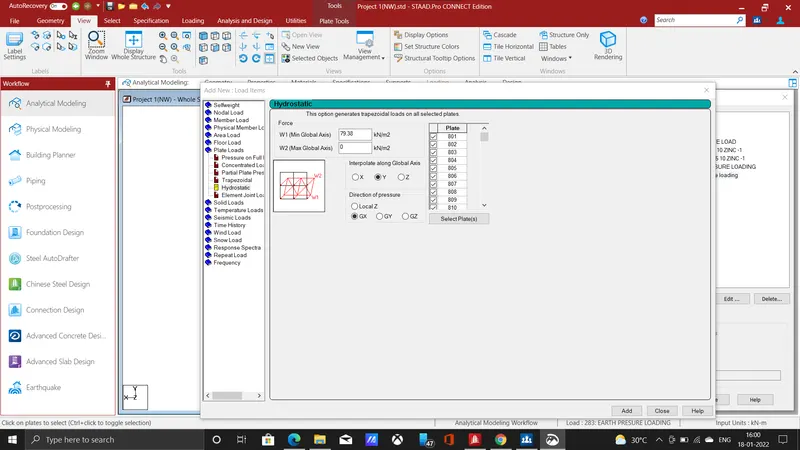
- The next step is to select plates by clicking hydrostatics in the plate load , select the needed plates that experiences earth pressure loads, click on interpolate along y direction and direction of pressure as global x direction
-
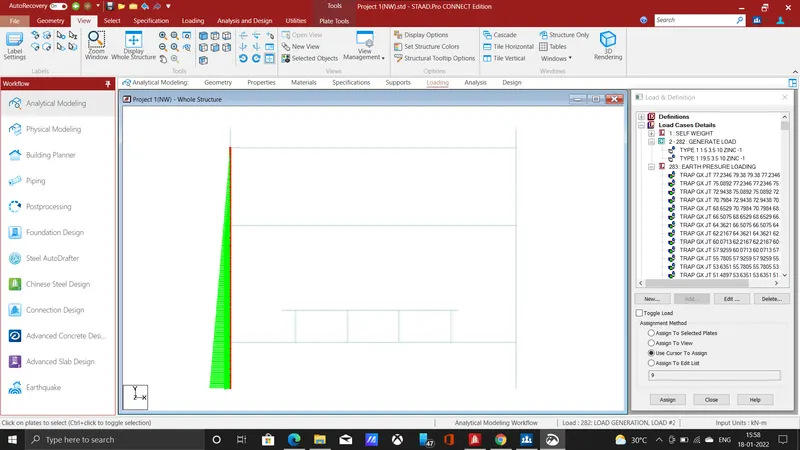
- The earth pressure loading is applied in one direction towards the positive x direction the pressure intensity value is given as 79.38 KN /m2, and 0 KN/m2.
- k = ka * gamma * height
- k = 12.6 * 0.35 * 18
- k = 79.38
- The height 12.6 is taken from the given diagram up to roof slab height is taken.
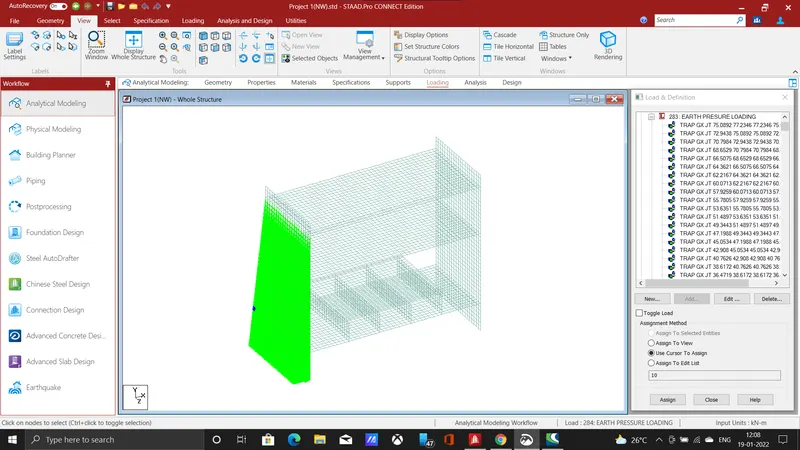
- The above image shows the earth pressure loads in x direction where the intensity will be more at bottom and will be less while coming up.
-
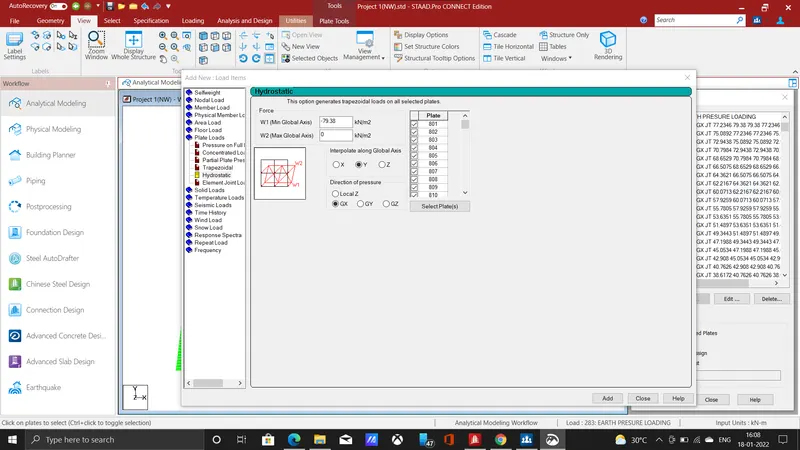
- similarly apply load in opposite direction , that is negative x direction enter the w1 values as -79.39 the negative value indicates the pressure acting opposite to previous load.
- and enter the w2 value as 0 that is maximum global axis, click on interpolate along y axis, and the direction of pressure in global x direction.
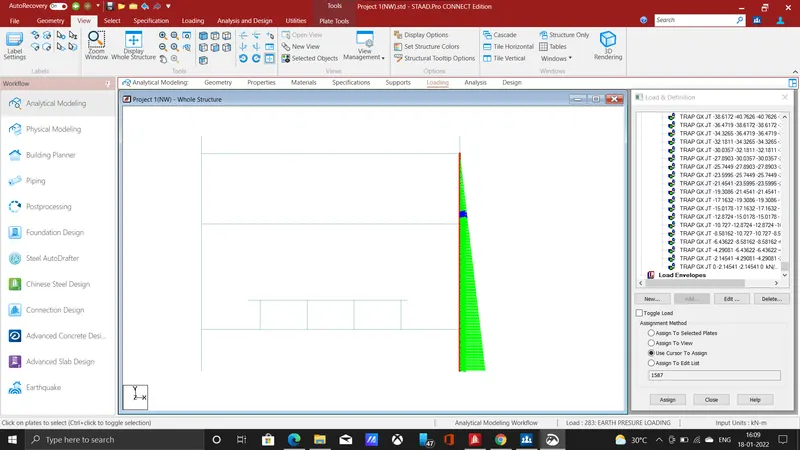
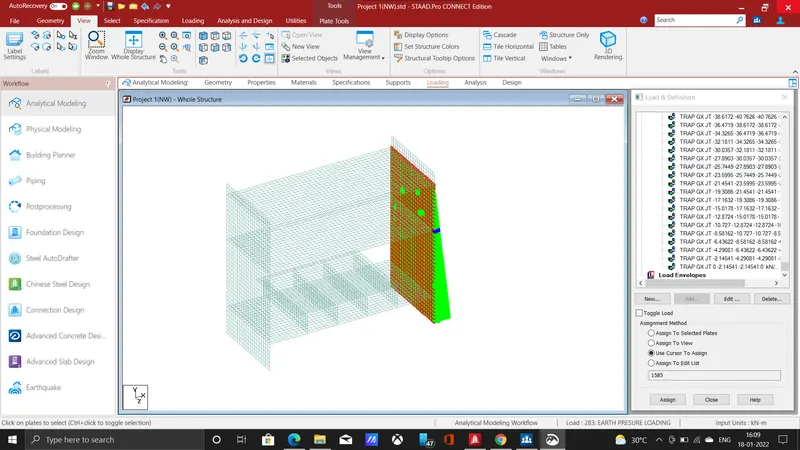
- The above two images shows that load in - x direction one is front view and nexrt one is display whole structure, while clicking on hydrostatic loading the staad will itself calculate and assign loads accordingly with height , so the load intensity varies with increase in height.
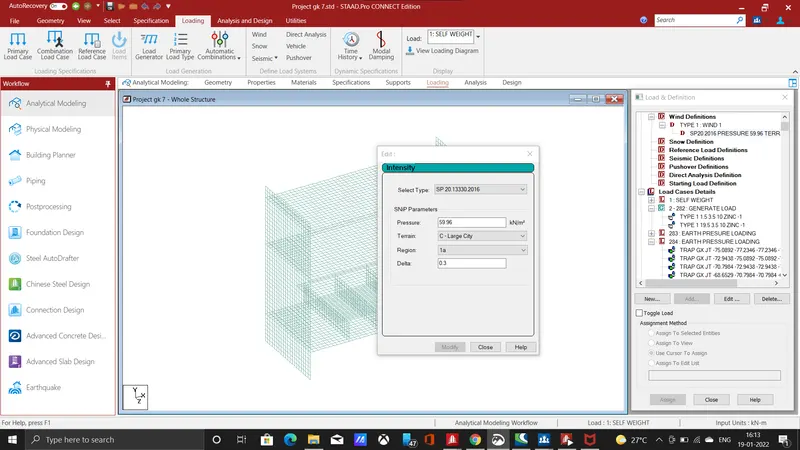
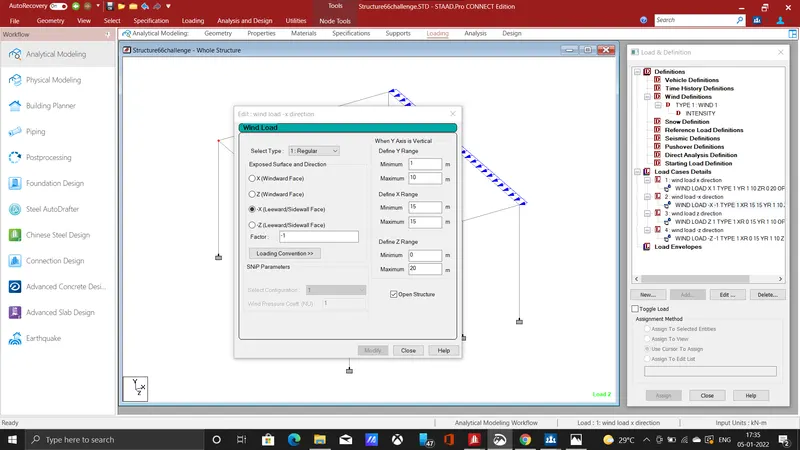
- The wind load is applied for the practising purpose, there will not any wind load effect in the given underground metro station, click on definitions, then add wind definitions select the type as sp 2016 which is the Indian code standard, enter the calculated intensity value, select the terrain as large city then click add.
- add a new load case with title wind load.
- click on exposed direction +x direction windward side and define the range
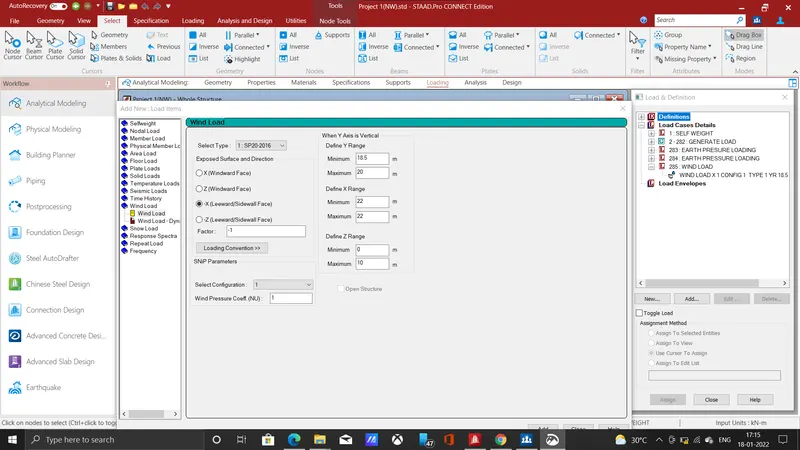
- like above click on leeward side and enter factor value as negative and define the range for x,y and z then click add.
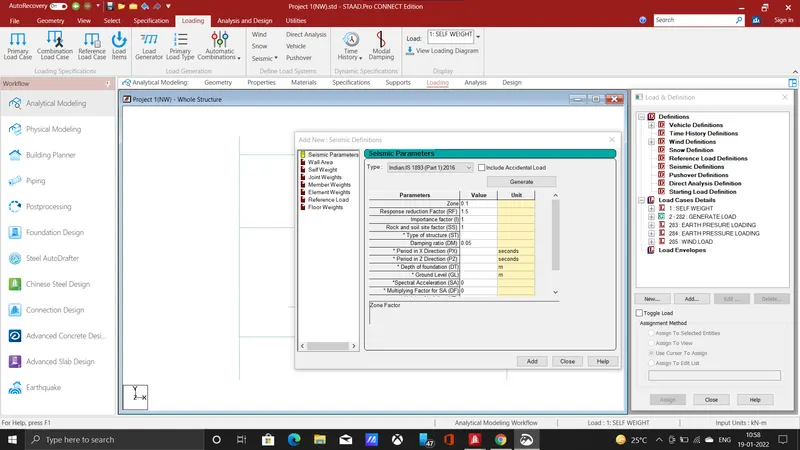
- Next we need define seismic load to the structure, click on definitions adds seismic definition select the type as Indain 1893 2016 part 1, then click generate.
- a new tab will open where you can slelct the city Ahmedabad, and then select it as important building so importance value will be get selected, then click add.
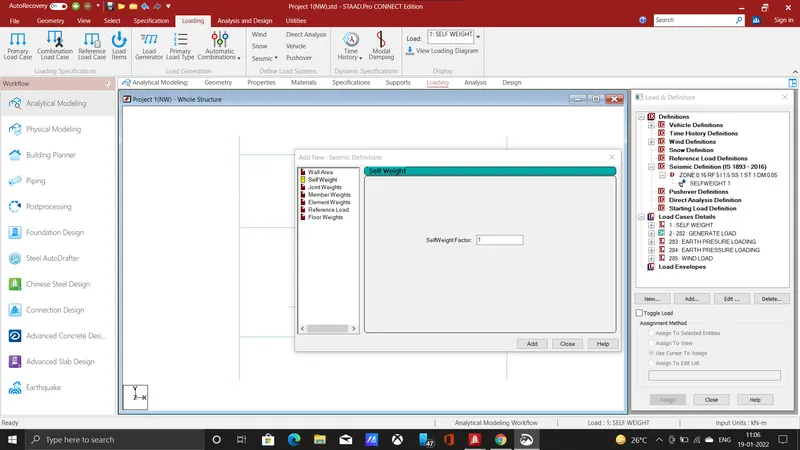
- click on the self weight and add it to the seismic definitions.
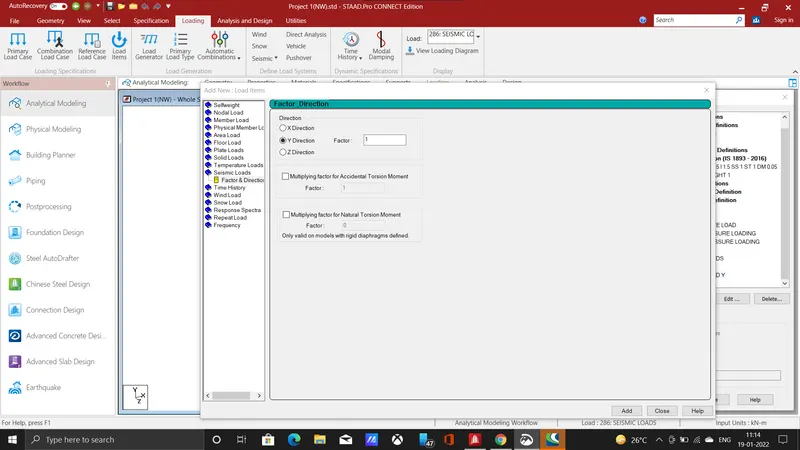
- After that add new case details, click add select seismic loads, click on factor direction x, y, z respectively to generate seismic loads.
- After loading, click on analysis and design, select run analysis command, after analysis enter into post-processing mode.
RESULT:
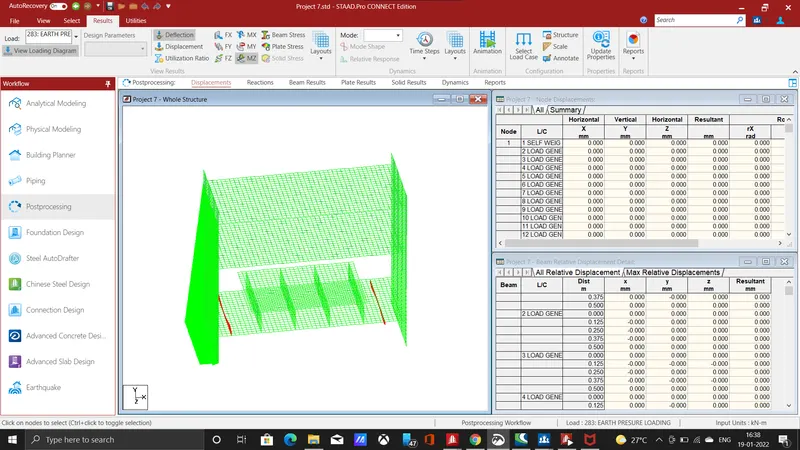
- after entering postprocessing mode, click on results tab select earth pressure loads and click moment MZ, the moment in the rectangular beam is shown above.
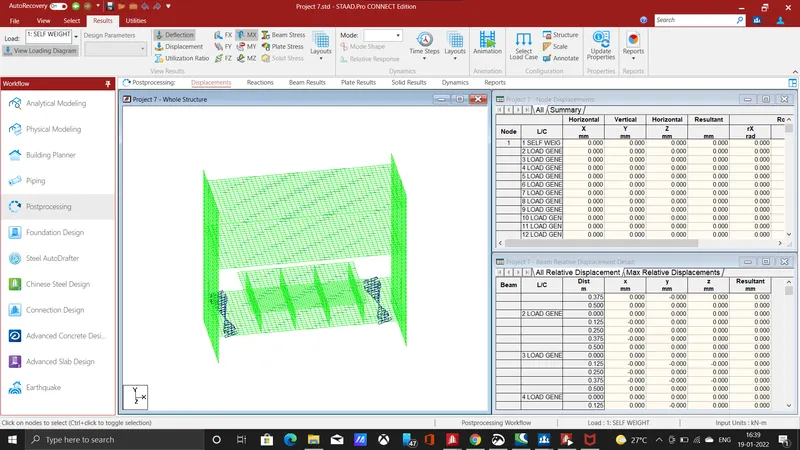
- The above shown moment diagram for the rectangular beam is due to self weight of the structure, The moment is along x direction, click on MX in results tab.
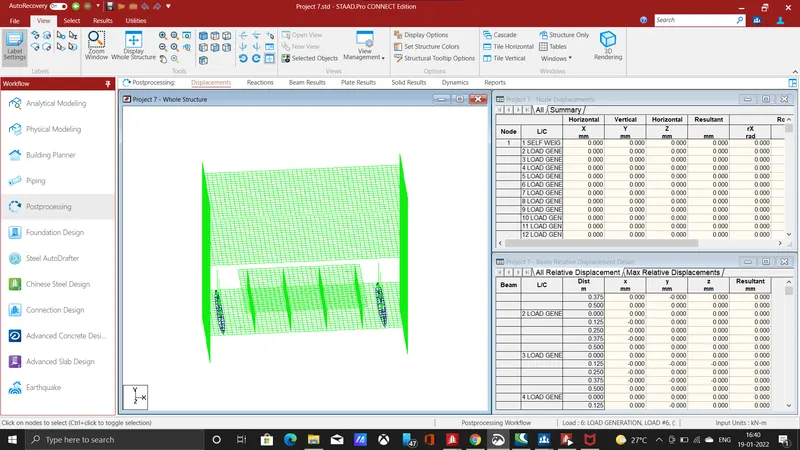
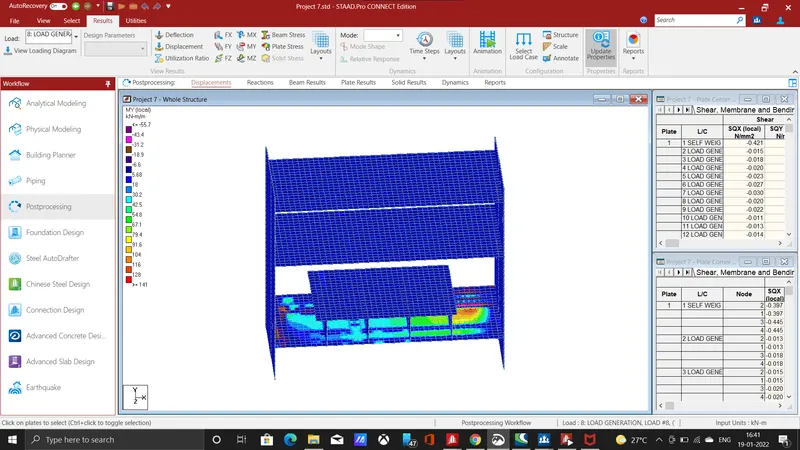
- click on the plate results for the metro rail loading, in the load tab click generation select the load, and select plate stress in the post-processing tab the value of maximum and minimum stresses is showed in contour image
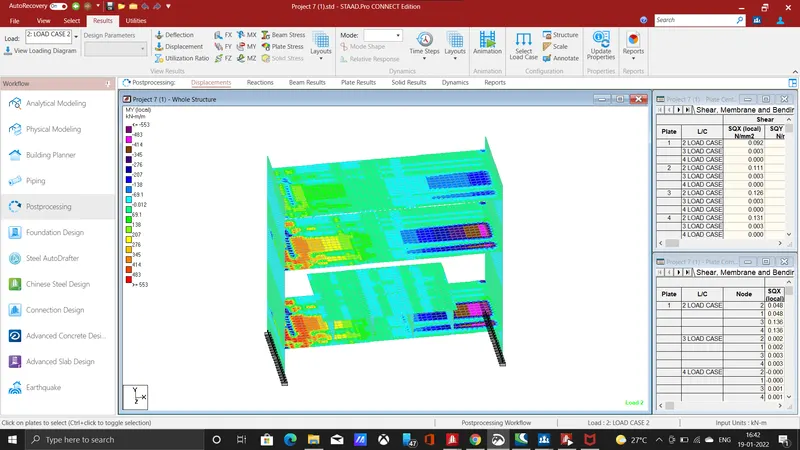
- The above one is a contour image for seismic loading of load case 2, which shows maximum and minimum load cases.
- Hence the dead load, live load, earth pressure, seismic loading has been applied and their load analysis has been done.