Project 1
1)Simulink model:
The above flowchart may be implemented using the simulink model.The basic battery and fuel cell stack blocks can be used for the implementation.
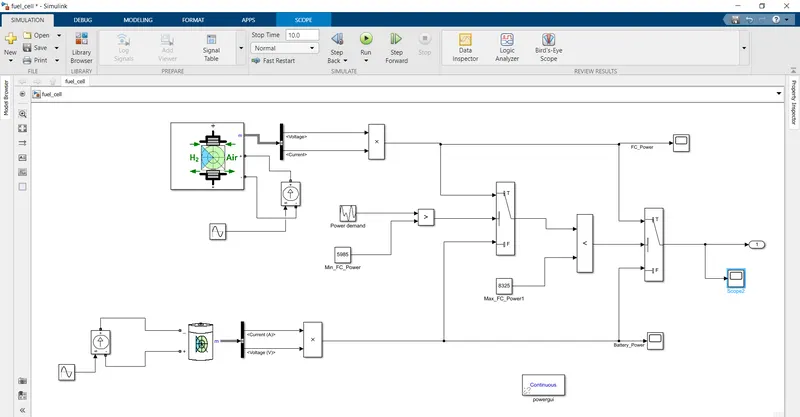
The input is the power demand which is given as a random wave generator.The input is then compared with with the minnimum FC power and the corresponding action of using battery or fuel celll is decided using the switch block.The ooutput is then compared with the maximim FC power and the result is used to again decide wheter battery or fuel cell power is to be used.The outptu is seen in the scope.
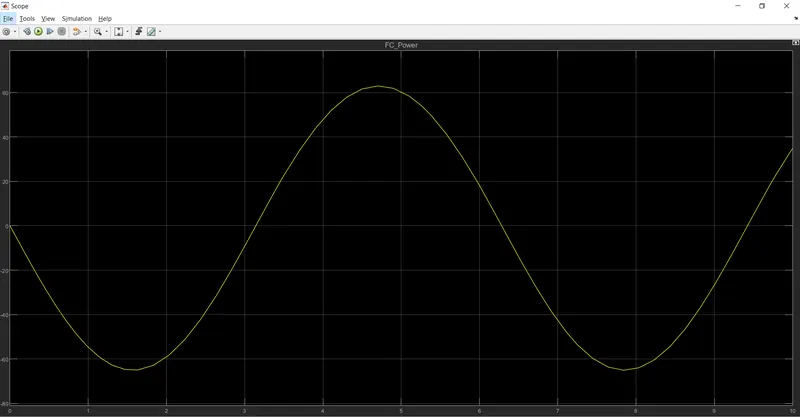
The fuel cell output power is given in the above graph .The amplitude of the power rises rapidly and follow the [ath of the input sin wave given to it.
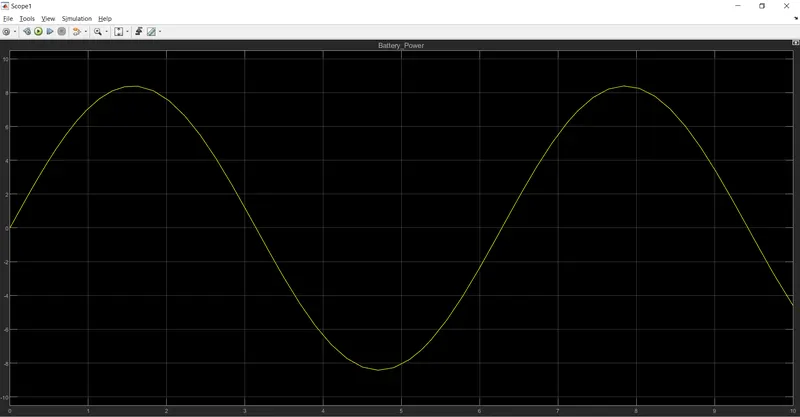
The output of the battery is given in the above graph.The amplitude is low as compared to that of the fuel cell.The path of the power follows the input sine wave given as the fuel cell power with lower amplitude.