Project 1
Aim: To analyze the various performance characteristics and operating points of UDDS and HWFET cycles
Objectives:
- Tabulate the fuel economy numbers (kmpl) for UDDS and HWFET cycle. This forms the baseline numbers for comparing with the future hybrid version.
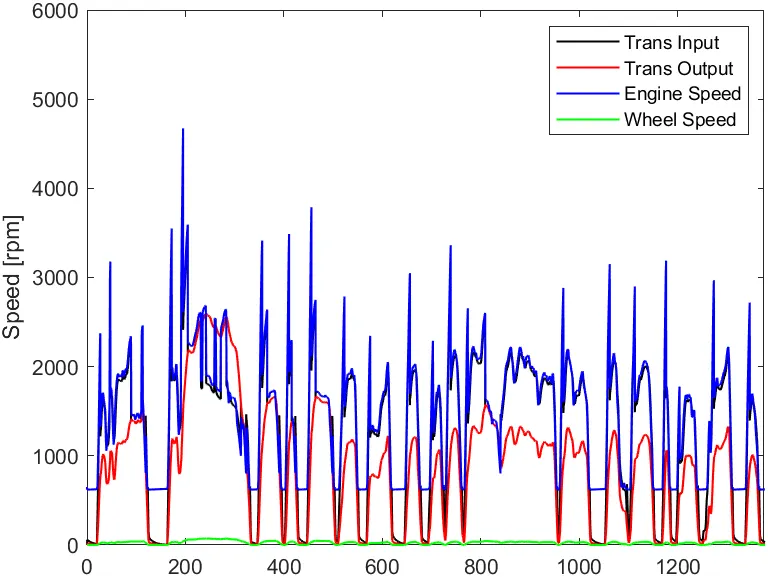
- Plot the time trace for engine, transmission input, transmission output, and wheel speed on one plot.
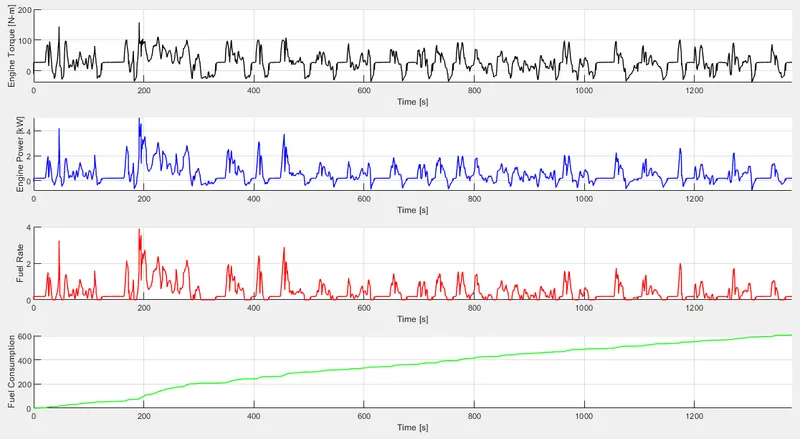
- Plot engine torque, engine power, fuel rate, and fuel consumption using subplots.
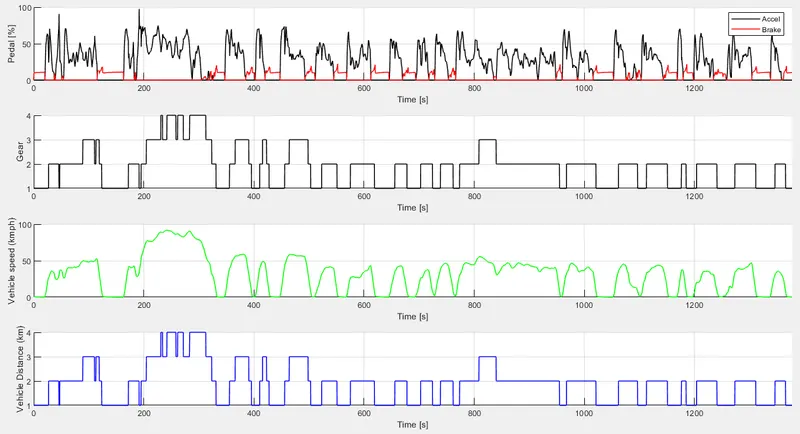
- Plot accelerator and brake pedal, gear command, vehicle desired and actual speed, vehicle distance using subplots.
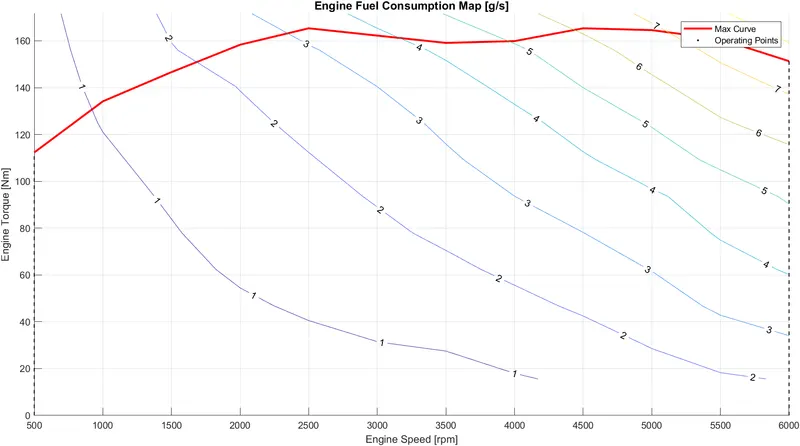
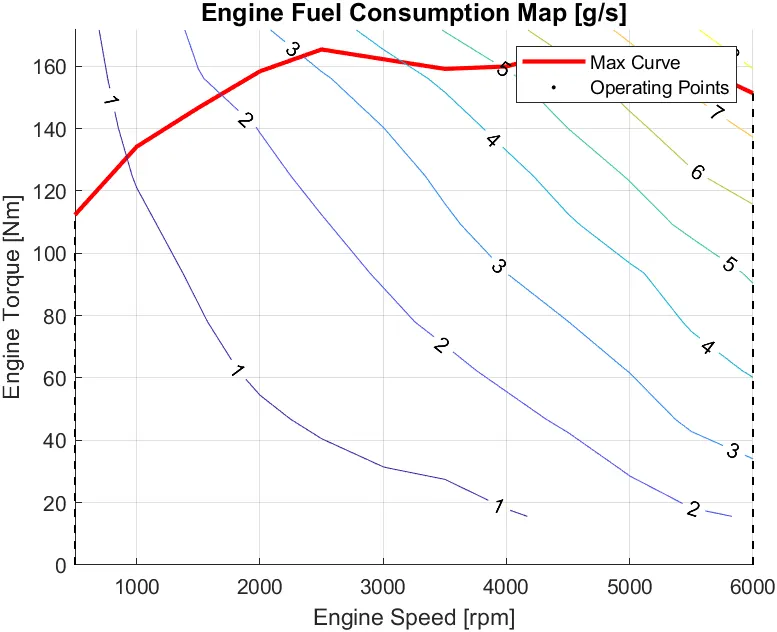
- Plot the engine operating points on the engine fuel map.
- Write down appropriate brief comments on each of these plots, describing the vehicle behavior throughout the
- Generate the plots for both drive cycles
Procedure:
- Load the Project1 folder as the Current Folder in Matlab.
- Run the “Project1_InitFile.m” Matlab script for drive cycle 1 i.e. UDDS
Code of the 'Project1_IntiFile':
%%%%%%%%%%%%%%%%%%%%%%%%%%%%%%%%%%%%%%%%%%%%%%%%%%%%%%%%%%%%%%%%%%%%%
%% Skill-Lync -> Hybrid Drives Development
% Project 1 - Conventional Vehicle Model
% By - Ullekh Gambhira

% Description:

%% Initialization File
% Initialization file for loading the variables for the Conventional vehicle simulation model

%% Vehicle Parameters
M = 1500;       % Vehicle weight [kg]
Cr = 0.015;     % Rolling resistance coefficient
Rw = 0.35;      % Rolling radius [m]
Cd = 0.33;      % Drag coefficient
Af = 2;         % Frontal area [m2]
rhoa = 1.225;   % Air density [kg/m3]
Vwind = 0;      % Wind velocity [kmph]
g = 9.81;       % Gravitational acceleration [m/s2]
theta = 0;      % Slope [deg]
myu_road_tire = 1; % Coefficient of friction between tire - road interface

%% Powertrain Parameters
FDR = 3.73;                         % Final Drive Ratio / Diff Ratio
DiffEff = 0.99;                     % Differential efficiency (assumed independent of operating conditions)

NumGear = 4;                        % Number of gears in transmission
TransGear = [1:NumGear];            % Transmission Gears
TransRatio = [3.06, 1.62, 1, 0.7];  % Corresponding Transmission ratios
TransEff = 0.90;                    % Transmission efficiency (assumed independent of operating conditions)

TC_SR = [0, .5, .6, .7, .8, .87, .92, .94, .96, .97, 1];   % Torque Converter Speed Ratio (Matlab default) -> TurbSpd/PumpSpd
TC_TR = [2.232, 1.5462, 1.4058, 1.2746, 1.1528, 1.0732, 1.0192, 1, 1, 1, 1];   % Torque Converter Torque Ratio (Matlab default) -> TurbTrq/PumpTrq
TC_Cf = 1e-4 * [.72558, .66322, .63463, .59042, .51331, .4144, .29287, .22444, .12186, .04386, 0]; % Torque Converter Capacity Factor (Matlab default) -> PumpTrq/PumpSpd^2 [Nm/rpm^2]

load Vehicle_Data/Engine_data_1_9L_Saturn_95kW
load Vehicle_Data/Trans_Shift_map

%% Driver Parameters
Kp = 10;                    % P gain for driver PI model
Ki = 1;                     % I gain for driver PI model
Drive_Cycle_Select = 1;     % Drive cycle selection

% Drive cycle values in m/s

if Drive_Cycle_Select == 1
    load DriveCycles/UDDS;

elseif Drive_Cycle_Select == 2
    load DriveCycles/HWFET;

elseif Drive_Cycle_Select == 3
    load DriveCycles/FTP;

elseif Drive_Cycle_Select == 4
    load DriveCycles/US06;

elseif Drive_Cycle_Select == 5
    load DriveCycles/NEDC;

elseif Drive_Cycle_Select == 6
    load DriveCycles/WLTP;

end

time_end = cyc_time(end);
vel_end = cyc_vel(end);- After loading the variables into the workspace, now open the Simulink model given
Vehicle Model:
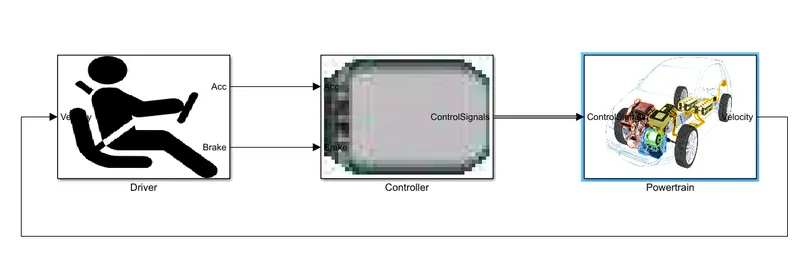
Driver:
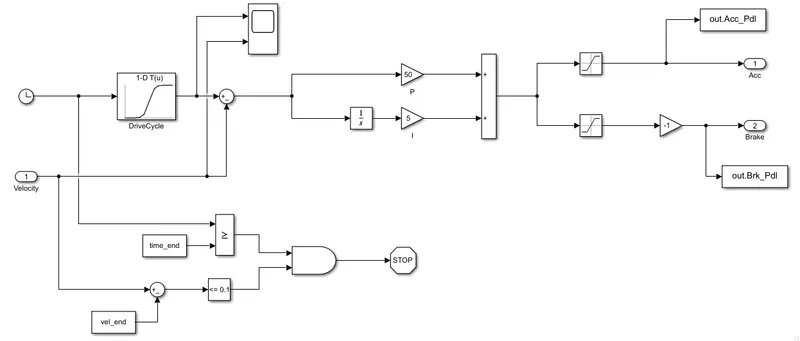
Controller:
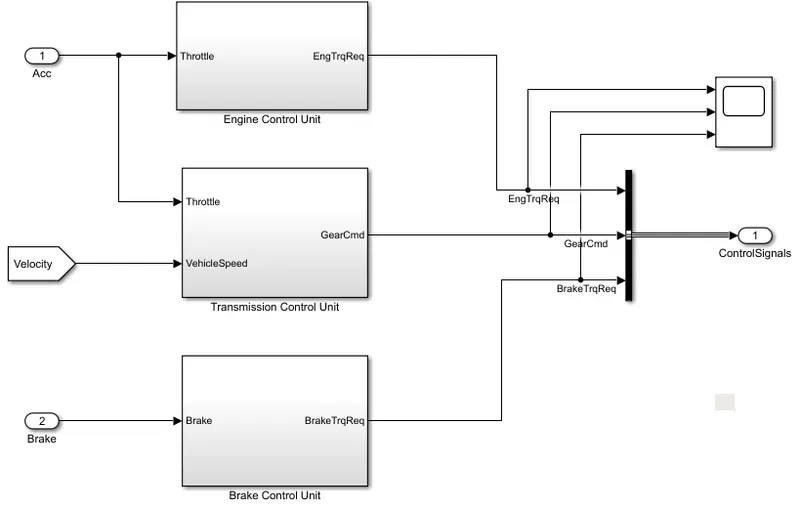
Power Train:
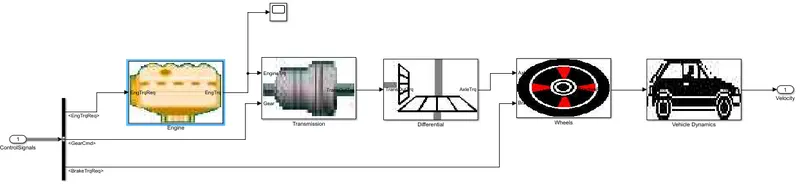
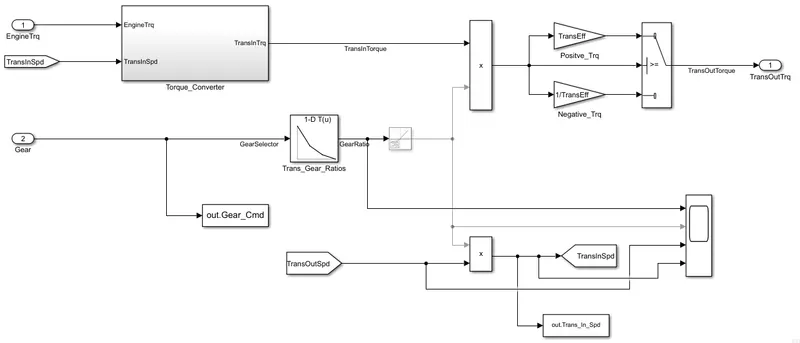
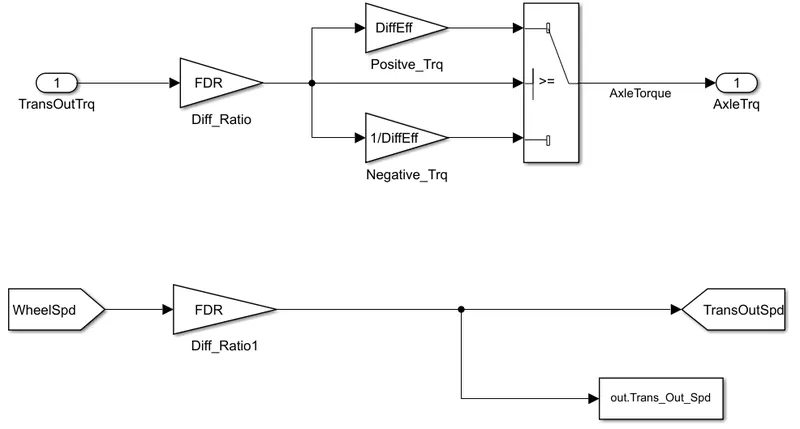
- Except the Engine and Vehicle dynamics blocks, others are pre-loaded
- The engine block and vehicle dynamics blocks are developed using the appropriate formulae
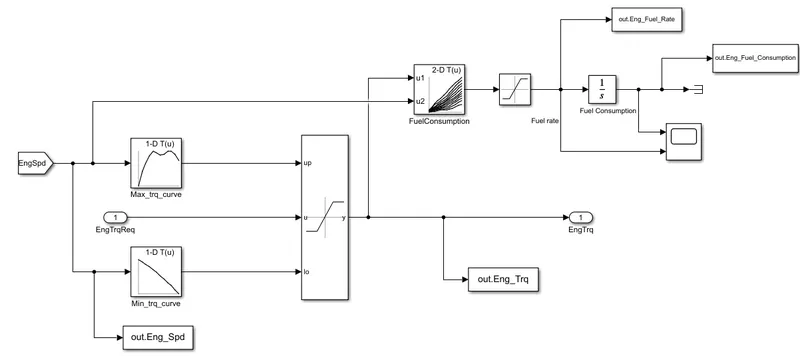
- To create the engine block, look-up tables are used to load the data of fuel consumption and the engine torque
- 'To workspace' command is used to get the data from Simulink
- Engine speed is taken as the input from the driver and look-up tables are used to get the fuel consumption
- Engine speed, fuel consumption, fuel rate, and torque are loaded from the Simulink to workspace
Engine:
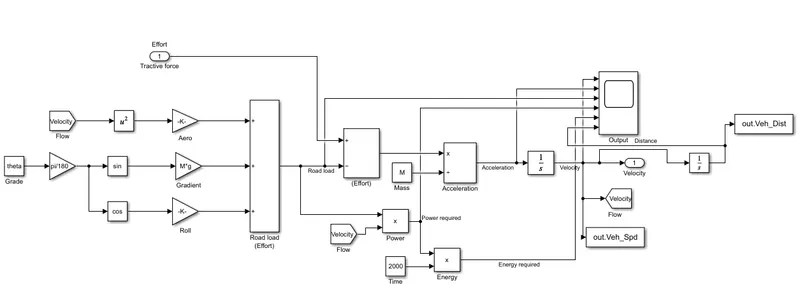
- Now, the Vehicle dynamics block is developed using the equations
- Equations for aerodynamic drag, rolling resistance, and gradient are created and summed up to get the road load
- Road load is subtracted from the tractive force to get the force
- This force is then divided by the mass to get the acceleration component
- Integrator is used to integrate the acceleration and get the velocity component
- Road load and velocity are multiplied to get the power required for the vehicle
- Power is then multiplied by the total time to get the energy required
- All the blocks of velocity, acceleration, road load, the power required, and energy required are attached to the 'scope' block to see the output variations with respect to the time
Vehicle Dynamics:
Transmission:
Differential:
Wheels:
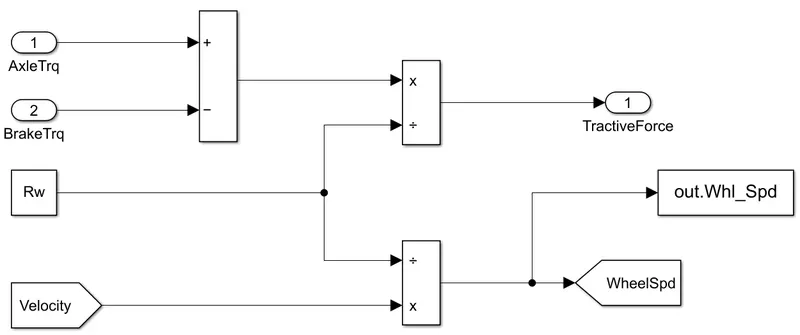
- Now, the 'Project1_ProcessingFile' is made run on MATLAB
- Some modifications are made to the program to get the required output
Code of 'Project1_ProcessingFile':
%%%%%%%%%%%%%%%%%%%%%%%%%%%%%%%%%%%%%%%%%%%%%%%%%%%%%%%%%%%%%%%%%%%%%
%% Skill-Lync -> Hybrid Drives Development
% Project 1 - Conventional Vehicle Model
% By - Ullekh Gambhira

% Description:
% The following file is to used with the Initialization file and Simulink
% results for post-processing of the data.
% The file is incomplete, has some examples of how the data is imported
% into a readable format, data analysis and plotting examples.
% Based on the project task, use commands in a similar format as given
% below, to analyse the data and generate required plots.
% You can change variable names if desired

%% Post-Processing File
%  File for post-processing the Conventional vehicle simulation model data

%% Renaming variables
Time = out.tout;
Acc_Pdl = out.Acc_Pdl;          % Accelerator pedal [%]
Brk_Pdl = out.Brk_Pdl;          % Brake pedal [%]
Gear_Cmd = out.Gear_Cmd;        % Transmission gear
Trans_In_Spd = out.Trans_In_Spd*30/pi;  % Transmission input speed [rpm]
Trans_Out_Spd = out.Trans_Out_Spd*30/pi;% Transmission output speed [rpm]
% Eng_Trq = out.Eng_Trq;          % Engine brake torque [Nm]
% Eng_Spd = out.Eng_Spd*30/pi;    % Engine speed [rpm]
% Eng_Fuel_Consump = out.Eng_Fuel_Consumption;    % Engine fuel consumption [g]
% Veh_Dist = out.Veh_Dist/1000;   % Distance traveled by vehicle [km]
% Veh_Spd = out.Veh_Spd*18/5;     % Vehicle speed [kmph]

Eng_Speed = Eng_Spd*30/pi;
Veh_Distance = Veh_Dist/1000;
Veh_Speed = Veh_Spd*18/5;

%% Data Analysis
Eng_Pwr = Eng_Spd*pi/30.*Eng_Trq/1000;   % Engine brake power [kW]
rho_petrol = 0.7197;                    % Density of petrol [kg/L]
kmpl = Veh_Distance(end)/(Eng_Fuel_Consump(end)/1000/rho_petrol);    % Fuel economy [kmpl]


%% Plotting vehicle characteristics time trace
figure()
subplot(4,1,1)
hold on
grid on
plot(Time, Acc_Pdl, 'linewidth', 1, 'Color', 'black');
plot(Time, Brk_Pdl, 'linewidth', 1, 'Color', 'red');
xlabel('Time [s]');
ylabel('Pedal [%]')
xlim([0, Time(end)]);
legend('Accel','Brake');

subplot(4,1,2)
hold on
grid on
plot(Time, Gear_Cmd, 'linewidth', 1, 'Color', 'black');
xlim([0, Time(end)]);
xlabel('Time [s]');
ylabel('Gear');

subplot(4,1,3)
hold on
grid on
plot(Time, Veh_Speed, 'linewidth', 1, 'Color', 'green');
xlim([0, Time(end)]);
xlabel('Time [s]');
ylabel('Vehicle speed (kmph)');

subplot(4,1,4)
hold on
grid on
plot(Time, Gear_Cmd, 'linewidth', 1, 'Color', 'blue');
xlim([0, Time(end)]);
xlabel('Time [s]');
ylabel('Vehicle Distance (km)');


%% Plotting engine operating points on engine fuel map
figure('Name','Engine Operating Points');
hold on
grid on
title('Engine Operating Points','fontsize',12);
p1=plot(Eng_map_spd*30/pi,Eng_max_trq,'linewidth',2,'color','r');
p2=line([Eng_map_spd(end)*30/pi Eng_map_spd(end)*30/pi],[0 Eng_max_trq(end)]);
set(p2,'linewidth',1,'linestyle','--','color','k');
p3=line([Eng_map_spd(1)*30/pi Eng_map_spd(1)*30/pi],[0 Eng_max_trq(1)]);
set(p3,'linewidth',1,'linestyle','--','color','k');
[c,h] = contour(Eng_map_spd'*30/pi,Eng_map_trq,Eng_fuel_map');
clabel(c,h);
xlabel('Engine Speed [rpm]');
ylabel('Engine Torque [Nm]');
title('Engine Fuel Consumption Map [g/s]');
p4=plot(Eng_Spd,Eng_Trq,'.','color','k');
legend([p1 p4],{'Max Curve','Operating Points'});
axis([Eng_map_spd(1)*30/pi Eng_map_spd(end)*30/pi 0 Eng_map_trq(end)]);


%% Plotting engine, transmission input, transmission output and wheel speed
figure();
grid on
hold on
plot(Time, Trans_In_Spd, 'linewidth', 1, 'Color', 'black');
hold on
plot(Time, Trans_Out_Spd, 'linewidth', 1, 'Color', 'red');
hold on
plot(Time,Eng_Speed,'linewidth',1,'Color','blue');
hold on
plot(Time,Whl_Spd,'linewidth',1,'Color','green');
xlabel('Time [s]');
ylabel('Speed [rpm]')
xlim([0, Time(end)]);
ylim([0, 6000]);
legend('Trans Input','Trans Output','Engine Speed','Wheel Speed');

%% Plotting engine torque, engine power, fuel rate and fuel consumption
figure()
subplot(4,1,1)
hold on
grid on
plot(Time, Eng_Trq, 'linewidth', 1, 'Color', 'black');
xlabel('Time [s]');
ylabel('Engine Torque [N-m]')
xlim([0, Time(end)]);

subplot(4,1,2)
hold on
grid on
plot(Time, Eng_Pwr, 'linewidth', 1, 'Color', 'blue');
xlim([0, Time(end)]);
xlabel('Time [s]');
ylabel('Engine Power [kW]');

subplot(4,1,3)
hold on
grid on
plot(Time, Eng_Fuel_Rate, 'linewidth', 1, 'Color', 'red');
xlim([0, Time(end)]);
xlabel('Time [s]');
ylabel('Fuel Rate');

subplot(4,1,4)
hold on
grid on
plot(Time, Eng_Fuel_Consump, 'linewidth', 1, 'Color', 'green');
xlim([0, Time(end)]);
xlabel('Time [s]');
ylabel('Fuel Consumption');
- Fuel economy number (kmpl) is found out from that program using formula
- Engine, transmission input, transmission output, and wheel speed are plotted on one graph with respect to the time
- Engine torque, engine power, fuel rate, and fuel consumption are plotted wrt the time using subplots
- Accelerator and brake pedal, gear command, vehicle speed, and vehicle distance are plotted wrt the time using subplots
- The engine operating points are plotted on the engine fuel map
- A similar procedure is followed by changing the drive cycle to 2 i.e. HWFET
Results:
Fuel economy numbers:
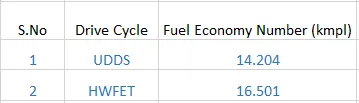
- As we see, the fuel economy is high in HWFET compared to UDDS, it is because, in urban driving, the vehicle encounters more traffic and it has to stop for fewer distances and it consumes more fuel at the starting. In HWFET, the vehicle encounters no traffic and it moves without use of too much braking, so it will have more fuel economy number
Engine, transmission input, transmission output and wheel speed plot
UDDS drive cycle:
HWFET drive cycle:
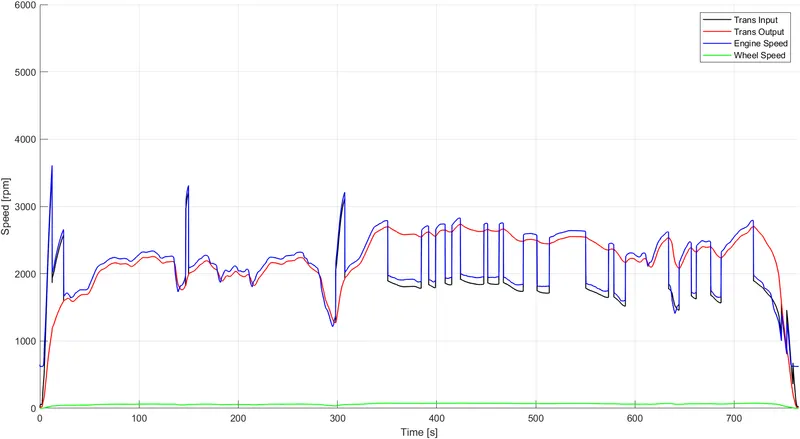
- We can see that the graph has more fluctuations in UDDS compared to the HWFET cycle because UDDS has more starts and stops but HWFET does not have too many starts and stops
- Braking is high in UDDS when compared to HWFET due to traffic
- Peak engine power reached in UDDS is nearly 4800 RPM and that in HWFET is 3800 RPM at the start, because, in UDDS, the vehicle requires more power to start from the initial condition
Engine torque, engine power, fuel rate, and fuel consumption plot
UDDS drive cycle:
HWFET drive cycle:
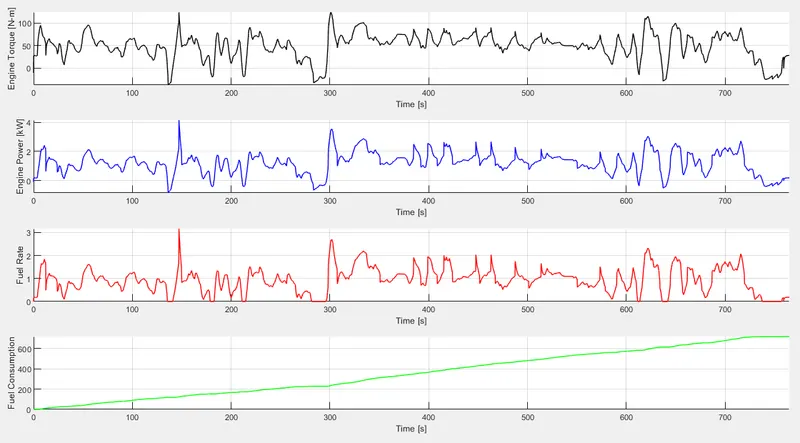
- Vehicle consumed more power in the UDDS compared to HWFET cycle because it has too many starts and stops compared to HWFET. When starting from the initial condition vehicle requires more power
- Engine torque is also high in UDDS because while starting from rest, the vehicle requires more torque to overcome the static friction
- The fuel rate is high in HWFET because the vehicle will be in continuous movement, it consumes more fuel
- But, fuel economy will be high in HWFET compared to UDDS because there are many stops and starts in UDDS and more fuel is consumed when the vehicle is in an idle position
Accelerator and brake pedal, gear command, vehicle speed, vehicle distance plot
UDDS drive cycle:
HWFET drive cycle:
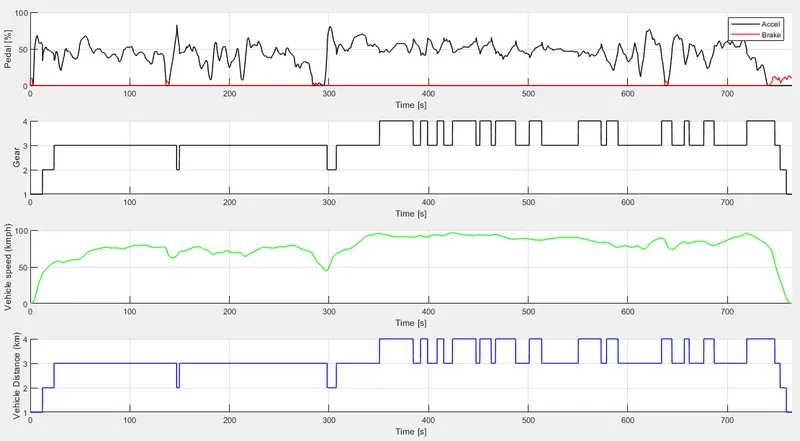
- For UDDS, the accelerator and the brake pedal have more fluctuations because of frequent starts and stops. But in HWFET, the brake pedal fluctuations are almost near to the zero line as there will be no frequent stops
- UDDS cycle mostly runs on 1st, 2nd gears, and uses 3rd, 4th gears very rarely as it does not achieve high speeds in that traffic. In the HWFET cycle, the vehicle mostly runs on 3rd, 4th gears as it will be moving at high speeds. It uses 1st, 2nd gears very frequently when braking is required
- Obviously, the vehicle speeds will be high in HWFET compared to UDDS. UDDS also has more fluctuations in the speed due to frequent braking
- The distance travelled in the given time will be high in HWFET than UDDS because of the traffic barrier in UDDS
Engine operating points on the engine fuel map
UDDS drive cycle:
HWFET drive cycle:
Conclusion:
The various performance characteristics and operating points of UDDS and HWFET cycles are analyzed and the graphs are plotted for
- Engine, transmission input, transmission output and wheel speed wrt the time
- Engine torque, engine power, fuel rate and fuel consumption wrt the time
- Accelerator and brake pedal, gear command, vehicle speed, vehicle distance wrt the time
- engine operating points on the engine fuel map
Also, the fuel economy numbers are tabulated