Parsing NASA thermodynamic data
Aim: To write a program that extracts 14 coefficients and calculate the specific heat, enthalpy, and entropy of all the given species.
Objectives:
- To extract 14 coefficients from the given data file and find specific heat, enthalpy, and entropy for every species
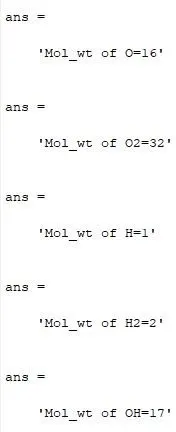
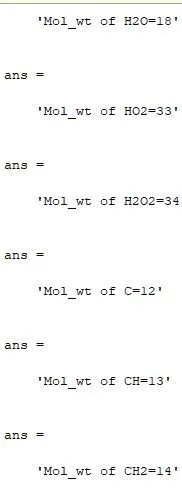
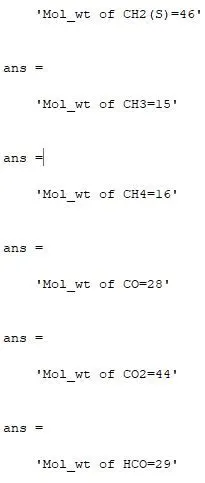
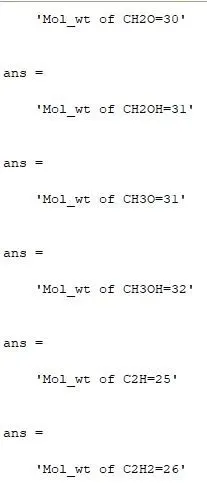
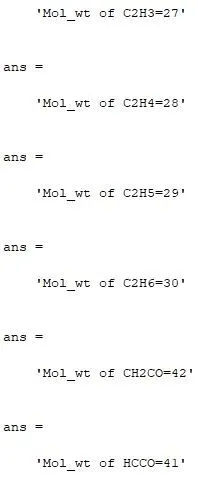
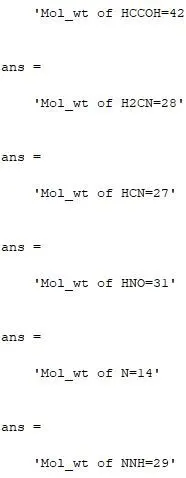
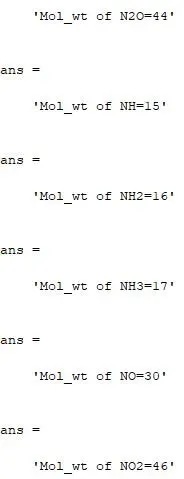
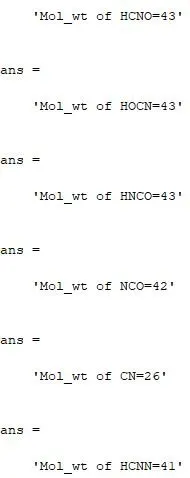
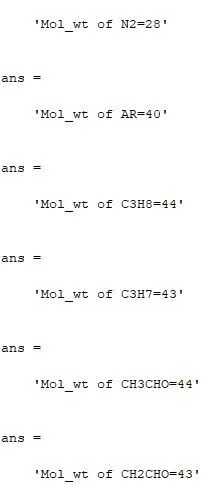
- Calculate the molecular weight of each species and display it in the command window
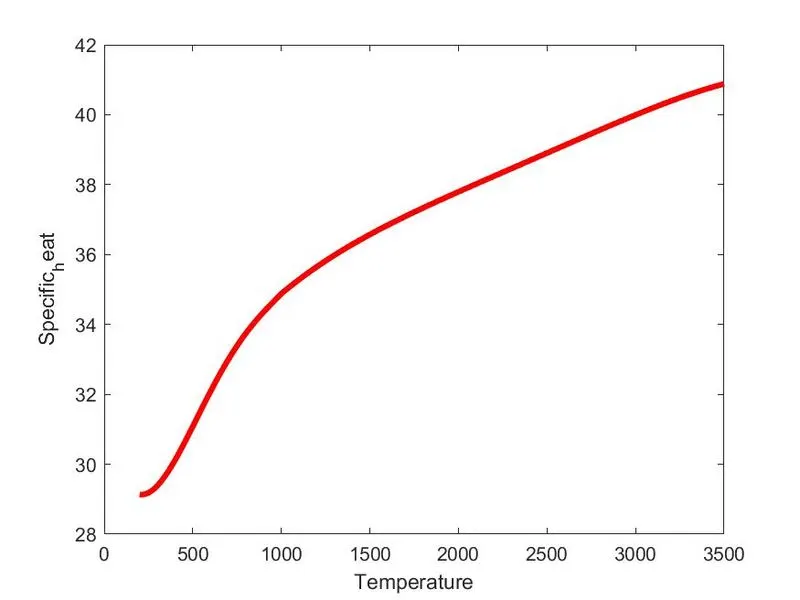
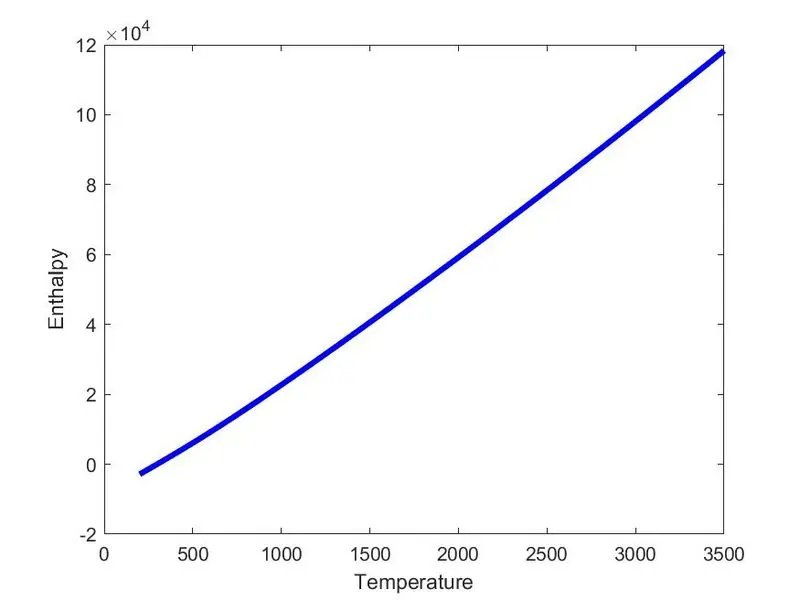
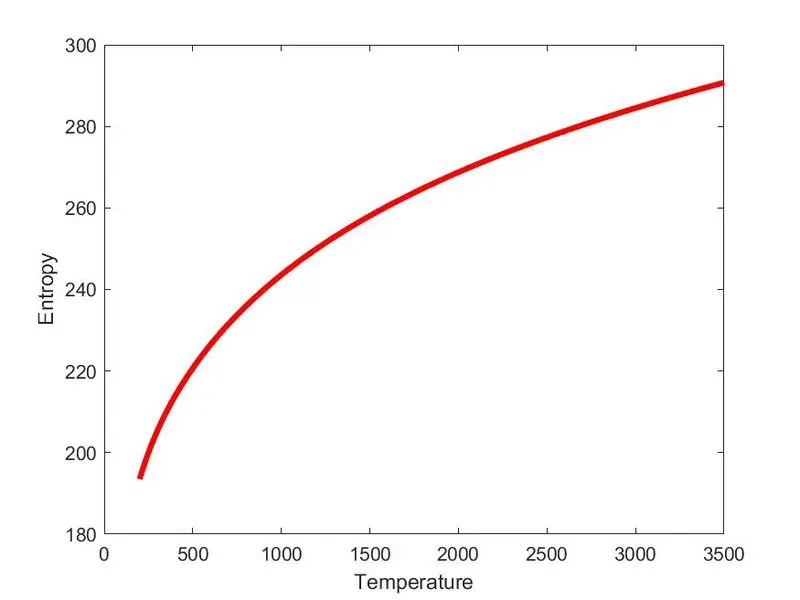
- Plot specific heat, enthalpy, and entropy for local temperature range
- Save all the plots as images with appropriate names
Inputs:
Global_low_temperature = 300
Global_mid_temperature = 1000
Global_high_temperature = 5000
Formulae:

- From data, the first 7 are high-temperature coefficients and the other 7 are low-temperature coefficients
Function program for specific heat:
function [Cp]=specific_heat(T,R,local_mid_temperature,c1,c2,c3,c4,c5,c6,c7,c8,c9,c10,c11,c12,c13,c14);

if T
Function program for enthalpy:
function [H]=enthalpy(T,R,local_mid_temperature,c1,c2,c3,c4,c5,c6,c7,c8,c9,c10,c11,c12,c13,c14);

if T
Function program for entropy:
function [S]=entropy(T,R,local_mid_temperature,c1,c2,c3,c4,c5,c6,c7,c8,c9,c10,c11,c12,c13,c14);

if T
Explanation:
- As given, the first 7 coefficients are high-temperature coefficients and the next 7 are low-temperature coefficients, we need to write 2 equations with different coefficients
- By using 'if-else' condition, condition the 2 equations for different temperature ranges
- Conditioning is done with respect to local_mid_temperature
- Similarly, functions for specific heat, enthalpy, and entropy are written
Function program for molecular mass:
function [Mol_wt] = molecule(species)
elements = ['C','H','O','N','S','A'];
At_wt = [12,1,16,14,32,40];
Mol_wt = 0;
for i=1:length(species)
    for j=1:length(elements)
        if strcmp(species(i),elements(j))
            Mol_wt=Mol_wt+At_wt(j);
            n=j;
        end
    end
    m=str2num(species(i));
    if m>1
        Mol_wt=Mol_wt+At_wt(n)*(m-1);
    end
end
end
Explanation:
- The function is created by giving the species name as an input
- Declare the elements and assign the atomic weights to each element
- Use 'for' loop to execute the program throughout the length of species
- 'strcmp' is used to compare species and elements. If they are characters, we can execute directly, but if they are numbers, we have to cinvert them from string to number
- 'str2double' is used to convert string to a number
Main program:
clear all
close all
clc

%Reading global temperature values
f1=fopen('THERMO.dat','r');
header=fgetl(f1);

%Global temperatures
global_temperature=fgetl(f1);
T=strsplit(global_temperature,' ');
global_low_temperature=str2num(T{2});
global_mid_temperature=str2num(T{3});
global_high_temperature=str2num(T{4});

%Comments
comment_1=fgetl(f1);
comment_2=fgetl(f1);
comment_3=fgetl(f1);

%Constants
R=8.314;

%Calculating Cp,H,and S
for i=1:inf
    line1=fgetl(f1);
    L1 = strsplit(line1,' ');
    if strcmp(L1(1),'END');
        disp('File is ended');
        break;
    end
    species=L1{1};
    local_low_temperature=str2num(L1{end-3});
    local_mid_temperature=str2num(L1{end-1});
    local_high_temperature=str2num(L1{end-2});

    line2=fgetl(f1);
    %extracting the coefficients of line2
    L2=findstr(line2,'E');

    c1=str2num(line2(1:L2(1)+3));
    c2=str2num(line2(L2(1)+4:L2(2)+3));
    c3=str2num(line2(L2(2)+4:L2(3)+3));
    c4=str2num(line2(L2(3)+4:L2(4)+3));
    c5=str2num(line2(L2(4)+4:L2(5)+3));

    line3=fgetl(f1);
    %extracting the coefficients of line3
    L3=findstr(line3,'E');

    c6=str2num(line3(1:L3(1)+3));
    c7=str2num(line3(L3(1)+4:L3(2)+3));
    c8=str2num(line3(L3(2)+4:L3(3)+3));
    c9=str2num(line3(L3(3)+4:L3(4)+3));
    c10=str2num(line3(L3(4)+4:L3(5)+3));

    line4=fgetl(f1);
    %extracting the coefficients of line4
    L4=findstr(line4,'E');

    c11=str2num(line4(1:L4(1)+3));
    c12=str2num(line4(L4(1)+4:L4(2)+3));
    c13=str2num(line4(L4(2)+4:L4(3)+3));
    c14=str2num(line4(L4(3)+4:L4(4)+3));

    %Calculating molecular weight
   [Mol_wt] = molecule(species);
   sprintf('Mol_wt of %s=%d',species,Mol_wt)

    T=linspace(local_low_temperature,local_high_temperature,1000);
   for j=1:length(T)
       Cp(j)=specific_heat(T(j),R,local_mid_temperature,c1,c2,c3,c4,c5,c6,c7,c8,c9,c10,c11,c12,c13,c14)

       H(j)=enthalpy(T(j),R,local_mid_temperature,c1,c2,c3,c4,c5,c6,c7,c8,c9,c10,c11,c12,c13,c14)

       S(j)=entropy(T(j),R,local_mid_temperature,c1,c2,c3,c4,c5,c6,c7,c8,c9,c10,c11,c12,c13,c14)
    end

  %Plotting Cp vs Temperature
   cp=figure(1);
   plot(T,Cp,'linewidth',3,'color','r');
   xlabel('Temperature')
   ylabel('Specific_heat')

   %Plotting Enthalpy vs Temperature
   h=figure(2);
   plot(T,H,'linewidth',3,'color','b');
   xlabel('Temperature')
   ylabel('Enthalpy')

   %Plotting Cp vs Temperature
   s=figure(3);
   plot(T,S,'linewidth',3,'color','r');
   xlabel('Temperature')
   ylabel('Entropy')

   %Making folder
   mkdir('Project');
   cd('project');
   mkdir(species);
   cd(species);

   %Saving the plots
   saveas(cp,'specific_heat.jpg')
   saveas(h,'enthalpy.jpg')
   saveas(s,'entropy.jpg')

   cd ..
   cd ..
   close all

end
Explanation:
- 'THERMO.dat' file is opened using 'fopen' command and it is read using 'r' command
- Each line is read separately using 'fgetl' command
- The first line is a header line
- The second line is the global temperatures line. At first, read the line, then use 'strsplit' command to split the string. Now use 'str2num' command to convert a string to a number. Assign 3 global temperature values i.e. low, mid, and high
- Neglect the next 3 lines
- Declare the constants
- Use 'for' loop such that the program stops executing till the 'END' is reached.
- Every species contains 4 lines. From the first line we can extract the local temperatures of each species.
- Read the species and extract local temperatures using 'str2num' command
- The next three lines consist of coefficients. Extract each line and coefficient separately
- After extracting all the 14 coefficients, give the temperature range and no. of values using 'linspace' command
- Use 'for' loop to execute the function programs of specific heat, enthalpy, and entropy
- Plot the graph for T vs Cp, T vs H, T vs S separately using 'plot' command
- Use'mkdir' to make a new directory and use 'cd' to create a directory and it saves all the files in that directory
- Also, save the images using 'saveas' command
Screenshot of window where all folders are saved:

Results:
- 14 coefficients are extracted and are used in program to calculate the values of specific heat, enthalpy, and entropy for different temperature ranges
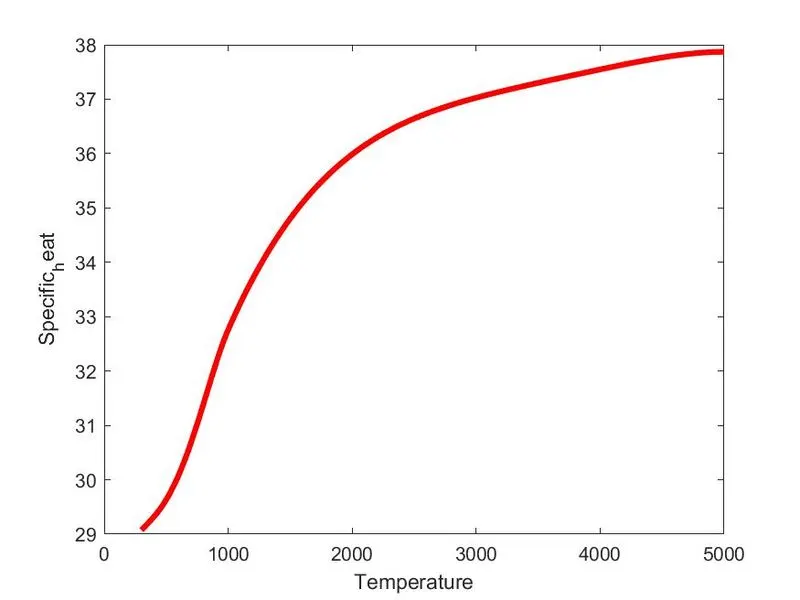
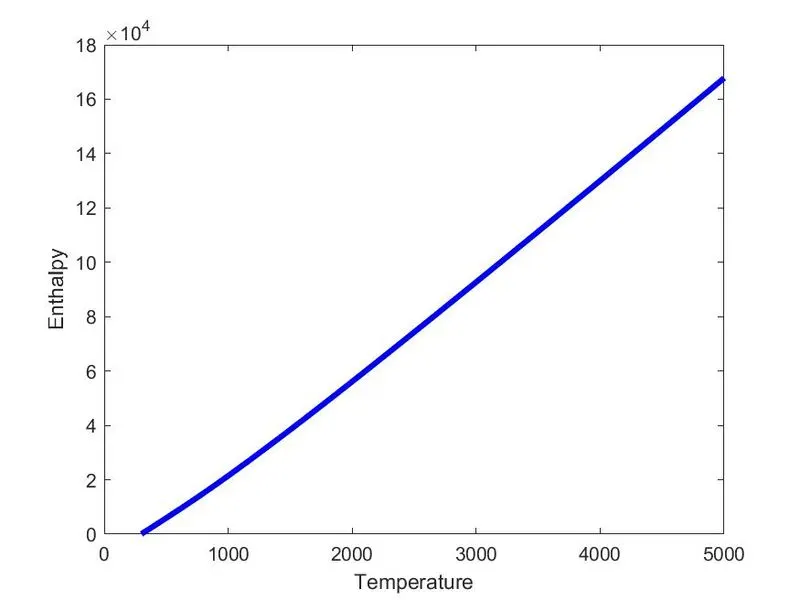
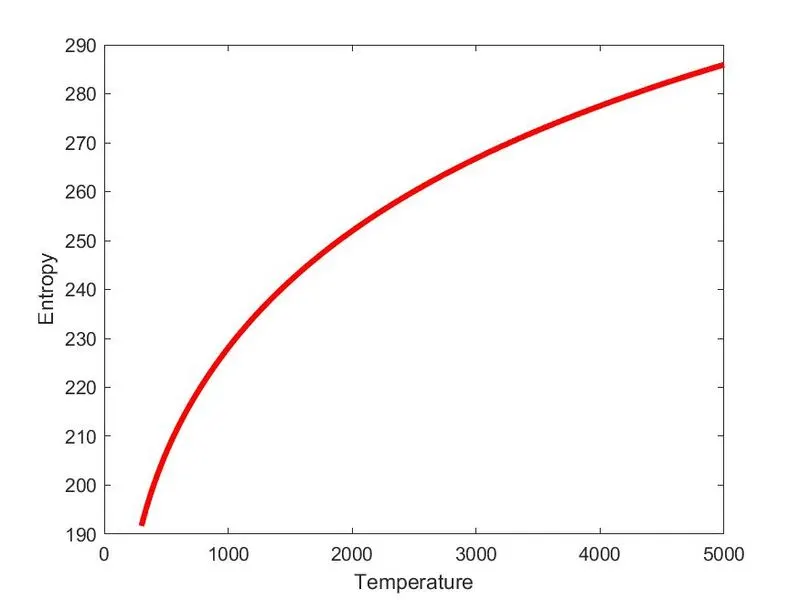
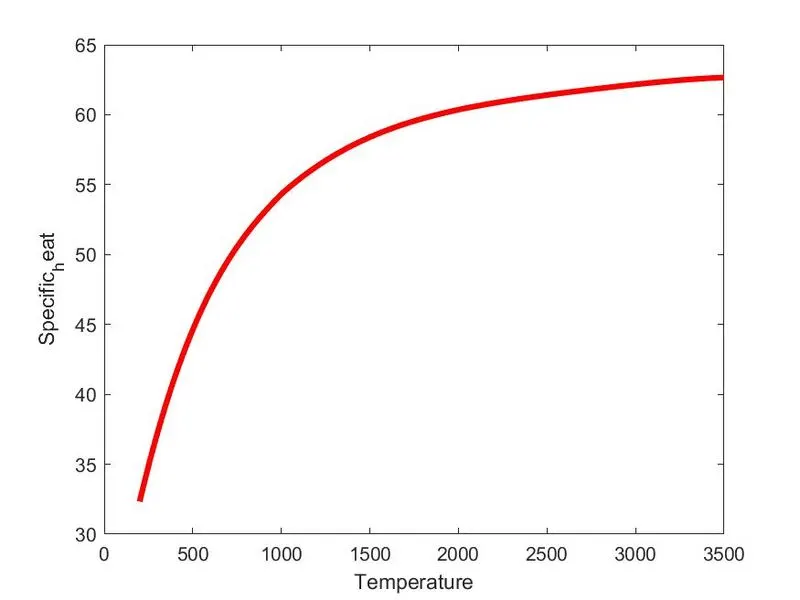
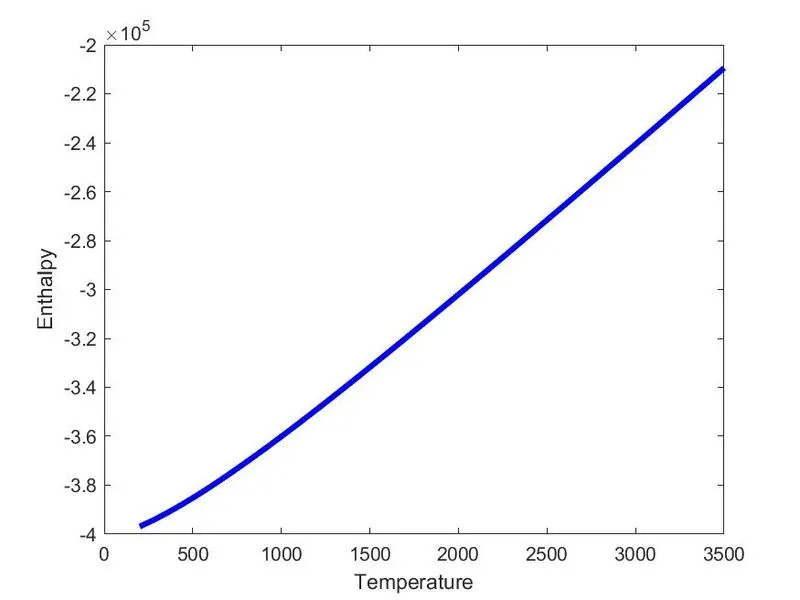
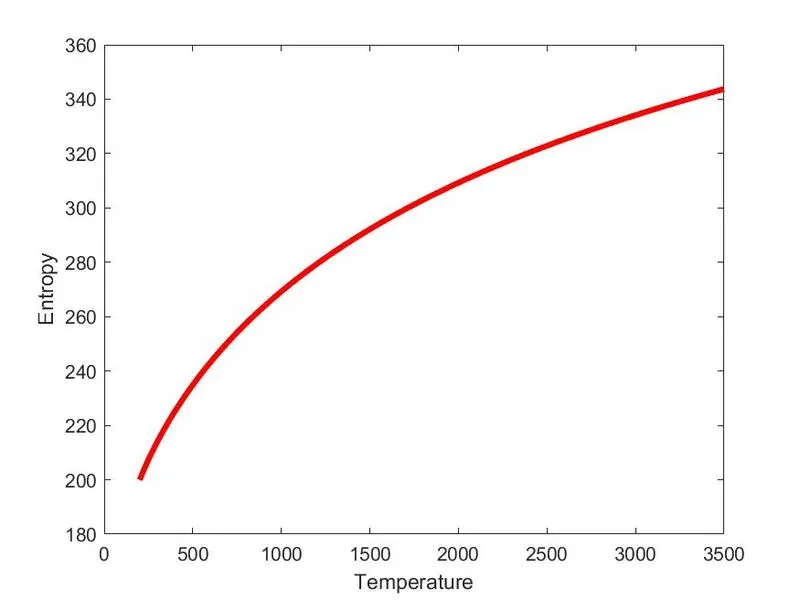
- The graphs for Cp, H, and S are plotted with local temperatures and observed the trend for different ranges
- Molecular mass has been calculated and displayed them in a command window
Plots for O2:
Specific Heat
Enthalpy
Entropy
Plots for N2:
Specific heat
Enthalpy
Entropy
Plots for CO2:
Specific Heat
Enthalpy
Entropy
Molecular mass of species: