Project 1
1) UDDS cycle :
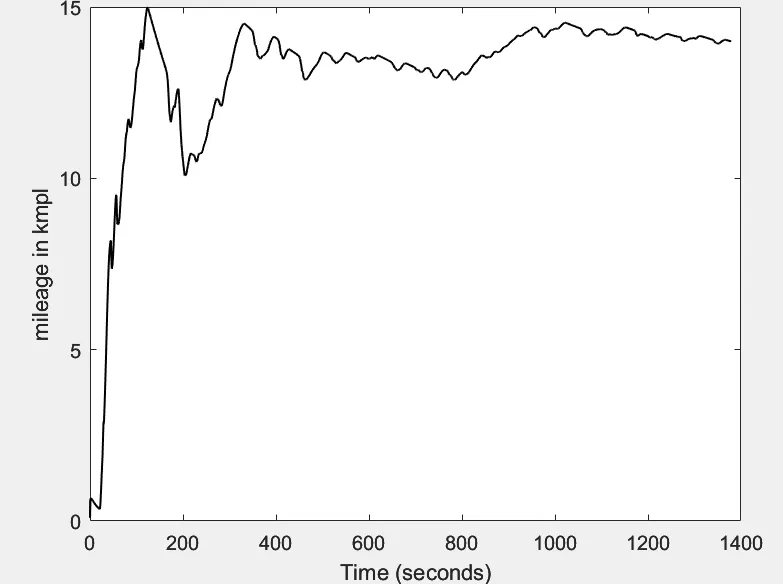
- Tabulate the fuel economy numbers (kmpl) for UDDS and HWFET cycle. This forms the baseline numbers for comparing with the future hybrid version.
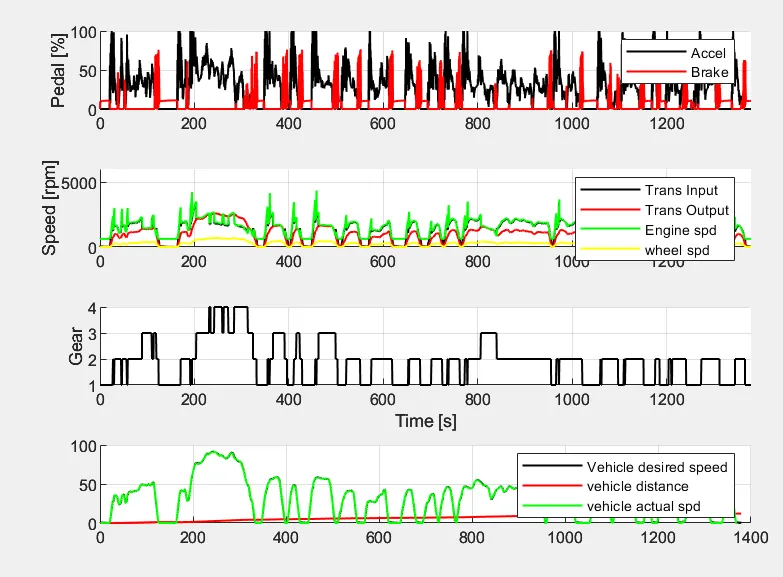
- Plot the time trace for engine, transmission input, transmission output and wheel speed on one plot
- Plot accelerator and brake pedal, gear command, vehicle desired and actual speed, vehicle distance using subplots.
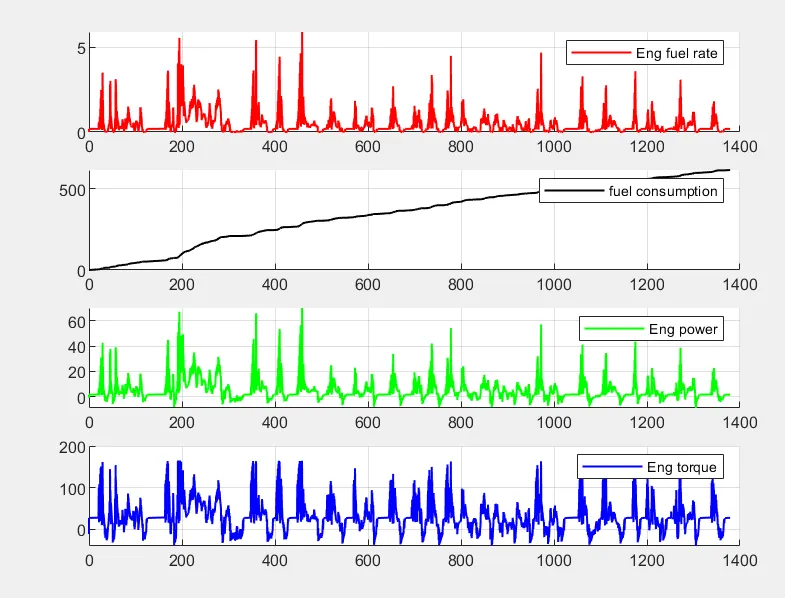
- Plot engine torque, engine power, fuel rate and fuel consumption using subplots.
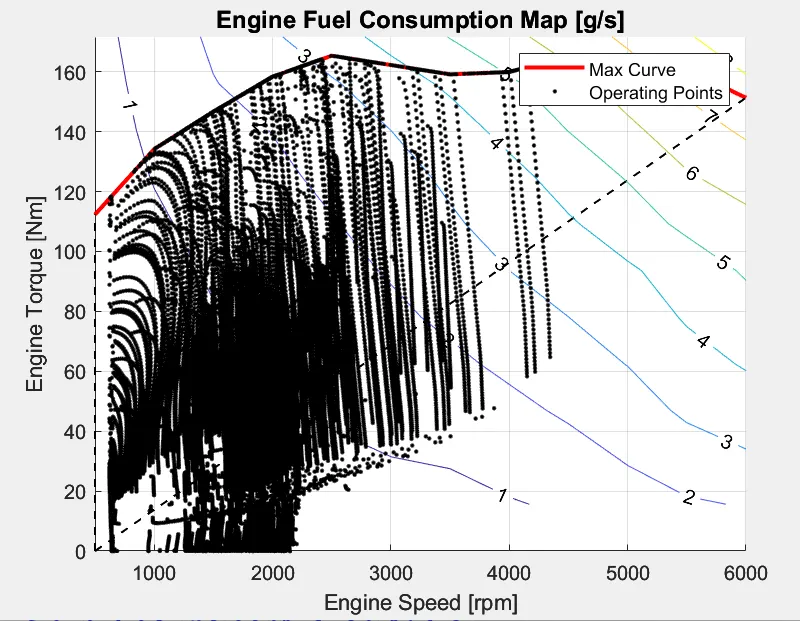
- Plot the engine operating points on the engine fuel map
2) HWFET cycle:
- Tabulate the fuel economy numbers (kmpl) for UDDS and HWFET cycle. This forms the baseline numbers for comparing with the future hybrid version.
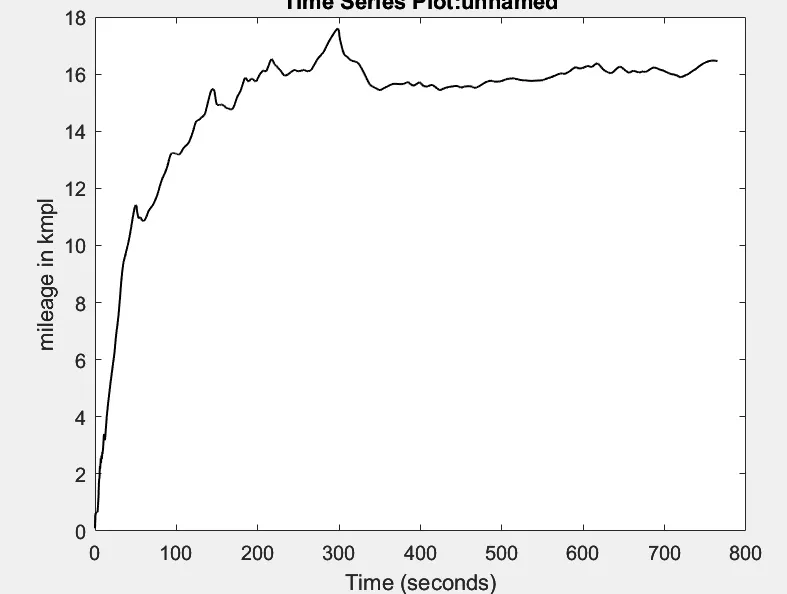
- Plot the time trace for engine, transmission input, transmission output and wheel speed on one plot.
- Plot accelerator and brake pedal, gear command, vehicle desired and actual speed, vehicle distance using subplots.
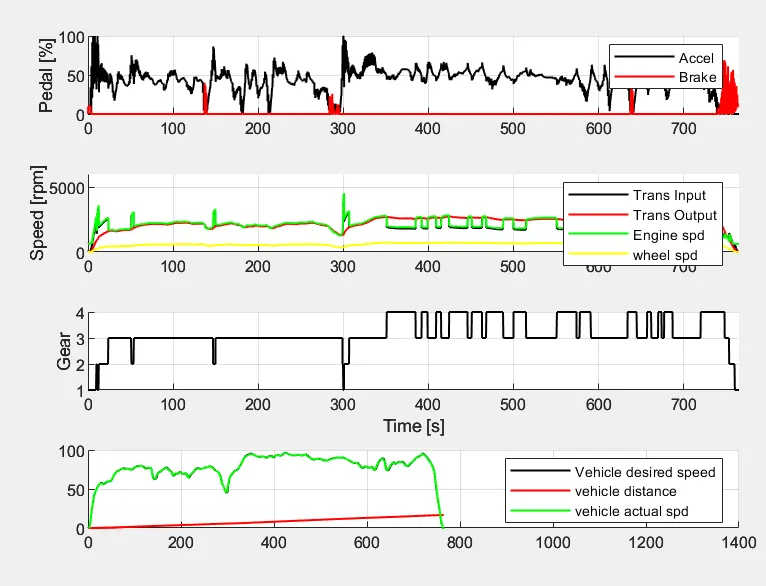
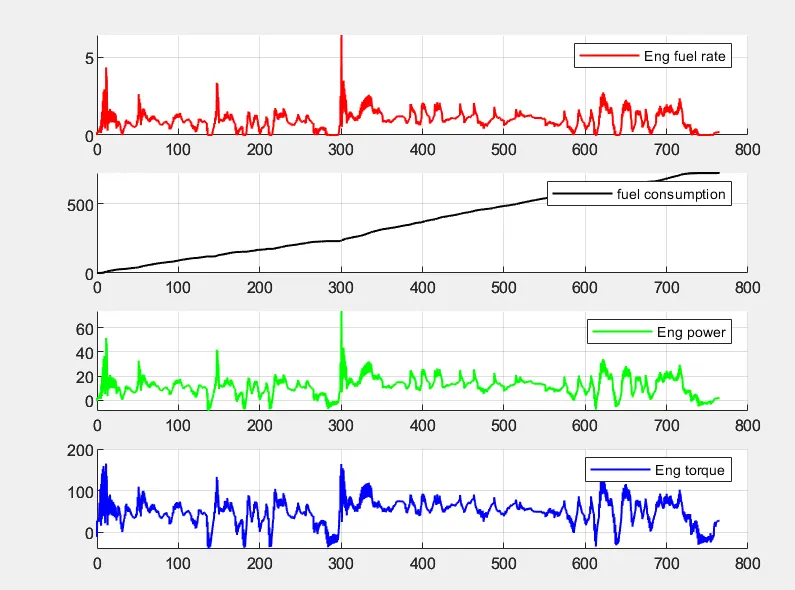
- Plot engine torque, engine power, fuel rate and fuel consumption using subplots.
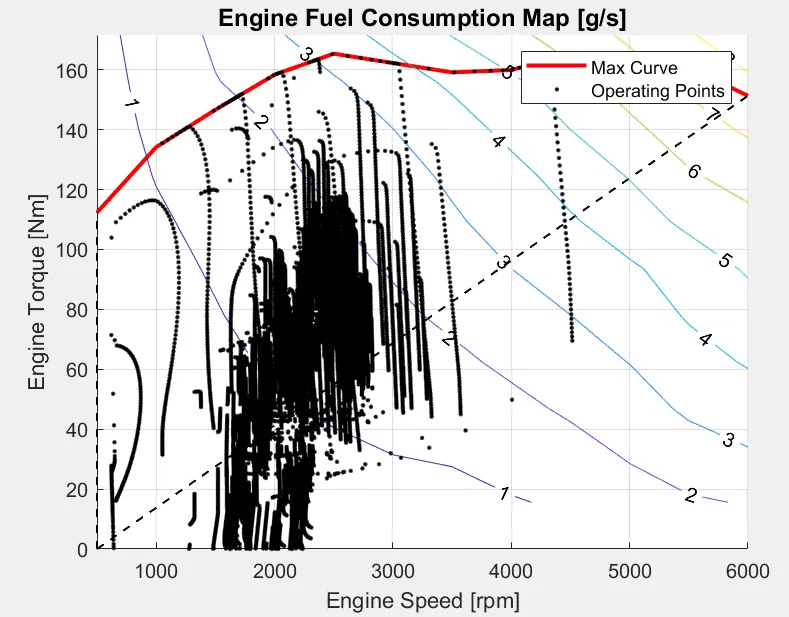
- Plot the engine operating points on the engine fuel map
Comments:
The fuel economy is more for HWFET than UDDS.
Most of the engine operating points lie within a range of 2000 rpm in hwfet drive cycle and which is over the 3000rpm in UDDS. This results in less energy consumption in HWFET cycle.