Project 1
Q1. Design a battery pack for a car roughly 150 Kw with 120 V. Use 3500 mAh 3.6V nominal NMC chemistry cell.
a. Design the battery pack configuration.
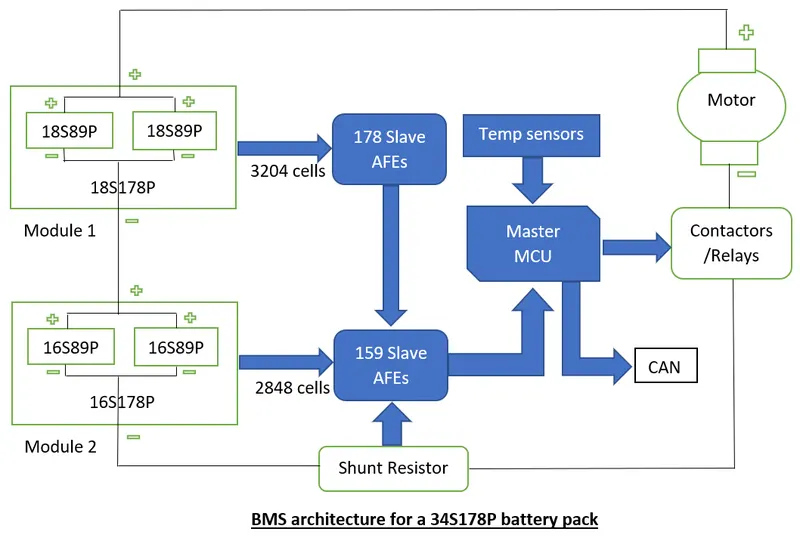
b. Draw the BMS topology for this battery pack.
Ans:
Objective:
To design a battery pack and its suitable BMS topology for a car roughly 150 Kw with 120 V.
Design calculations:
No: of cells in series = Total required battery pack voltage / cell nominal voltage
= 120V / 3.6V
= 33.33 ≈ 34
For a battery pack of 150kw total power rating and 120V voltage rarting, the ampere rating would be 150000kw/120V = 1250A
As we are usign 3.5Ah cell, the maximum current can be drawn is 7A (considering maximum of 2C discharge rate).
No: of cells in parallel = 1250A/7A
= 178
Therefore the battery pack configuration would be 34S178P
BMS Topology:
Since in our back pack we have more than 18 cells, we should prefer Master & Slave BMS Topology.
Q2. Build a 3S2P battery pack configuration with generic battery block using Matlab/Simulink.
Ans:
Simulink model:
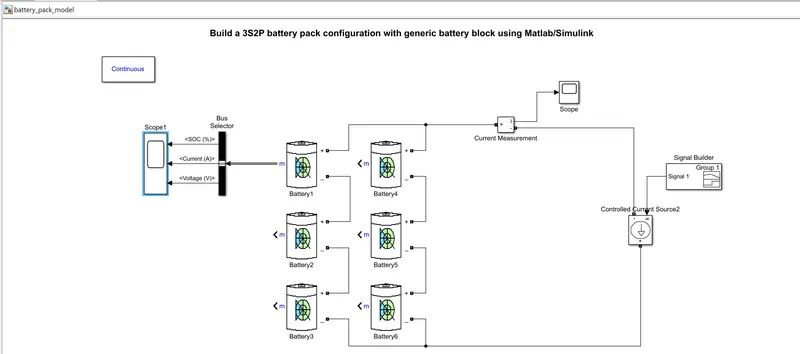
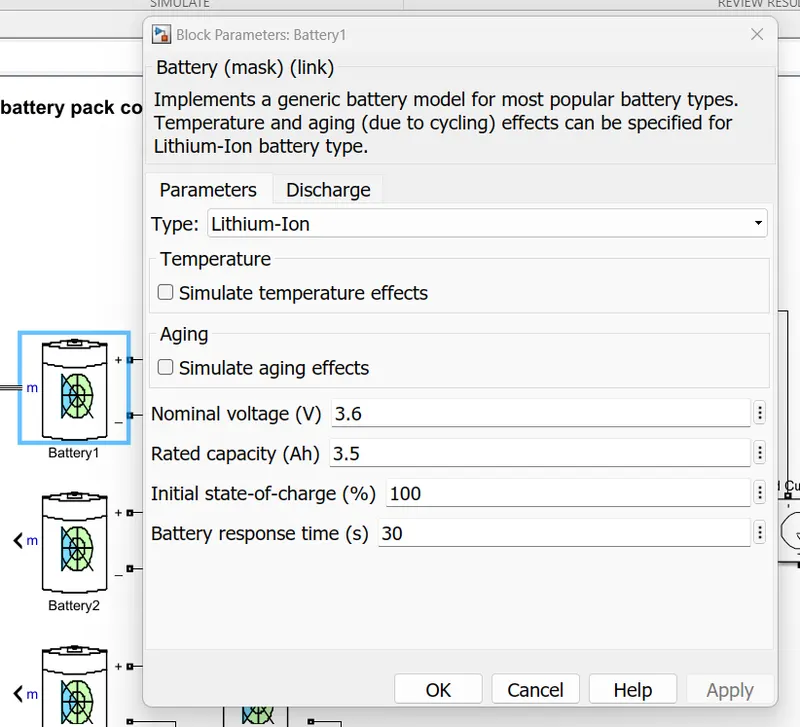
In this model, the 3S2P battery pack is designed with cell parameters of nominal voltage 3.6V and cell capacity of 3.5Ah each. We have 2 parallel strings with 3 cells connected in series in each string.. which makes the total battery pack voltage to be (3*3.6V = 10.8V). And the total battery pack capacity to be (3.5*2 = 7Ah).
Each cell parameters:
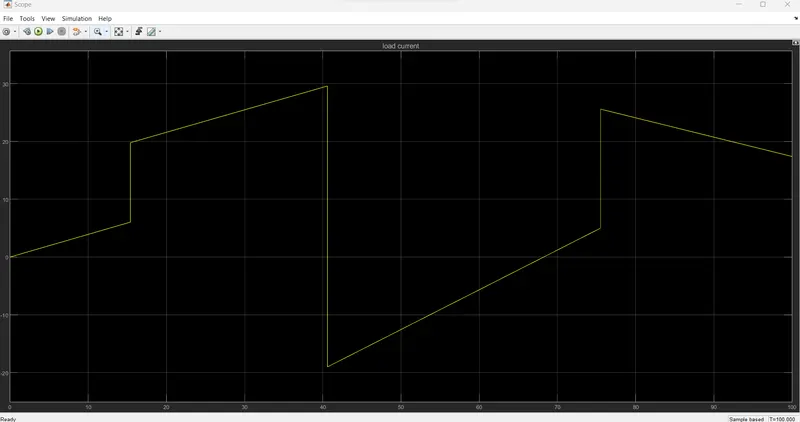
The pack is not directly connected to any load, instead we have provided a positive or negative current using a controlled current source. This will act as load current for the battery pack. When the load current is positive the battery drains and whenever its negative the battery gets charged(regenerative breaking process).
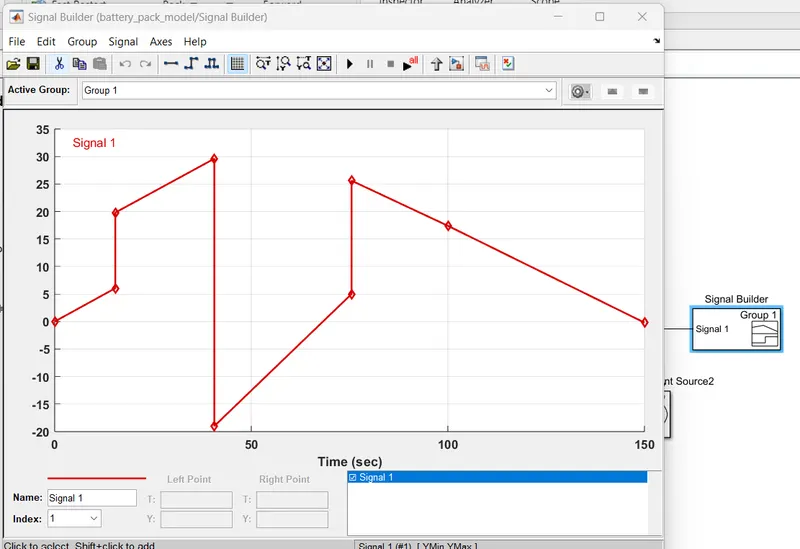
The controlled current source is been actuated by a signal wave form generated by signal builder block. Therefore the load current will be producing accoedingly..
Signal builder block:
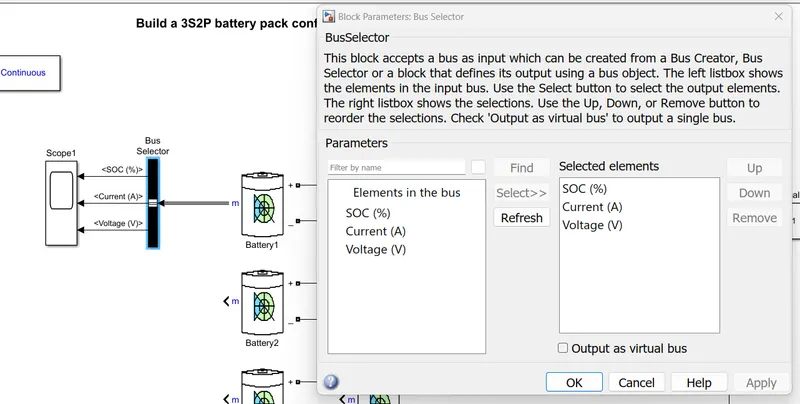
The measurement port of each cell contains datas such as cell SOC, cell voltage and cell current.. With the help of a bus selector we have connected all these datas to a scope to see and analyse the data.
Execution result:
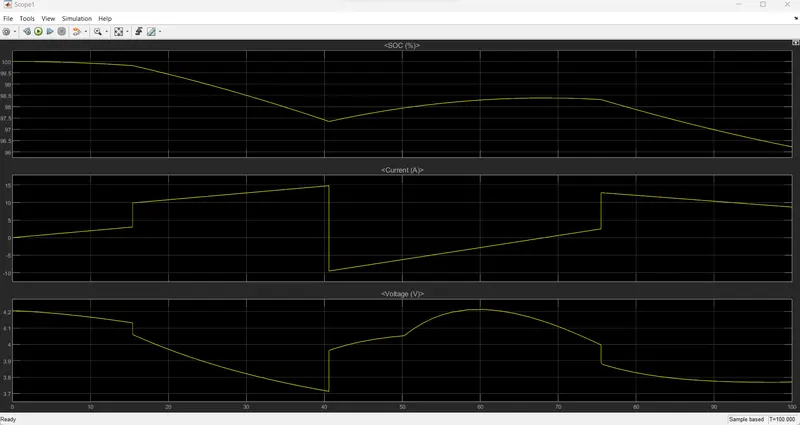
The model was simulated for 100 seconds.
Load current
Conclusion:
From the simulation results we can observe that the cell current is following the load current profile and during the positive current the cell SOC and cell voltage drops from 100% and while current is negative SOC and cell voltage increases. At the end of the simulation the SOC is at 96%.