Project 1
Q.
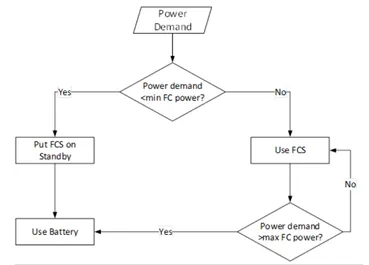
Create a stateflow or Simulink model for the following flowchart.
Load the .mat file into the workspace.
The input to the model would be the power demand.
The output should be:
- Fuel cell power
- Battery power
- FC Operating state (running, standby)
Create plot of these outputs against time.
Ans-
Simulink model is developed instead of stateflow model for the following flowchart.
Overall model that is designed is as shown below-
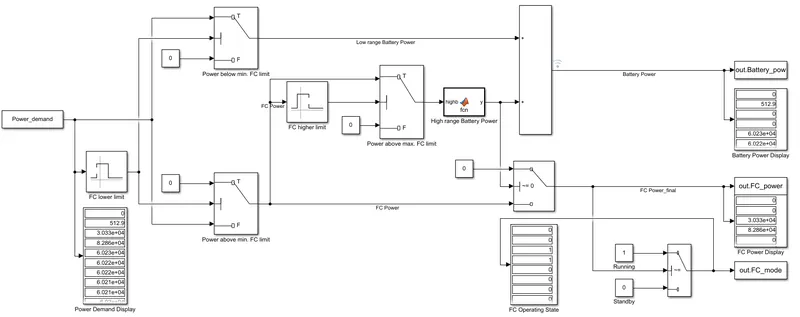
Steps to build the model-
1. Feeding input to the model
Power demand is the input to the model. It is fed as the variable (Power_demand) from workspace through the constant block. It has a range of power from negative to positive values. Any negative power can be considered regenerative and thus will be taken by battery.
If positive power values fall on ranges corresponding to Fuel cell, they will be taken as fuel cell power, and the values outside the ranges will be taken as battery power.
Here, an sample data with 598 discrete values of power in watts are stored in the Power_demand variable and are loaded to the workspace through project1.mat file.
2. Check if input < min. FC power?
To check if the power demand falls below the min. FC power requirement, the Interval Test block in Simulink is used. A lower limit of 23000 watts is defined here as FC lower limit. Any value that is below this threshold is labelled as battery power and any value above this labelled as FC power by means of Switch block that takes input from Interval Test block.
Logic is as shown below-
If (input < 23000)
Battery Power = input
FC power = 0
Else
Battery Power = 0
FC power = input
3. If FC power > max. FC power limit
According to the flowchart, any input value above FC lower limit taken as input from the previous switch block is checked right from its second value to see if it exceeds the max. FC power limit. If it does, it needs to be labelled as battery power. This is checked with the help of Interval test block itself. It checks if the input power value is greater than the max. threshold of 55000 watts.
Logic-
If (FC power > 55000)
Battery Power = FC power
FC power_final = 0
Else
Battery Power = 0
FC power_final = FC power
The first exceeding value is labelled as FC power_final itself(as per flowchart). From the second exceeding value, it is assigned as Battery power. This not so necessary condition is implemented through Matlab function.
4. FC operating state
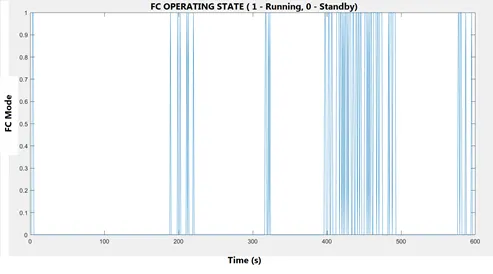
FC operating state, if Running or Standby is decided using a switch block that checks the FC power_final value. If the fuel cell power is not zero, the operating state is running, indicated by a binary output of 1 and, if the fuel cell power signal value is zero, the switch outputs a 0, indicating standby mode.
5. Save outputs to workspace
All three output variables-
- FC power final
- Battery power
- FC operating state
And their values are saved in the form of an array to workspace.
6. Generate graph
The variables are accessed from the workspace and plotted as shown below.
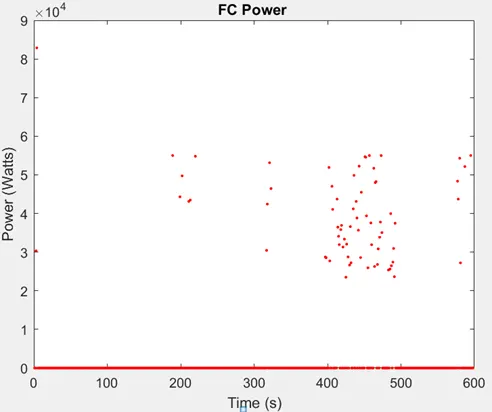
From FC power plot, it can be seen that all values are in-between the range of 23000 watts and 55000 watts.
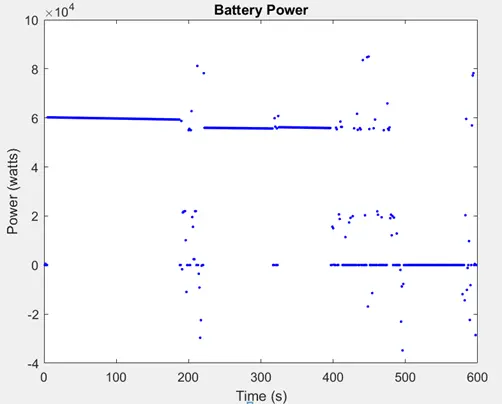
From Battery power plot, it is seen that it takes all input power values that are negative, below 23000 watts and above 55000 watts.
Comparing the FC power plot and FC operating state plot, we see than whenever FC power is non-zero, FC state is 1, which means that it is in running mode. Rest all values are zero, which means standby mode.
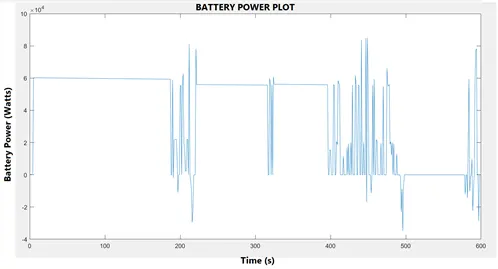
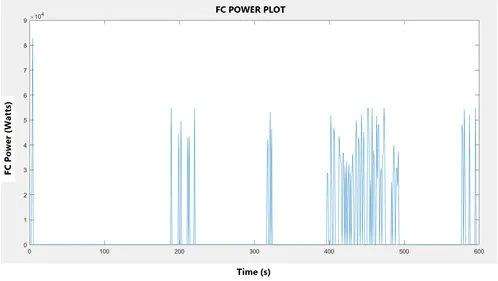
For better understanding the range of values, first two graphs above are plotted once again as discrete values as shown below.