plot the current, voltages, SoC and internal resistance as a function of time. Calculate the average discharging and charging efficiency for the battery.
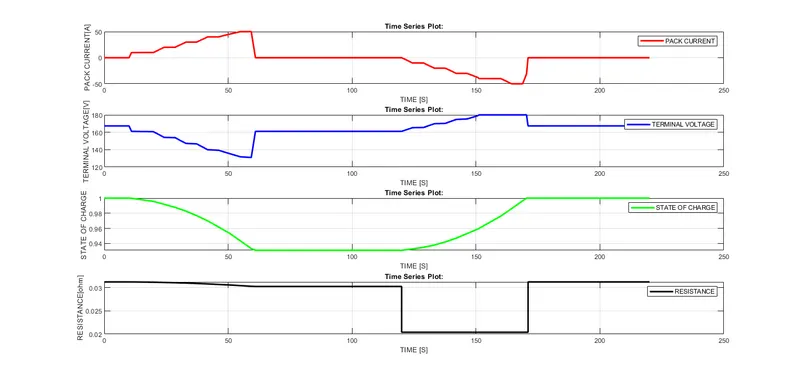
Q1) Sample current data (Pack_Current_test.mat) is provided for a battery test cycle. Input the current data to the battery model (can use “From Workspace” block) and examine the open circuit voltage and terminal voltage of the pack, SoC and the internal resistance. Export the variables to the workspace (can use “To Workspace” block) and plot the current, voltages, SoC and internal resistance as a function of time. Write in brief on the observed trend, whether it was expected or not.
Q2) Calculate the average discharging and charging efficiency for the battery.
Step 1: Create an initialization script in Matlab that loads up the battery data into the workspace.
clear all
close all
clc

% LOADING THE GIVEN DATA FILE
load 'New folder'\ESS_NiMH6.mat
load 'New folder'\Pack_Current_test.mat
% TAKING INITIAL SOC
ESS_initial_SOC=1;
% TAKING CURRENT VALUES WITH RESPECTIVE TO TIME
CURRENT_TIME=[t, I_pack];
taking current time beacuse to provide input with respective with time .
Step 2: Create the Simulink model that references the loaded variables.
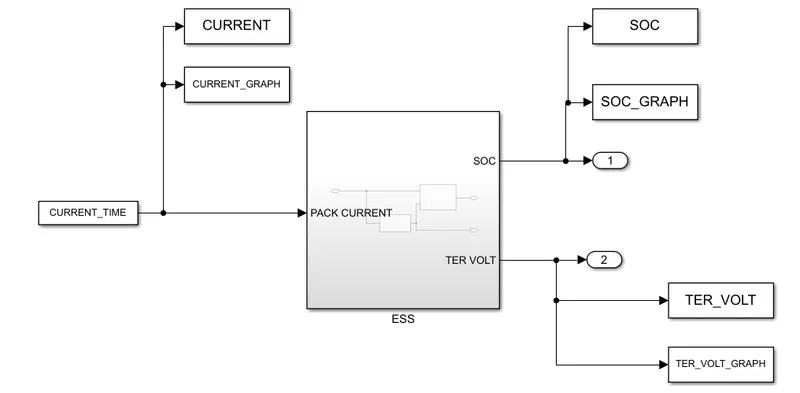
using of two two workshop block for single values one in array format an another in timeseries format which means values of current,soc,resistance,tervolt with respective to time.
providing the input as current with respective to time and output is soc and terminal voltage.
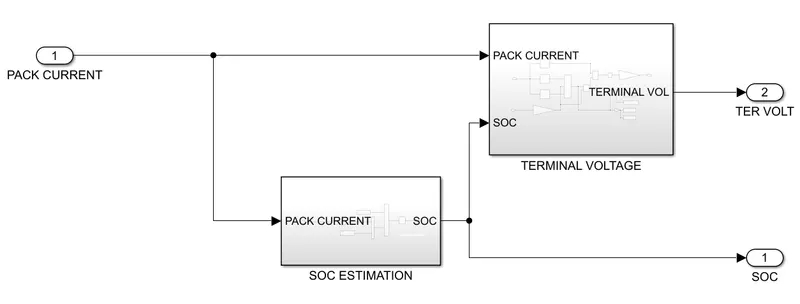
inside ESS we have SOC and TERMINAL VOLTAGE where first we calculate SOC and that SOC use to calculate terminal voltage.
(soc= state of charge).
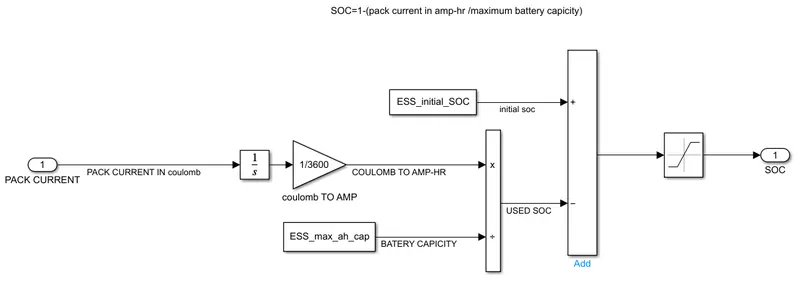
inside soc block first we are integrating the value of pack current which is in coulomb and with gain block we multiply it to convert into ahm-hr
soc= initial state of charge -used state of charge
used state of charge=pack current in amp-hr/maximum battery capicity (in ahm-hr)
this values are been saturated with upper limit 1 and lower limit 0
why this ( because we have given the maximum value in ESS SOC start from 0 end to 1)
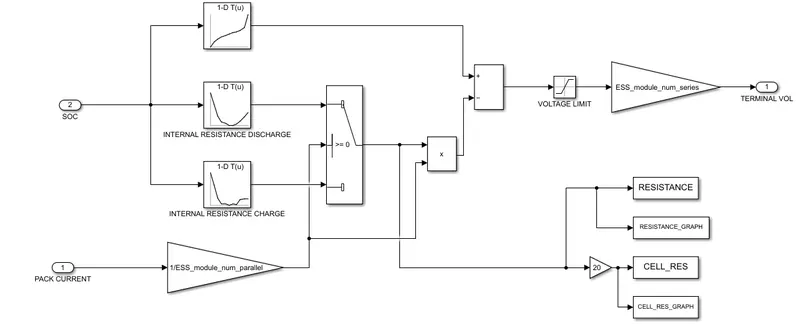
inside of terminal voltage bolck
we providing the input value in 1d lookup table for open curcuit voltage, internal resistance discharge , internal resistance charge and parall num module.
switch which checkes those values and pass further
gain of 20 is used because there is 20 cells .
Step 3: Create a plotting script in Matlab that takes the Simulink model output and creates desired plots.
clc
figure(1)
subplot(4,1,1)
plot(CURRENT_GRAPH,'r','linewidth', 2)
xlabel('TIME [S]')
ylabel('PACK CURRENT[A]')
grid on
legend('PACK CURRENT')

subplot(4,1,2)
plot(TER_VOLT_GRAPH,'b','linewidth', 2)
xlabel('TIME [S]')
ylabel('TERMINAL VOLTAGE[V] ')
grid on
legend('TERMINAL VOLTAGE ')

subplot(4,1,3)
plot(SOC_GRAPH,'g','linewidth', 2)
xlabel('TIME [S]')
ylabel('STATE OF CHARGE ')
grid on
legend('STATE OF CHARGE ')

subplot(4,1,4)
plot(RESISTANCE_GRAPH,'k','linewidth', 2)
xlabel('TIME [S]')
ylabel('RESISTANCE[ohm]')
grid on
legend('RESISTANCE ')
%
figure (2)
plot(CELL_RES_GRAPH,'m-','linewidth', 2)
xlabel('TIME [S]')
ylabel('RESISTANCE 20 CELL[ohm]')
grid on
legend('PACK OF 20 CELL RESISTANCE ')

% CHARGEING EFFICIENCY
CURRENT_CHARGE = CURRENT(CURRENT<0);
VOLTAGE_CHARGE = TER_VOLT(CURRENT<0);
P_CHARGE = mean (VOLTAGE_CHARGE.*CURRENT_CHARGE);
P_IDEAL_CHARGE =mean(154*CURRENT_CHARGE);
EFF_CHARGE=P_IDEAL_CHARGE/P_CHARGE

% DISCHARGEING EFFICIENCY
CURRENT_DISCHARGE = CURRENT(CURRENT>0);
VOLTAGE_DISCHARGE = TER_VOLT(CURRENT>0);
P_DISCHARGE = mean (VOLTAGE_DISCHARGE.*CURRENT_DISCHARGE);
P_IDEAL_DISCHARGE =mean(154*CURRENT_DISCHARGE);
EFF_DISCHARGE=P_DISCHARGE/P_IDEAL_DISCHARGE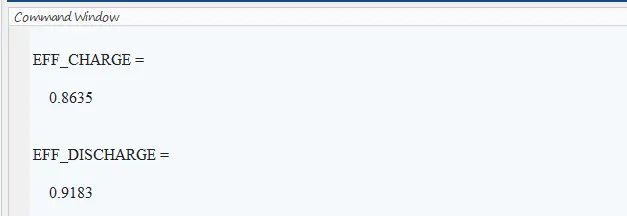
in above codes
charging efficiency = output/ input
where output = P_IDEAL_CHARGE
input = P_CHARGE
discharging efficiency = output/input
where output = P_CHARGE
input = P_IDEAL_CHARGE
output plots

THANK YOU