PART- II Wide Open Throttle (WOT) condition Comparison Between HEV Vs EV
AIM:
To Study HEV (Hybrid Electric Vehicle) and EV (Electric Vehicle) from Reference application project in Simulink.
THEORY :
HEV (Hybrid Electric Vehicle) :
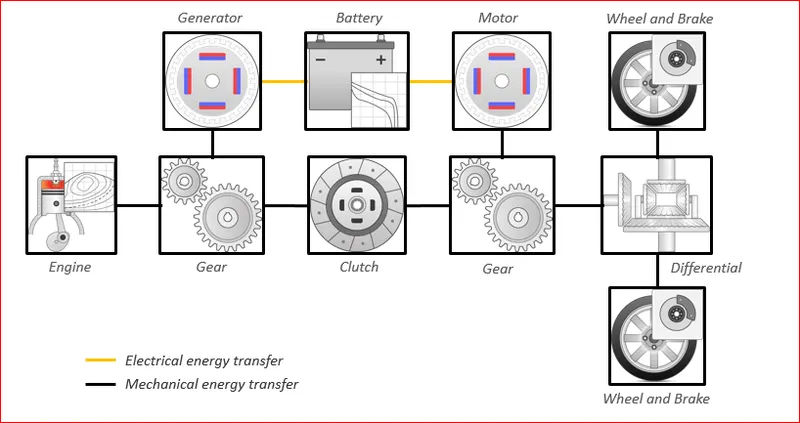
A hybrid electric vehicle (HEV) is as type of hybrid vehicle that combine a convectional and internal combustion engine (ICE) system with an electric propulsion system (Hybrid vehicle Drivetrain). The presence of the electric powertrain is intended to achieve either better fuel economy than a conventional vehicle or better performance. There is a variety of HEV types and the degree to which each function as an electric vehicle (EV) also varies. The most common form of HEV is the hybrid electric car, although hybrid electric truck (pickups and tractors) and buses also exist.
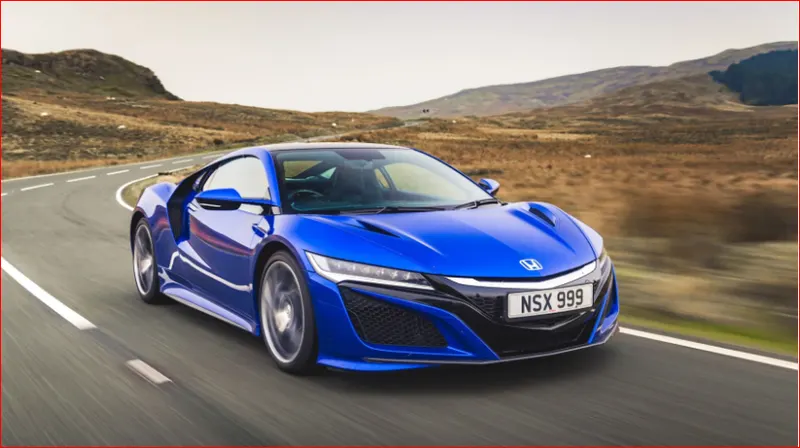
Honda NSX
The hybrid Honda NSX produces 573bhp, the majority of which comes from its 3.5-litre twin-turbocharged V6 petrol engine. The rest is developed by three electric motors: one for each front wheel and a third for the rear axle, giving the NSX four-wheel drive.
EV (ELECTRIC VEHICLE) :
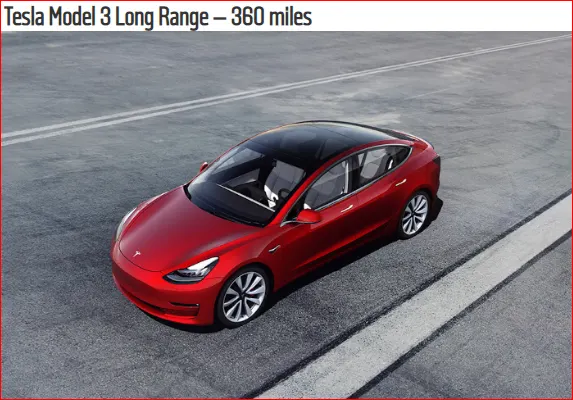
An electric vehicle (EV), also called electrics is a vehicle that uses one or more electric motor or traction motor for propulsion. An electric vehicle may be powered through a collector system by electricity from off-vehicle sources, or may be self contained with battery, solar panel , fuel cells or an electric generator to convert fuel to electricity but are not limited to Road and Rail Vehicle, surface and Underwater vessels, electric aircraft and electric spacecraft.
OBJECTIVES:
- To discuss what is the difference between Mapped and Dynamic model of engine, Motor and Generator?
To check how can we change the model type?
- To see how the model calculate mile per gallon?
Which factors are considered to model fuel flow?
- To run the HEV Reference Application with WOT drive cycle and to change the Grade and Wind Velocity in the “Environmental Block” and comment on Result.
- Keeping all other parameter same, Compare the Simulated Results of Hybrid and Pure Electric Powertrains.
Link for HEV Reference Model:
Link for EV Reference Model:
INTRODUCTION :-
POWERTRAIN Block Set-
- These are use to simulate automotive powertrain systems.
- PowerTrain BlockSet provides fully assembled reference application model of automotive powertrain which includes gasoline, diesel, hybrid, and electric systems. It includes components library for simulating engine subsystems, transmission assemblies, traction motor, Battery packs, and controller Model.PowerTrain BlockSet also includes a Dynamometer model for Virtual Testing.
- This can be referred as “The Library of Automotive Components used to construct a Vehicle Model” Ranging of all type and applications and later used for Simulation.
- PowerTrain BlockSet provide Standard model Architecture that can be use throughout the development process. You can use it for design trade-off Analysis and Component sizing, control parameter optimization and hardware in the loop testing. You can customize models by parameterizing component in a reference application with your own data or by replacing the sub-system with your own Model.
- PowerTrain BlockSet uses MATLAB and SIMULINK for the Simulation.
- What is difference between Mapped and Dynamic Model of Engine, Motor and Generator?
How can you change the model type?
- Difference Between Mapped & Dynamic Engine:
|
MAPPED ENGINE |
DYNAMIC ENGINE |
|
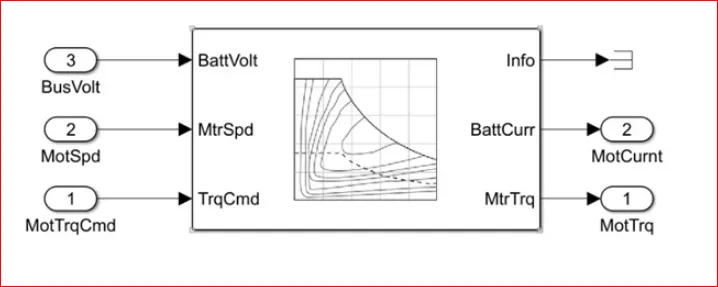
Model uses set of Steady State Look up table to Characterize Engine Performance. |
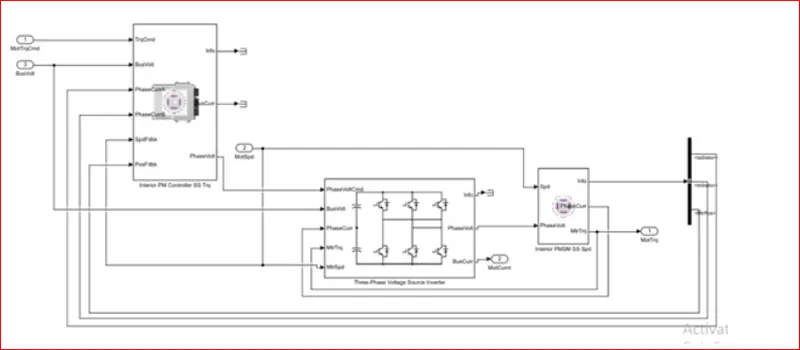
Model uses Actual Component Data to Characterize Engine Performance. |
|
The table provides overall engine characteristics, including Actual Torque, Fuel flow rate, BSFC, and Engine Out Exhaust Emission. |
They are suitable to run the Diagnostics or controlling the design parameter and are suitable for Running. |
|
Mapped Engine Model is generally Faster while operating. |
Dynamic Engine Model is usually Slower while operating. |
MAPPED ENGINE
DYNAMIC ENGINE
- Difference Between Motor and Generator :
|
MOTOR |
GENERATOR |
|
A Motor converts Electrical Energy to Mechanical Energy. |
A Generator converts Mechanical Energy to Electric Energy. |
|
Characteristics of the motor is the speed and torque curve are always positive, which resembles work being done with respect to automobile. |
Speed and Torque curve are always negative which signifies that the work is being done on the Automobile, which is use for Regenerative Braking. |
|
In Motor Current is supplied to the Armature Winding between the model types. |
Current is produced in the Armature Winding. |
|
Working Principle of the motor is based on the current carrying conductor that experiences the force when it is kept in the Magnetic field. |
The Working Principal of a Generator is based on Electromagnetic Induction |
To Change the model from Dynamic to Mapped or Mapped to Dynamic follow the following steps as mention below:
- In Simulink we can change the model type by following the method and also using Model Explore but this method is quit friendly.
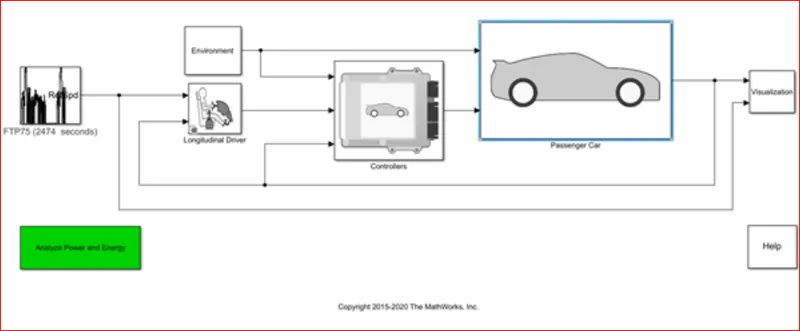
- To change the Model type we must enter into corresponding Block and then we must Double click on Passenger Car Block.
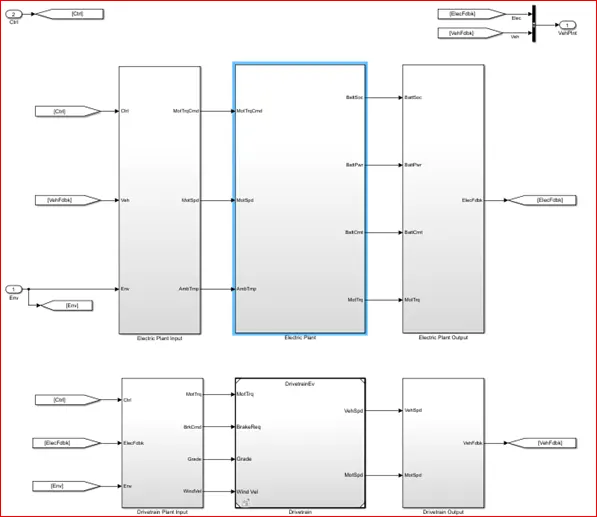
- After then we must Double click on the Electric Plant Block.
- Then we must Double click on Motor Block.
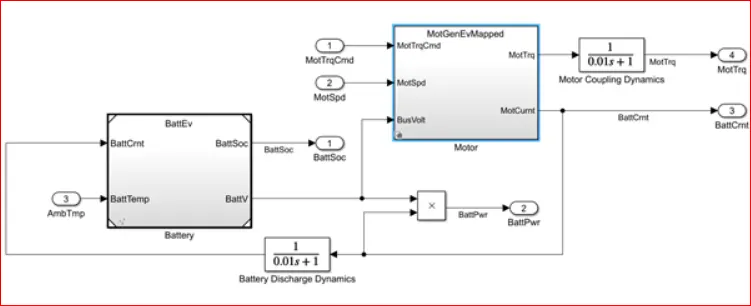
- We can now change the type of Model from Mapped to Dynamic by Right clicking on Empty space in the Workspace--à Variant ---àLabel Motor Active Choice and then we can see that the type which is active is mapped and the same is also activated in our workspace.

- We can just change the type to dynamic and now we can see that the same is also activated in our workspace.

- CALCULATING THE MILE PER GALLON
- Usually to calculate mile per gallon, the Automobile is 1st filled until its Fuel tank is full. Then Distance travelled in Odometer is noted and then the automobile is started and is used until all the fuel is consumed thus emptying the Fuel tank.
- Now at the end of trip the Distance travelled is noted down and the difference between both the readings of Distance travelled is found out. Then this difference value is divided by the total fuel tank capacity of the automobile, thus the resulting value obtained is the Average Mileage of the Automobile in mile per gallon.
- For example the vehicle initial odometer reading is 2000 miles and its fuel capacity is 10 gallon, after filling the fuel completely and starting the trip, at the end of trip e. when all the fuel is over , the reading on odometer is 3000 mile then,
Difference in Distance = 3000 – 2000 = 1000 miles
Fuel tank capacity = 10 gallon
Therefore, its mileage is 1000/10 = 100 mile per gallon.
- In the simulink model, it also calculates the performance in the similar manner.
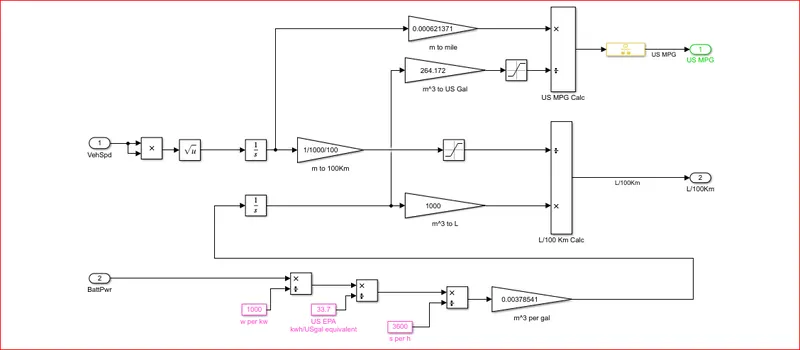
- In the above figure shows how the model calculate mile per gallon. Above model can be find in the “Visualization Block” of the HEV Model and in the “Visualization Block” click on “Performance Calculation Block” the above model will appear.
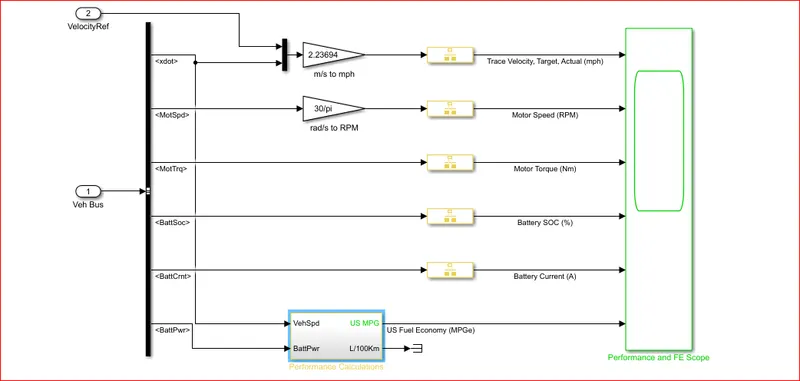
- In the above model we can observe that FACTORS that are needed as inputs to the model are Vehicle Speed, Fuel Volume Flow, and Battery power. As the value changes performance of the vehicle also changes.
- Here 1st the velocity of the vehicle is converted into Distance by integrating the velocity values and then Distance is converted from meter to mile and km.
- Then similarly Battery Power is converted into volume by multiplying and dividing by constant conversion value. Then the Battery and fuel volume flow are added and integrated to get the total volume of fuel consumed. Now this volume is converted from cubic meter to gallons and liters.
- Now the Distance and Volume of the fuel is divided to get the performance results in mile per gallon and liter/100km/
- Factors that are requiring modeling Fuel Flow are Battery Power, Conversions from Watt to cubic meter per gallon.
Factor consider to model Fuel flow:
- WEIGHT : The weight of the vehicle is consider as it plays an important role in determining the amount of fuel consumed as the weight increases the tractive efforts require to overcome the vehicles rest inertia will increase.
- Drive Cycle : At certain speed engine is able to operate at an RMP which provides maximum efficiency, driving at an irregular pace or higher speed makes the engine to provide lower efficiency. Aggressive acceleration and braking drive cycle decrease the fuel economy of the Drivetrain.
- Resistance: If the vehicle is subjected to high opposing wind speeds, road grade then there is high force acting on body, in particular “Aerodynamic Force” & “Hill-Climbing Force”. These forces increase the power needed to overcome the tractive efforts, in turn making the engine consume more Fuel. The effect of this force can be reduced to a certain effect by making the vehicle more Aerodynamic and light in weight.
III. Run the HEV Reference Application with WOT DriveCycle. Change the Grade and Wind Velocity in the Environmental Block. Comment on the results.
The reference HEV PowerTrain BlockSet is extracted from MATHWORKS: (link below)
https://in.mathworks.com/help/autoblks/ug/explore-the-hybrid-electric-vehicle-p0-reference-application.html
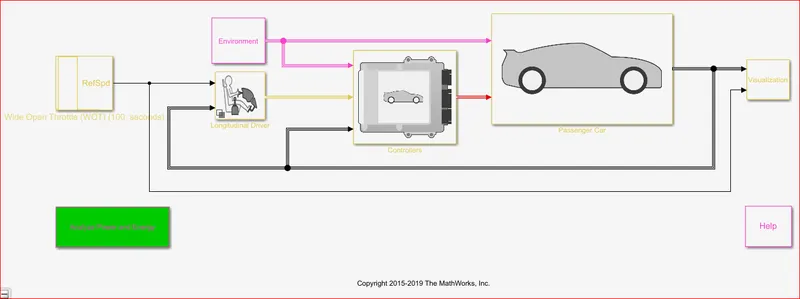
- Drive Cycle Source Block - Generates Standard or user- specified drive cycle velocity versus time profile. In this simulation we are evaluating WOT.
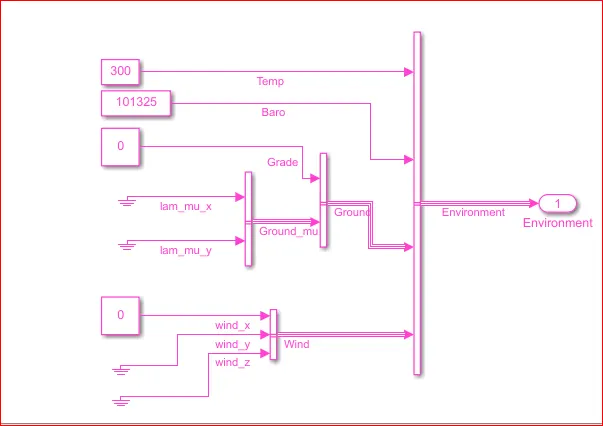
- EnvirnomentsSubsystem – Creates Environment variables including road grade, wind velocity, atmosphere temperature & pressure.
- ControllerSubsytem – Implements powertrain control module (PCM) containing an input power-split hybrid control module (HCM) & an Engine control Module (ECM).
- Passenger CarSubsystem – Implements a Hybrid Passenger car that contains Drivetrain, Electrical parts and Engine Subsystems.
- VisualizationSubsystem – Display vehicle level performance, Battery state of Charge (SOC), Fuel Economy & Emission results that are useful for Powertrain matching and component selection analysis.
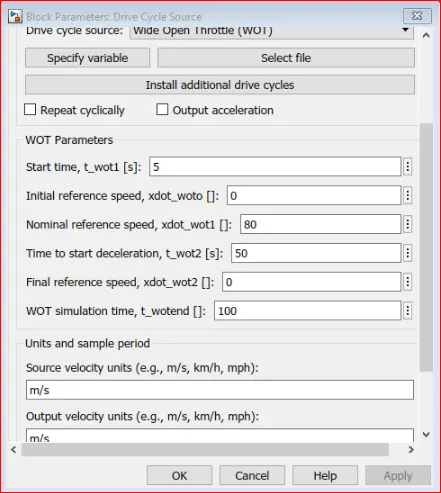
We change the DriveCycle to WOT and set the parameters as –
Nominal Speed = 80 Mph.
Time to Start deceleration = 50 sec.
Simulation Time = 100 sec.
Wind Velocity = 0 m/s.
Grade = 0
RESULT-1 SCOPE :-
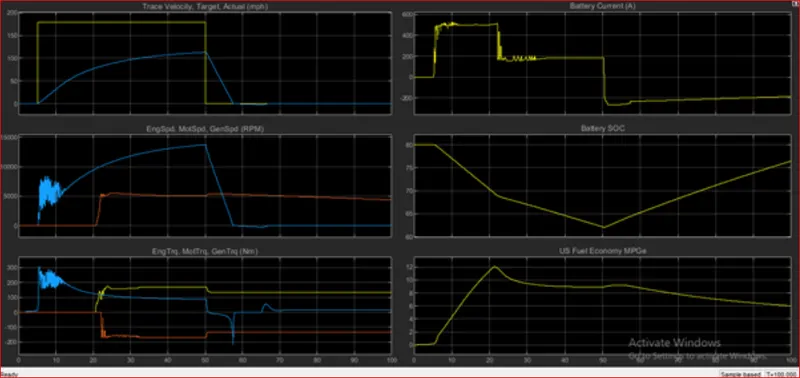
Plot -1 Trace and Actual Velocity
We see here the trace velocity is given as input and actual velocity is the output
Top velocity achieved = 113 Mph
Time taken to attempt maximum acceleration = 19.80 Sec.
Time taken to Decelerate = 70477 Sec.
Plot -2 Engine, Motor, Generator Speed
Maximum Engine Speed = 54577.57 RPM.
Maximum Motor Speed = 13710.66 RPM.
We see whenever the SOC falls below 70 % the Engine gets Activated by providing torque as well as charging the Battery.
Plot-3 Engine, Motor , Generator Torque
Maximum Torque of Engine = 173 Nm.
Maximum Torque of Motor = 306 Nm.
Maximum Torque generator = 11 Nm.
Plot-4 Battery Current
The maximum Current provided by the Battery is around 512 Amperes and after reaching certain points this value is constant and is the Maximum Ampere Limit of the Battery.
As soon as the Engine and Generator gets started the Battery Current Drop as load is shared by the Engine & current goes negative because of occurrence of Regenerative Braking.
Plot-5 Battery soc (State Of Charge)
The SOC of the Battery is decreased from 80 % to 68% when the motor starts working, after 68 % the slope of the line decreased because partial load is shared by the Engine.
During this Time SOC is increased because of the Regenerative Braking.
Because of SOC 80% to 63% in 45.509 Seconds.
Plot-6 US Fuel Economy MPGe vs Time
Highest MPGe = 12
Changing the Parameter for WOT condition – II
Nominal speed = 60 Mph.
Time to Start Deceleration = 40 Sec.
Simulation Time = 100 Sec
Wind Velocity = 10 m/s
Grade = 5
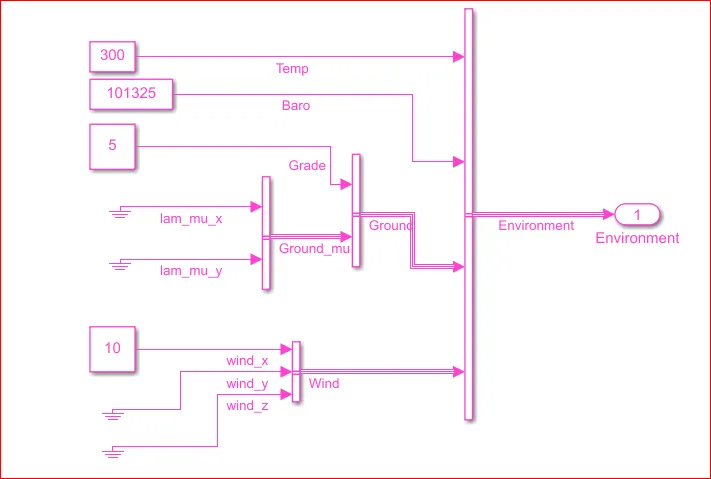
RESULT-2 SCOPE :-
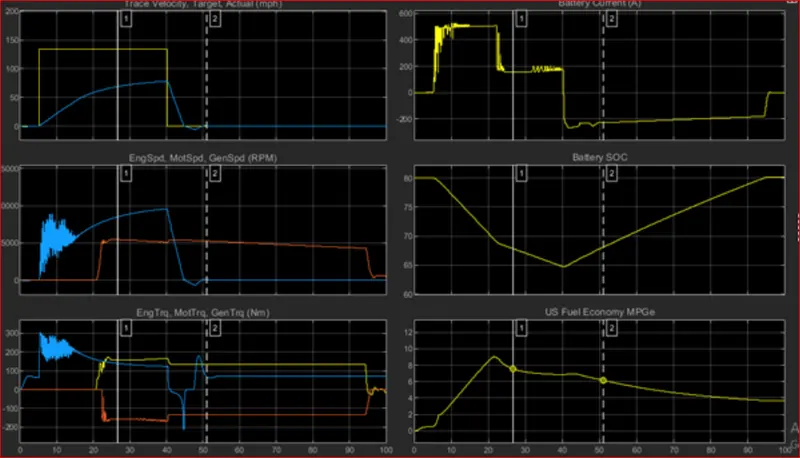
Plot -1 Trace and Actual Velocity
We see here the trace velocity is given as input and actual velocity is the output
Top velocity achieved = 74 Mph
Time taken to attempt maximum acceleration = 40.30 Sec.
Time taken to Decelerate = 4.242 Sec.
Plot -2 Engine, Motor, Generator Speed
Maximum Engine Speed = 54577.57 RPM.
Maximum Motor Speed = 9571 RPM.
We see whenever the SOC falls below 70 % the Engine gets activated by providing torque as well as charging the Battery.
Plot-3 Engine, Motor , Generator Torque
Maximum Torque of Engine = 168.3 Nm.
Maximum Torque of Motor = 287.8 Nm.
Plot-4 Battery Current
The maximum Current provided by the Battery is around 570 Amperes and after reaching certain points this value is constant and is the Maximum Ampere Limit of the Battery.
As soon as the Engine and Generator gets started the Battery Current Drop as load is shared by the Engine & current goes negative because of occurrence of Regenerative Braking.
Plot-5 Battery soc (State Of Charge)
The SOC of the Battery is decreased from 80 % to 68% when the motor starts working, after 70 % the slope of the line decreased because partial load is shared by the Engine.
During this Time SOC is increased because of the Regenerative Braking.
Because of SOC 80% to 63% in 34.531 Seconds.
Plot-6 US Fuel Economy MPGe vs Time
Highest MPGe = 9
|
PARAMETERS |
Simulation - I |
Simulation - II |
|
Grade (Degree) |
0 |
5 |
|
Wind Velocity (m/s) |
0 |
10 |
|
Deceleration Time (Sec) |
7.477 |
4.242 |
|
Max. Engine Torque (Nm) |
173 |
168.3 |
|
Peak Motor Torque (Nm) |
306 |
287.8 |
|
Max. Battery Current drawn (A) |
512 |
570 |
|
Battery (SOC) |
80% to 68% |
80% to 66% |
|
Fuel Economy (MPG) |
12 |
9 |
CONCLUSION :-
- There exists a different between actual velocity curve and the input curve due to the limitation on maximum power available from propulsion / energy sources.
- Limiting factors involves current or battery module.
- The maximum speed achieved in Simulation – II is lesser compared with Simulation – I because of opposing wind force & presence of Grade angle.
- Increase in Grade angle can be observed from plots.
- WOT Response time increases.
- Velocity Decreases.
- The Battery SOC also decreases considerably with the increase in traction forces.
- Fuel Economy falls to greater extent with the increase in demanding traction power.
IV. Keeping all the parameter same, compare the simulated results for Hybrid and Pure Electric Powertrains.
Pure Electric Vehicle:-
link:- https://in.mathworks.com/help/autoblks/ug/electric-vehicle-reference-application.html
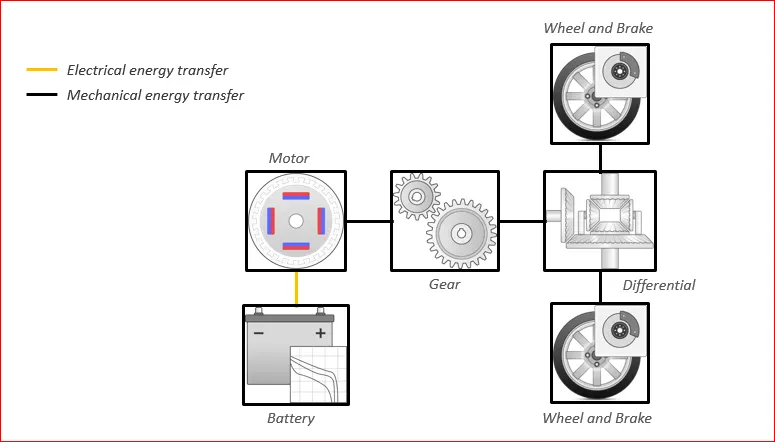
Hybrid Electric Vehicle:-
SIMULATION –WOT (3) (EV)
Grade Angle = 10 Degrees.
Wind Velocity = 15 m/s.
Total Simulation Time = 100 Sec.
Nominal Speed = 45 m/s.
Deceleration Time = 40 Seconds.
EV RESULTS:-
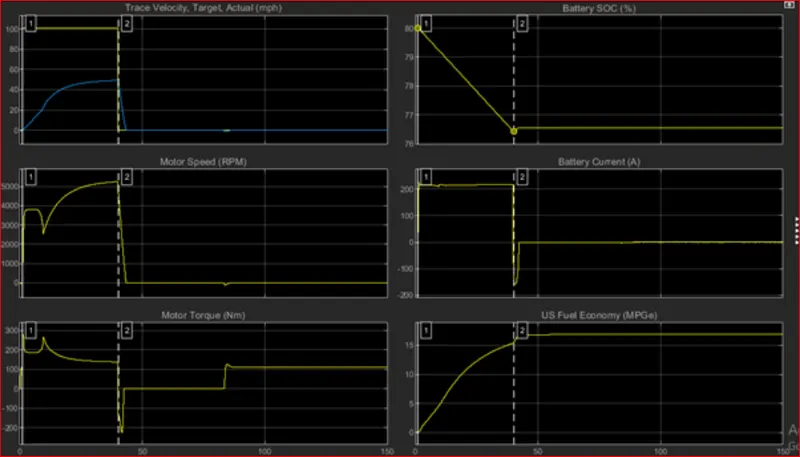
HEV RESULTS:-
EXPLANATION:-
- By Clicking the above link of EV reference model following model will open which will similar to that of HEV reference model, nut inside EV model there will no Engine Model or Block. The drive cycle is changed like the previous model to WOT DriveCycle.
- Now when we run the model, we get the following results.
- Here in the above figure, in the 1st Graph we can see the top speed is achieved at 14 seconds which is very Quick than the HEV Model Graph the time taken to come to Zero Velocity from Top Speed is nearly 5 Seconds. So totally it takes 19 seconds to achieve top speed and come back to rest, which is quick than HEV Model.
- In the 2nd Graph, we can observe that the graph is much smoother than HEV Model. Thus, in Electric Vehicle the motor speed is smoother than HEV motor Speed.
- In the 3rd Graph, here also the Torque of Motor is much smoother than HEV Model and we can also observe that while vehicle is decelerating, it is in Regenerative Braking Mode, that’s why Torque is Negative while deceleration.
- In the 4th Graph, the SOC of Battery decreases slowly like HEV Model but here it decreases much more than the HEV Model. Since in Electric Vehicle only Battery is used so Battery is Consumed More thus while achieving top speed the SOC Line in the graph falls down more than that of HEV Model graph. Since Regenerative Braking is happening, which charge the battery so the curve has raised little bit at the end
- In the 5th Graph, we can observe that the current consumed the EV is less than that of HEV as the Mass of the EV is less as compared to HEV, so less current to used compared to HEV. Is Charge the Battery.
- In the 6th Graph, we can see that the fuel economy the Vehicle is very high than that of HEV. Thus, concluding that EV is now Fuel Efficient than HEV.
|
PARAMETERS |
EV |
HEV |
|
Grade (Degree) |
10 |
5 |
|
Wind Velocity (m/s) |
15 |
10 |
|
Deceleration Time (Sec) |
4.192 |
4.242 |
|
Max. Engine Torque (Nm) |
- |
168.3 |
|
Peak Motor Torque (Nm) |
290 |
287.8 |
|
Max. Battery Current drawn (A) |
512 |
570 |
|
Battery (SOC) |
80% to 68% |
80% to 66% |
|
Fuel Economy (MPG) |
17 |
9 |
CONCLUSIONS:-
- The Pure EV Drive achieves less top speed compared to HEV.
- Motor used in EV must be of more capacity that of HEV.
- EV Drive all power from motor alone hence EV developed more Torque whereas in HEV motor and engine combined produces more Torque and propels the system.
- Instantaneous Torque at the start is more in EV compared to HEV.