Project 1 - Parsing NASA thermodynamic data
AIM :
To write a code in matlab for parsing the NASA Thermodynamic data file and using this extracted data to calculate specific data, enthalpy, entropy and molecular mass of each species.
FILE PARSING :
Parsing a file means reading in a data stream of some sort and building an in memory model of the semantic content of that data .This aims at facilitating performing some kind of transformation on the data. Parsing , syntax analysis, or syntactic analysis is the process of analyzing a string of symbols, either in natural language, computer language or data structure, conforming to the rules of former grammar. Within computer linguistics the term is use to refer to the formal analysis by a computer of a sentence or other strings of words into its constituents, resulting in a parse tree showing the syntactic relation to each other, which may also contain semantic and other information . some parsing algorithms may generate a parse forest or list of parse trees for a syntactically ambiguous input
GOVERNING EQUATIONS :
For Specific Heat
`C_p/R=a_1+a_2.T+a_3.T^2+a_4.T^3+a_5.T^4`
For Enthalpy
`H/RT=a_1+a_2.T/2+a_3.T^2/3+a_4.T^3/4+a_5 T^4/5+a_6/T`
For Entropy
`S/R=a_1.log(T)+a_2.T+a_3.T^2/2+a_4 T^3/3+a_5.T^4/4+a_7`
Where,
T = Local Temperature
`C_1 to C_7` = High Temperature coefficients
`(C_1 to C_14 are the numerical coefficient provided in NASA_Thermo.data file )`
`C_8 to C_14` = Low Temperature coefficients
`C_(p )`= Specific Heat
H = Enthalpy
S = Entropy
R= Universal Gas constant = 8.314 J.K mol
OBJECTIVES:
- To extract data from the given NASA Thermodynamic data file.https://drive.google.com/file/d/1AikCHDlz9s_fu8whE81qee_GD4AyYpCP/view
- To find Specific Heat ,Enthalpy and of each species at different local temperatures.
- To find a logic to calculate a Molecular Weight of each species.
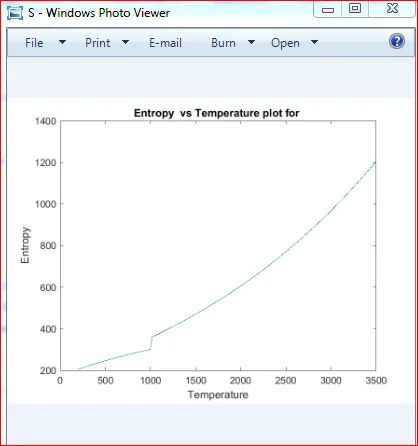
- To plot ‘`C_p` ’ vs ‘T’ and ‘S’ vs ‘T’ graph using the calculation results.
- To save the graphs of each species in a folder.
IMPORTANT SYNTAX USED DURING CODING:
Fopen( ) Open a file or obtain information about open files.
“ r “ Open the file for read.
Fgetl( ) Read line from file.
Strtrim( ) Remove the leading tab and spaces, removes the leading whitespace characters, but not the whitespace between other characters.
Strsplit( ) Split string or character vector at specified delimiter in to cell.
Srt2num( ) Convert character array or string to numerical array.
Strok( ) Return selected part of string.
Strfind( ) find one string with another by specifying it in delimiter.
Linspace() Generate linearly spaced vectors.
Str2double( ) command is use convert string to number in double precious value
Strcmp() command is use to compare 2 string and passes logic if true as 1 and if false as 0
Fprintf() command is use to print the text statement in the command window
Mkdir() command is used to create the directory “folder name “ in the current directory
Cd() command is use to the current working directory is set to directory that we open using“mkdir”.
PROGRAM:
CODE:-
clear all
close all
clc

f1 =  fopen('THERMO.DAT','r');
% Skip the header using fgetl
Heading = fgetl(f1);

%  Get the first line
tline = fgetl(f1);


 % Get the global temperature  range values
 % Split value with strsplit
  temp = strsplit(tline,' ');

  % Converting temp string of cell to number and denoting it as
  % GLOBAL_TEMPERATURES
  global_low_temp = str2num(temp{2});
  global_mid_temp = str2num(temp{3});
  global_high_temp = str2num(temp{4});

  % Reading comment lines
  for i = 1:3

  comments = fgetl(f1);
  end


%   To Extract coefficient of species and doing calculation
 for    i = 1:53
    species_line = fgetl(f1);
    species_name  = strsplit(species_line,' ');
    Species_SP =species_name{1};


%    Finding coefficient for each Species by reading each line
first_line = fgetl(f1);
a = findstr(first_line,'E');
second_line = fgetl(f1);
 b = findstr(second_line,'E');
third_line = fgetl(f1);
c = findstr(third_line,'E');

%   Extracting HIGH-Temperature Coefficient - 1st 7 coefficient
  C1 =   str2num(first_line(1:a(1)+3));
  C2 =   str2num(first_line(a(1)+4:a(2)+3));
  C3 =   str2num(first_line(a(2)+5:a(3)+3));
  C4 =   str2num(first_line(a(3)+4:a(4)+3));
  C5 =   str2num(first_line(a(4)+5:a(5)+3));
  C6 =   str2num(second_line(1:a(1)+3));
  C7 =   str2num(second_line(a(1)+4:a(2)+3));

  %   Extracting LOW-Temperature Coefficient - 2nd 7 coefficient
  C8 =   str2num(second_line(a(2)+5:a(3)+3));
  C9 =   str2num(second_line(a(3)+4:a(4)+3));
  C10 =   str2num(second_line(a(4)+5:a(5)+3));
  C11 =   str2num(third_line(1:a(1)+3));
  C12 =   str2num(third_line(a(1)+4:a(2)+3));
  C13 =   str2num(third_line(a(2)+5:a(3)+3));
  C14 =   str2num(third_line(a(3)+4:a(4)+3));


%   Universal Gas constant
  R = 8.314 ;

%   Extract local temperature for each Species line
  local_low_tempa = str2double(species_name{end-3});
  local_mid_tempa = str2double(species_name{end-1});
  local_high_tempa = str2double(species_name{end-2});

  % Temperature Range
  T = linspace(local_low_tempa,local_high_tempa,150);

  % Calculating Cp , H , S
   for i = 1:length(T)
  if  T(i) < local_mid_tempa
      Cp(i) =  R*(C8 + C9.*T(i) + C10.*T(i).^2 + C11.*T(i).^3 + C12.*T(i).^4);
      H(i) =  (C8 + C9.*T(i)/2 + (C10.*T(i).^2)/3 + (C11.*T(i).^3)/4 + (C12.*T(i).^4)/5 + C13./T(i))*R.*T(i) ;
      S(i) =  (C8.*log(T(i)) + C9.*T(i) + (C10.*T(i).^2)/2 +(C11.*T(i).^3)/3 + (C12.*T(i).^4)/4 + C14)*R ;
  else
      Cp(i) =  R*(C1 + C2.*T(i) + C3.*T(i).^2 + C4.*T(i).^3 + C5.*T(i).^4);
      H (i) =  (C1 + C2.*T(i)/2 + (C3.*T(i).^2)/3 + (C4.*T(i).^3)/4 + (C5.*T(i).^4)/5 + C6./T(i))*R.*T(i) ;
      S (i) =  (C1.*log(T(i)) + C2.*T(i) + (C3.*T(i).^2)/2 +(C4.*T(i).^3)/3 + (C5.*T(i).^4)/4 + C7)*R ;
  end
   end

  % Molecular Weight Calculation for each 53 species
 EL = ['H', 'O', 'C', 'N', 'A'];
  atomic_weight  = [1 16 12 14 40];
  Mol_weight = 0;
  for j = 1:length(Species_SP)
      for k = 1:length(atomic_weight)
          if strcmp(Species_SP(j),EL(k))
              Mol_weight = Mol_weight + atomic_weight(k);

          end
      end

      position = k ;
  % Calculating Molecular Weight of each species
  number = str2double(Species_SP(j));
  if number > 1
      Mol_weight = Mol_weight + atomic_weight(position)*(number-1);
  end
  end

M = Mol_weight
fprintf('The molecular weight of %s is %d g/mol',Species_SP,M);

%Providing path for saving data

mkdir(['C:\Users\Omkar\Desktop\Matlab scripts\Plots\',Species_SP]);

% Going into the folder of the species to save the plots
cd(['C:\Users\Omkar\Desktop\Matlab scripts\Plots\',Species_SP]);

% Plotting
figure(1)
plot(T,Cp)
title(['Specific Heat  vs Temperature plot for '])
xlabel('Temperature')
ylabel('Specific heat')
saveas(gcf,'Cp.png');


figure(2)
plot(T,H)
title(['Enthalpy  vs Temperature plot for '])
xlabel('Temperature')
ylabel('Enthalpy')
saveas(gcf,'H.png');


figure(3)
plot(T,S)
title(['Entropy  vs Temperature plot for '])
xlabel('Temperature')
ylabel('Entropy')
saveas(gcf,'S.png');


end
EXPLANATION:
- Here, first the command “close all”, “clear all”,”clc” are use to close all previous plots and to clear the workspace and command window respectively.
- To read the NASA data file, first we have to open the data file, so open and read the file, we use command ‘fopen ()’, where we mention the file which we have to be opened and whether we want to read that file or write in that file we can mention it in delimiters, where” r “means Read and “w “means Write.
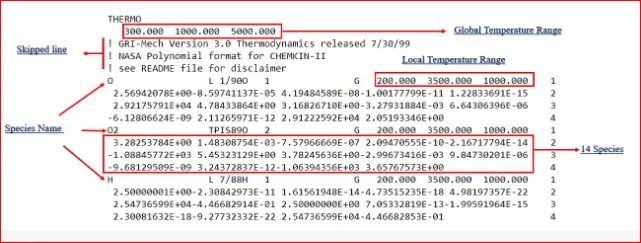
- Since here we have to read the file, inside the bracket of ‘fopen’ command we have given “THERMO.dat” and “r” .this command is assigned to variable “f1”.
- Now to read the 1st line of the NASA data file we use a command “fgetl()”.This command help us to read each line of the data file individually. if we repeat this command again ,then it will read next line after the previous read line by previous “fgetl()” command, i.e. when we type fgetl command for the 1st time it will read 1st line and if we again type “fgetl()” command we will now read the 2nd line and again if we type “fgetl()” command for 3rd time it will now read 3rd line and so on.
- So for reading each line “fgetl ()” command is use .For example if we have to read 12 line then we have to type “fgetl” command 12 times. Then only we will able to read 12th
- So to read the heading line i.e. 1st line of NASA data file, 1st “fgetl ()”is used in the above code .This 1st “fgetl” command is assigned to a variable “Heading”.
- Then to read the next line i.e. Global temperature line in the data file, we have typed the 2nd “fgetl ()” command to read the temperature line and assigned it to variable “tline”, we get, ' 000 1000.000 5000.000 ‘ Now whenever we use “fgetl” command its give output as a string, so till here our Global temperature line is string we can’t further use it for calculations.
- In order to convert these strings into array we have followed logic here, now when we observe the temperature string we can see that the each value is separated by space, now use this space to separate these values.
- Here to separate the value we have used a command “strsplit()” ,this command here take the inputs as the line that has to be split and at which part of the line it has to be splited in the above as mentioned before we are splitting the line where the space ‘ ‘ is there so as input we given line that has to be split as “tline” and it has to split at space so we entered 2nd input as ‘ ‘ e. space in inverted commas.
Temp = 1×3 cell array
{'300.000'} {'1000.000'} {'5000.000'}
- Once we execute this we will get the cell array, where each values have been separated by string, now cell array means that it is a data type with indexed data containers called as cells, where each cell can contain any type of data, cell array commonly contains either list of characters vectors of different length, or mix of strings and number, or numeric arrays of different sizes. This cell array is assigned to variable “temp”.
- Once we have obtained cell array, still these values are characters not a numbers, so to convert them in number array we have used a command “str2num ()”, which converts a string value into number, now inputs for this command are, which characters has to be change to number .In our code from the cell array we need to convert '300.000' '1000.000' '5000.000' into number array. So in the “str2num” we have given the position of these characters and assigned them to variable “global_low_temp” , ”global_mid_temp” and ”global_high_temp” respectively. Since we are giving position of characters in a cell array we have used {} [curl brackets] in the command. We can’t use general brackets that we use normally to define the index or position of an element.
% Converting temp string of cell to number and denoting it as
% GLOBAL_TEMPERATURES
global_low_temp = str2num(temp{2});
global_mid_temp = str2num(temp{3});
global_high_temp = str2num(temp{4});
- Next, we have entered “fgetl()” command 3 times each one is assigned to a variable commen_1, comment_2, comment_3, this is just to read the next 3 lines that are comment in data file .
OR
For LOOP i = 1:3
comments = “fget(f1)” can be use .
- After the comment lines information regarding species is there in the data file, now to extract all this information, we have to 1st extracted information of 1st species then, for this we applied FOR LOOP so that for all 53 species we can extract data easily.
- 53 species because after running the below for loop we can get the total no. of line present in the whole data which is 218 line in all , now 1st 5 line are consider comments and last line in data is a line “END” so in all 6 comments line subtract it with 218 we get 212 now looking at data care fully we see after 1st 5 line start from top 6th line is species name and see far most left from 6th line on left we see 1 to 4 line each time that are the coefficient for that species so we divide 212by 4 to get the no. of species.
f1 = fopen('THERMO.DAT','r');
N=1;
A=fgetl(f1)
% A= "omkar"
while ( strcmp(A,'END')==0)
A=fgetl(f1);
N=N+1
end
- Now bigger FOR LOOP is created of i = 1:53 and under it we write the code to extract 1st species that goes to all 53 species
- Now logic for extracting the coefficient of species is , 1st using “fgetl()” command species 1st line is read and it is assigned to a variable named “species_line” .
- Then “strsplit()” command is use to with 1st input as species_line and 2nd input as spacebar “ “ ,which means species_line is converted into separate cell after space
O L 1/90O 1 G 200.000 3500.000 1000.000 1
H2O2 L 7/88H 2O 2 G 200.000
3500.000 1000.000 1
we can see space separate each variable by space bar and convert it to cell which is still a string using srtsplit() command.
species_line = fgetl(f1);
species_name = strsplit(species_line,' ');
Species_SP =species_name{1};
- A variable name Species_SP is created and the 1st position of string species_name is mention inside curdle brackets {} to extract species real name (observe data)
- Then in the data file next line after the species line is the first_line of coefficient, so to read this line again “fgetl ()”is used.
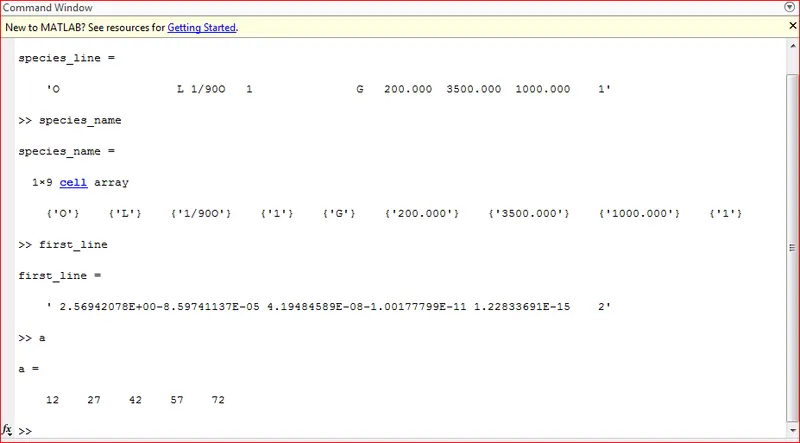
- Now to get each coefficient individually , 1st of all we have identified the position of “ E “ (exponential) in the first_line of coefficient string , to identify this “ E “ we have used the command “findstr()”. For this command 1st inputs should be given as name of string in which we are finding,2nd delimiters input should be what we are finding in the string i.e. “ E “ and assigning it to variable named “ a “ similar coding is done for second_line & third_line.
% Finding coefficient for each Species by reading each line
first_line = fgetl(f1);
a = findstr(first_line,'E');
second_line = fgetl(f1); will read 2nd line of coefficient
b = findstr(second_line,'E');
third_line = fgetl(f1); will read 3rd line of coefficient
c = findstr(third_line,'E');
- After executing this code we get the position of “ E “ in 1st line of coefficient as below,
- Above figure show us the results we got in command window after executing code till here.
- When we execute the command this command will give us the position of “ E “ e. at which position in the string “ E “ is present . by using the position of “ E “ we can find the coefficient by defining the position before and after “ E ”.
- Thus by following this logic we have found each coefficient and converted them into number string using “ str2num() “ command . Each coefficient in the first_line is assigned to a variable C1 , C2 , C3 , C4 , C5.
- Similar logic is applied for extracting coefficient from second_line & third_line in the data file. As shown below.
Coefficient are :-
C1 = str2num(first_line(1:a(1)+3));
C2 = str2num(first_line(a(1)+4:a(2)+3));
C3 = str2num(first_line(a(2)+5:a(3)+3));
C4 = str2num(first_line(a(3)+4:a(4)+3));
C5 = str2num(first_line(a(4)+5:a(5)+3));
C6 = str2num(second_line(1:a(1)+3));
C7 = str2num(second_line(a(1)+4:a(2)+3));
C8 = str2num(second_line(a(2)+5:a(3)+3));
C9 = str2num(second_line(a(3)+4:a(4)+3));
C10 = str2num(second_line(a(4)+5:a(5)+3));
C11 = str2num(third_line(1:a(1)+3));
C12 = str2num(third_line(a(1)+4:a(2)+3));
C13 = str2num(third_line(a(2)+5:a(3)+3));
C14 = str2num(third_line(a(3)+4:a(4)+3));
- Since we have used FOR LOOP, so every time LOOP is executed automatically it will extract coefficient of each 53 species when each time FOR LOOP is executed and variable are assigned accordingly.
- Now once the coefficient are extracted these are use for calculating specific heat, enthalpy, entropy.
- Before entering formula for specific heat , enthalpy , entropy, Universal Gas Constant value is entered and assigned to a variable “ R “ R = 8.314
- Now for each species in the data file there is separate local temperature. This temperature range should be used to calculate specific heat, enthalpy and entropy.
- The line in which Local temperature co-ordinate are present is already called by “fgetl ()” command before finding the coefficient of species and are stored in variable name “species_name”
- Now to extract the local temperature which at the end of specie_name we use below logic.
% Extract local temperature for each Species line
local_low_tempa = str2double(species_name{end-3});
local_mid_tempa = str2double(species_name{end-1});
local_high_tempa = str2double(species_name{end-2});
- The command “str2double()” is to convert the string no. into useful no. which can further use for calculation and inside str2double command position of each local temperature is mention.
- Then temperature range is mention using the linspace command with the inputs as(local_low_temp,local_high_temp,150) and assign it to variable “T”
- Then we have used “if “statement to find “Specific heat”, “Enthalpy”, “Entropy” at low temperature and high temperature. Since first 7 coefficients are high temperature coefficient and next 7 are low temperature coefficients.
- For loop is created i = 1 : length(T) so we can use LOCAL TEMPERATURE range of each species and can evaluate it Cp, H, S formula.
- T(i) , (i) because 1st iteration of 1:53 each time T value is consider as per present in at end of species name.
- So “ if “ statement execute first set formulas if temperature are less then Local_mid_tempa & if temperature is higher than Local_mid_tempa then it will execute second set of formula in “ else “ statement.
- Formula for specific heat , enthalpy, entropy are assigned to variable “ Cp “ , “ H “ , “ S “ respectively. and ended with two end 1st for “FOR LOOP” 2nd end for ” IF ELSE ”
- Now to calculate Molecular Weight of each species we write Logic as below.
% Molecular Weight Calculation for each 53 species
EL = ['H', 'O', 'C', 'N', 'A'];
atomic_weight = [1 16 12 14 40];
Mol_weight = 0;
for j = 1:length(Species_SP)
for k = 1:length(atomic_weight)
if strcmp(Species_SP(j),EL(k))
Mol_weight = Mol_weight + atomic_weight(k);
end
end
position = k ;
% calculating Molecular Weight of each species
number = str2double(Species_SP(j));
if number > 1
Mol_weight = Mol_weight + atomic_weight(position)*(number-1);
end
end
M = Mol_weight
fprintf('The molecular weight of %s is %d g/mol',Species_SP,M);
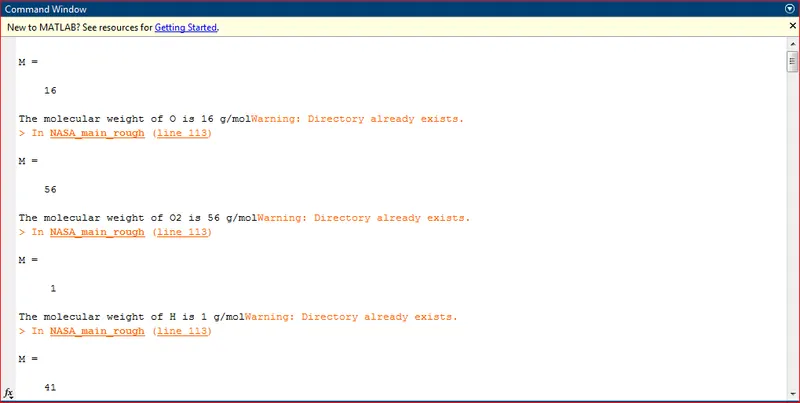
- If we observe the data file, every species comprises of Carbon, Hydrogen, Oxygen, Nitrogen, Argon, so using these we will compare the species with them and see what are the elements that each species consist of , and then adding up atomic weight of each element to find molecular weight of the species .
- So 1st we have created a string that comprises of above elements 1st letter it is assigned to a variable “EL” ,then an array is created comprising of each of the above element’s atomic mass value is array is assigned to a variable “atomic_weight”
- A variable “Mol_weight” is assigned and its value is given 0 initially. Then a FOR LOOP is used in which the number of characters in a Species_SP is taken as length and then again another NESTED FOR LOOP of length ‘atomic_weight’ array is taken and for each value of Species_SP (j) each value of atomic weight is taken .
- Then if statement is used with a command “strcmp()” which compare the characters entered in it as inputs and if both the character match with each other then it gives output as 1 that means it will allow the next line to execute in the code which is typed after “if” statement and if the characters do not match then it will return 0 as output that means “if ” statement will stop the code to execute further and the code go back to repeat the FOR LOOP with new values. It act like gateway.
- If the “if” statement is satisfied then the atomic weight is added to the initial molecular weight and new molecular weight is obtained, now this molecular weight is the initial molecular weight for the next iteration in the FOR LOOP .
- Then another “if” statement is entered as in some species more than one same elements are present . so to calculate that also another “if” statement is used .Now in “Species_SP” numbers are present when same element is more than one in single species . when these number comes in an iteration , the 1st “if” statement will not pass this to execute the line inside this “if” statement.
- Then the 2nd “if” statement is checked , before going to 2nd “if” statement this number is a character data type so it has to change to number using “str2double()”. This is assigned to a variable “number” .After converting, the “if” statement is checked and if the statement is satisfied “Mol_Weight” is further calculated and new value is stored. Thus giving us the final Molecular Weight for that particular iteration.
- This new value of Molecular Weight is then taken as initial Molecular weight for next iteration and this continues until atomic weight of all elements in the species are added up and the final Molecular Weight is obtained
- FOR LOOP is ended and final molecular weight is calculated and this molecular weight is assigned to a variable “M”.
- Then “fprintf()” command is used to print the text statement in the command window that tell us the molecular weight of each species .
- Next to save the graph 1st a path where these graph are to be saved is entered .
- Then “mkdir(foldername)” command is used to create the directory “folder name “ in the current directory. Then using command “cd(foldername)” the current working directory is setto directory that we open using “mkdir”.
- Then plotting is done using command “plot()”,”title()”,”xlabel”,”ylabel” and “saveas”.
- Here each plot is separated with “figure()” command and the “saveas()” command saves the each figure in the folder that we opened before ,we entered before lpotting commands and also it saves with the name of file that we have mention for each graph in that “saveas()” command.
- Finally “cd..” is used to close th opened folder. Thus creating each folder for each species having 3 graph in their individual folder.
- Then the main FOR LOOP is ended and thus coefficient of each species is extracted and used to calculate “SpecificHeat”,”Enthalpy”,”Entropy” & “Molecular Weight”.
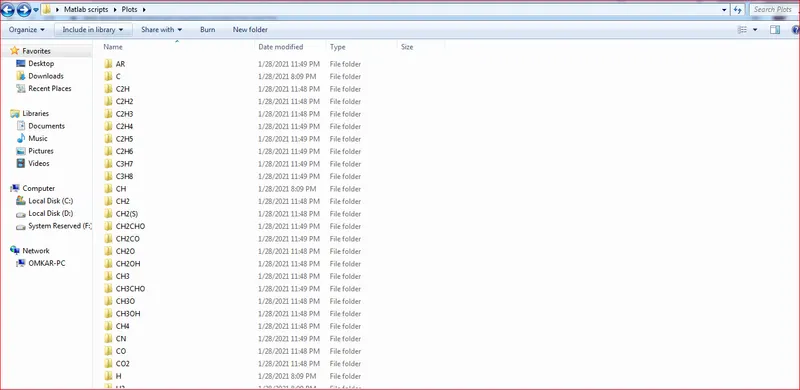
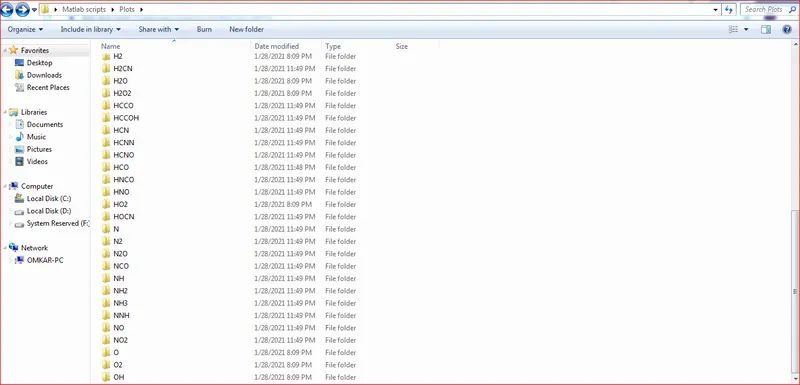
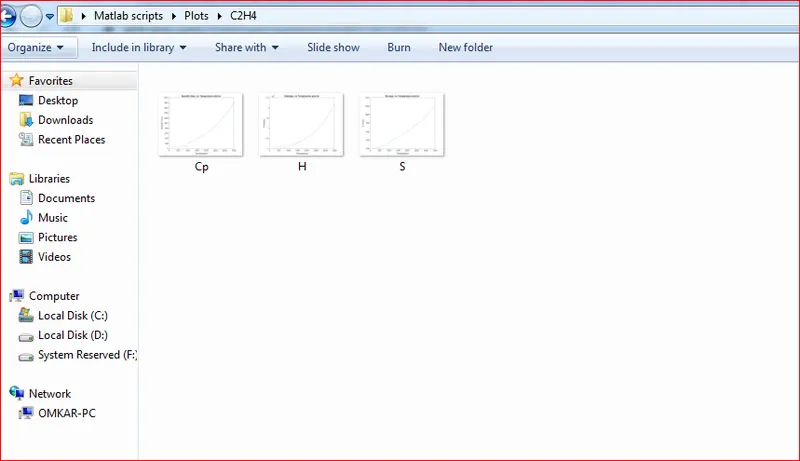
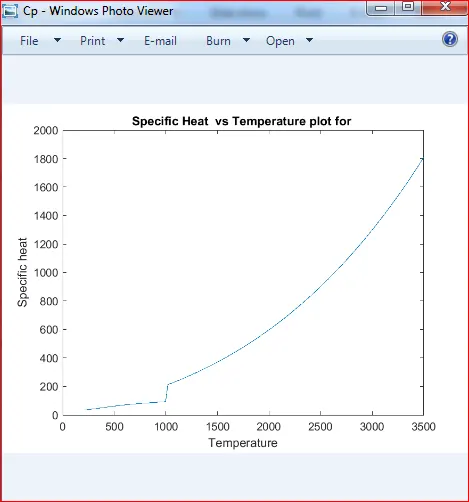
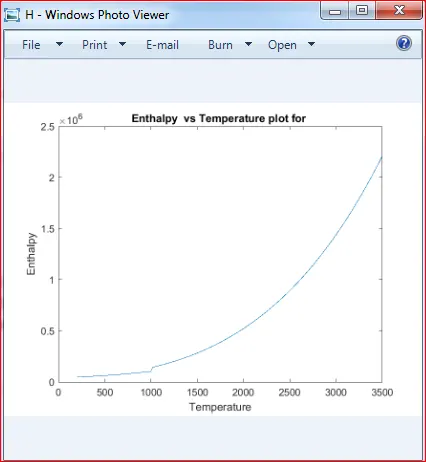
Link for video to view folder of 53 species with all their plots: https://www.youtube.com/watch?v=cMU2NS6h-h4
REFERENCE:
- https://www.youtube.com/watch?v=V8kmahQ-kd4
- https://www.youtube.com/watch?v=g7juXCBCgHM
- https://www.youtube.com/watch?v=glDaeLS3MRc
- https://www.youtube.com/watch?v=swYR-CW_m1U&list=PLAVOtsk206Zjv_1zuSHigtwGnAUT_t10S&index=6
- https://www.youtube.com/watch?v=rEarTHsM5dY&list=PLAVOtsk206ZioM3aIS1sHGP_Y6HTBJjJf&index=2
- https://www.youtube.com/watch?v=aU7ua641z0E&list=PLAVOtsk206Zi2Z1pGzoys2vFi_ReJdE_V
- https://www.youtube.com/watch?v=mb8LwYAil4o&list=PLAVOtsk206Zi2Z1pGzoys2vFi_ReJdE_V&index=2
CONCLUSION:
- Thus all the objectives are achieved successfully .
- Similar approach and logic can be used to extract data from any data file provided and required calculations can be done
3. Using above approach any data file can also be read and edited accordingly.