Parsing NASA thermodynamic data
AIM - To write a Matlab program for parsing the NASA thermodynamic data file
OBJECTIVES-
- Develop a Matlab code which able to extract the 14 temperature coefficients for each element in the NASA thermodynamic data and further calculate entropy, enthalpy and specific heat for each element
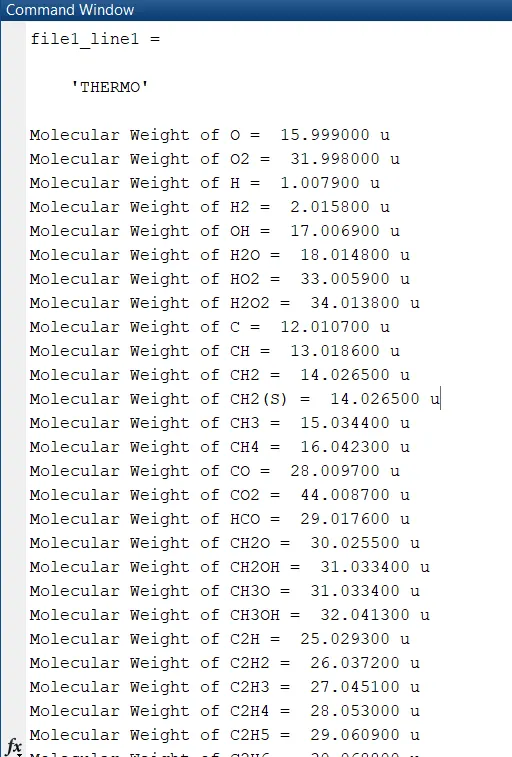
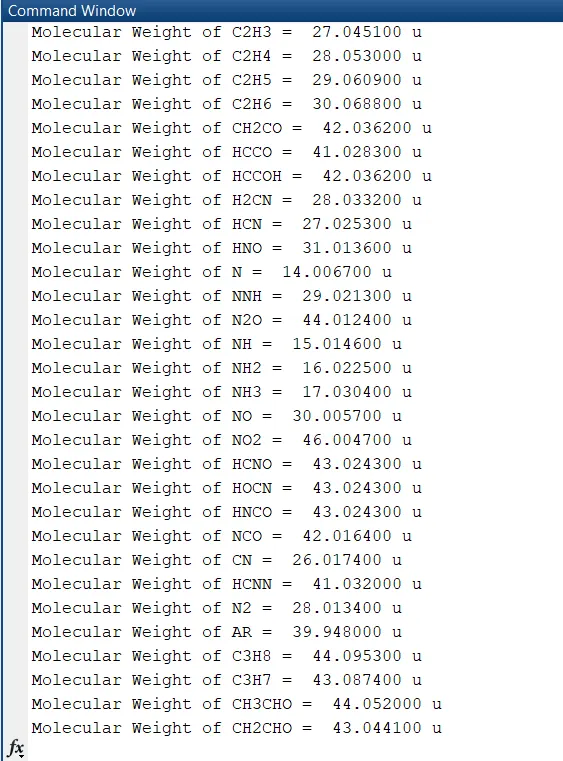
- Calculate the molecular weight of each species and display it in the command window.
- Plot the specific heat, Enthalpy and Entropy for the local temperature range.
- Save the plots as images and create a separate folder for each species and save them in that folder.
THEORY-
parsing- In general parsing is a part of syntax analysis where strings are analysed to be according to particular grammar. In computer science, it is nothing but syntax analysis of the input code into its component parts in order to facilitate the writing of compilers and interpreters.
In this project, Nasa thermodynamic data file is taken it has sample data of 53 element spices and 14 temperature coefficients for each element spices and file also contain global temperature range (low, mid and high) and local temperature range for each element spices (low, mid and high).
From the file, we need to parse the file and then extract all 14 coefficients which are needed to calculate the specific heat, entropy and enthalpy.
Specific Heat(Cp) -the amount of heat energy required to produce a unit change(1 degree) in its temperature for a 1 kg body.
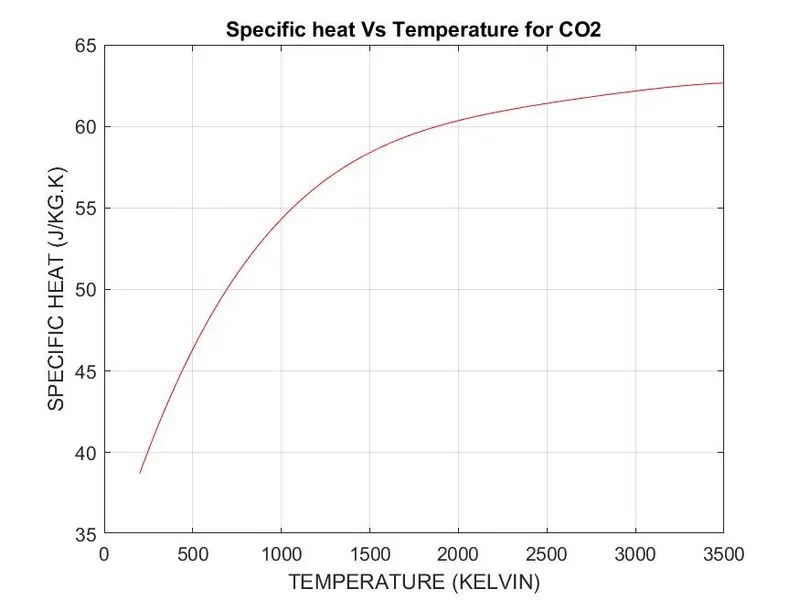
Cp = (a1 + a2*T + a3*T^2 + a4*T^3 + a5*T^4)*R
Enthalpy(H)- it is internal energy plus pressure time the volume. (H = E(internal energy) + P(pressure)* V(volume))
H = (a1 + a2*T/2 + a3*T^2/3 + a4*T^3/4 + a5*T^4/5 + a6/T)*R*T
Entropy (S) = the measure of a system's thermal energy per unit temperature that is unavailable for doing useful work.
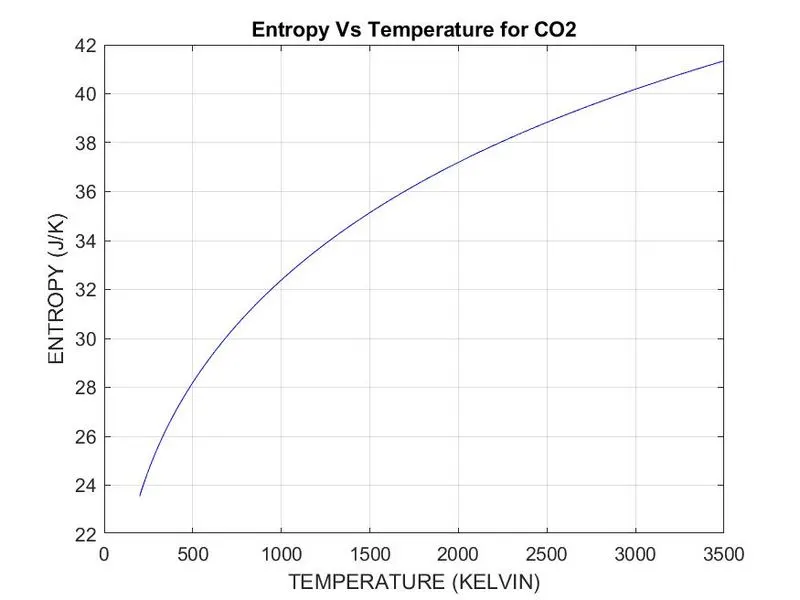
S = (a1*ln(T) + a2*T + a3*T^2 + a4*T^3 + a5*T^4 + a7)*R
where,
a1,a2,a3,a4,a5 are temperature coefficeints
T is temperature
R = universal gass constant = 8.314
CODE-
clear all
close all
clc
%opening data file in read mode
file1 = fopen('THERMO.dat','r');

%getting 1st line of the data
file1_line1 = fgetl(file1)

%getting next line information(it contains global temperature range)
global_temp_range_line =fgetl(file1);

%skipping next three lines which has only comments
 fgetl(file1);
 fgetl(file1);
 fgetl(file1);
%to read all 53 elements one by one implementing for loop
for i=1:53
 %reading the 1st line of 4 lines for each element
 element_line1=fgetl(file1);
 %splitting line with space,at end local temp ranges are given
 element_info_line1 = strsplit(element_line1,' ');
 %assinging the element name after splitting line
 element_name=(element_info_line1{1});
 %knowing the no of individual info in line1 of that element
 l=length(element_info_line1);
 %local low,mid, high temp ranges of elements present at end reading them
 local_low_temp = str2double(element_info_line1{l-3});
 local_mid_temp = str2double(element_info_line1{l-1});
 local_high_temp = str2double(element_info_line1{l-2});

 %according to local_mid_temp coefficients are classfied into high and low
 %if below local_mid_temp they are low and above mid_temp they are high
 %getting coefficients info from all 3 lines
 line_1=fgetl(file1);
 line_2=fgetl(file1);
 line_3=fgetl(file1);

 %now here there is no space to differentiate the individiual temp coff
 %so,using letter E which is in each coeff so finding E
 coeff_line1=strfind(line_1,'E');
 coeff_line2=strfind(line_2,'E');
 coeff_line3=strfind(line_1,'E');

 %now using E and obtaining each coefficient

 %getting high temp coeffecients (a1-a7)
 a1=str2double(line_1(1:coeff_line1(1)+3));
 a2=str2double(line_1(coeff_line1(1)+4:coeff_line1(2)+3));
 a3=str2double(line_1(coeff_line1(2)+4:coeff_line1(3)+3));
 a4=str2double(line_1(coeff_line1(3)+4:coeff_line1(4)+3));
 a5=str2double(line_1(coeff_line1(4)+4:coeff_line1(5)+3));
 a6=str2double(line_2(1:coeff_line2(1)+3));
 a7=str2double(line_2(coeff_line2(1)+4:coeff_line2(2)+3));

 %getting low temp coeffecients (a8-a14)
 a8=str2double(line_2(coeff_line2(2)+4:coeff_line2(3)+3));
 a9=str2double(line_2(coeff_line2(3)+4:coeff_line2(4)+3));
 a10=str2double(line_2(coeff_line2(4)+4:coeff_line2(5)+3));
 a11=str2double(line_3(1:coeff_line3(1)+3));
 a12=str2double(line_3(coeff_line3(1)+4:coeff_line3(2)+3));
 a13=str2double(line_3(coeff_line3(2)+4:coeff_line3(3)+3));
 a14=str2double(line_3(coeff_line3(3)+4:coeff_line3(4)+3));
 %defining 1000 evenly spaced temp points between low and high
 Temp=linspace( local_low_temp, local_high_temp,1000);
 R=8.314;

 % Calculation for Specific heat, Enthalpy and Entropy with local temp
for i = 1:length(Temp)
 if Temp(i) > local_mid_temp
     %calculating specific heat
     Cp = (a1 + a2.*Temp + a3.*Temp.^2 + a4.*Temp.^3 + a5.*Temp.^4)*R;
     %calculating enthalpy
     H = (a1 + (a2.*Temp)/2 + (a3.*Temp.^2)/3 + (a4.*Temp.^3)/4 + (a5.*Temp.^4)/5 + (a6./Temp))*R.*Temp;
     %calculating entropy
     S = a1.*log(Temp) + a2.*Temp + (a3.*Temp.^2)/2 + (a4.*Temp.^3)/3 + (a5.*Temp.^4)/4 + a7;
 else
     %calculating specific heat
     Cp = (a8 + a9.*Temp + a10.*Temp.^2 + a11.*Temp.^3 + a12*Temp.^4)*R;
     %calculating enthalpy
     H = (a8 + (a9.*Temp)/2 + (a10.*Temp.^2)/3 + (a11.*Temp.^3)/4 + (a12.*Temp.^4)/5 +(a13./Temp))*R.*Temp;
     %calculating entropy
     S = a8.*log(Temp) + a9.*Temp + (a10.*Temp.^2)/2 + (a11.*Temp.^3)/3 + (a12.*Temp.^4)/4 + a14;
 end
end
% Molecular weight calculation
elements = ['H','C','O','N','A']; % species elements
atomic_weight = [1.0079 12.0107 15.999 14.0067 39.948]; % atomic weight value for elements
M = 0; %initial molecular weight = '0'
for k = 1:length(element_name)
    for m = 1:length(elements)
     if strcmp(element_name(k), elements(m))
         M_w = M_w + atomic_weight(m);
         p = m;
     end
 end
 n = str2double(element_name(k));
 if n>1
     M_w = M_w + atomic_weight(p)*(n-1);
 end
end
 % Printing the molecular weights
 mol_weights = sprintf('Molecular Weight of %s =  %f u',element_name,M_w);
 disp(mol_weights)
 %creating folder
 mkdir(['C:UsersLenovo iP510DocumentsMATLABskill lyncnasafig',element_name]);
 %plotting the graphs for all element spices
 %figure1 for specific heat vs temp
 figure(1)
 plot(Temp,Cp,'color','r')
 title(sprintf('Specific heat Vs Temperature for %s',element_name))
 xlabel('TEMPERATURE (KELVIN)')
 ylabel('SPECIFIC HEAT (J/KG.K)')
 grid on
 %figure2 for enthalpy vs temp
 figure(2)
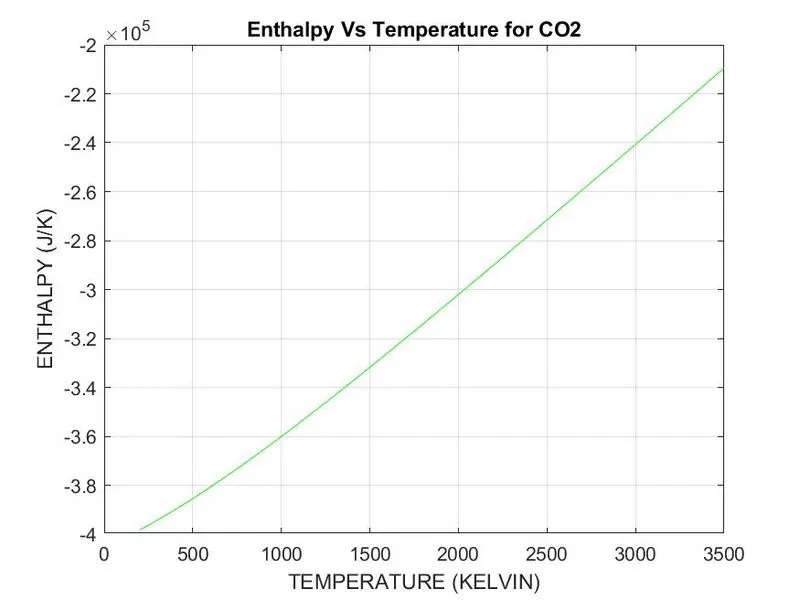
 plot(Temp,H,'color','g')
 title(sprintf('Enthalpy Vs Temperature for %s',element_name))
 xlabel('TEMPERATURE (KELVIN)')
 ylabel('ENTHALPY (J/K)')
 grid on
 %figure3 for entropy vs temp
 figure(3)
 plot(Temp,S,'color','b')
 title(sprintf('Entropy Vs Temperature for %s',element_name))
 xlabel('TEMPERATURE (KELVIN)')
 ylabel('ENTROPY (J/K)')
 grid on

 %changing the directory and saving
 cd((['C:UsersLenovo iP510DocumentsMATLABskill lyncnasafig',element_name]));
 saveas(1,'specific heat','jpeg');
 saveas(2,'enthalpy','jpeg');
 saveas(3,'entropy','jpeg');


end
fclose(file1)
CODE EXPLANATION AND PROCEDURE -
- Firstly the file THERMO.dat is open by using fopen command in reading mode and it is assigned to file1. when we see thermodynamic data the first few has header information. So, the first line is read by fgetl command which used to read from the line in a file and line 2 has a global temperature range(300,1000,5000) and the next 3 lines are skipped by writing fgetl 3 times
- Now we are at elements spices, So there are 53 elements so now writing a code for calculating all metrics inside for loop and it is run for 53 times since there are 53 elements
- line 1 of element spices contain the element name at starting and at the end, it contains the local temperature range. So, first, fgetl is used to read the line and for splitting the line using strsplit where the line is split using space between words, to obtain the last 3 values in line local low, high and mid temperatures the length of the line is known and further those are obtained by subtracting length from their position number from the right and the data is a number but stored as a string so it is converted from string to double using str2double further lines has temperature coefficients information so here each line has 5 coefficients to obtain each coefficient here there is no space between them to use strsplit command so a new command strfind is used where there is a letter E in the numbers so by finding the location of letter E we obtain the individual coefficients (a1 to a14) where according to local temperature range coefficients (a1 to a7) are grouped as low temp coefficients and coefficients (a8 to a14) are grouped as high-temperature coefficients.
- 1000 evenly spaces temperature points are defined between local low and local high temperatures using linspace command
- now for every temperature point the specific heat, entropy and enthalpy are calculated using the formulas and further the molecular weights where the elements like H,C,N,A,O are given as an array and their atomic weights as another array and a for loop is created for elements spices and for elements and strmp command used to compare elements with elements spices if both match molecular weight is calculated and not match then the position of the element in elements spices is considered to calculate the molecular weight and displayed in the command window.
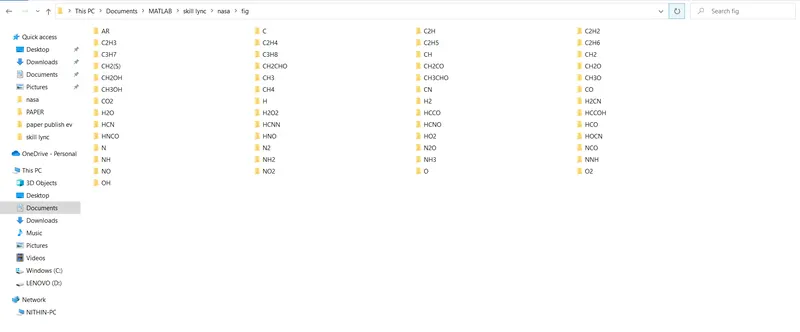
- now a folder named fig is created and in that folder subfolders according to elements spices, names are created.
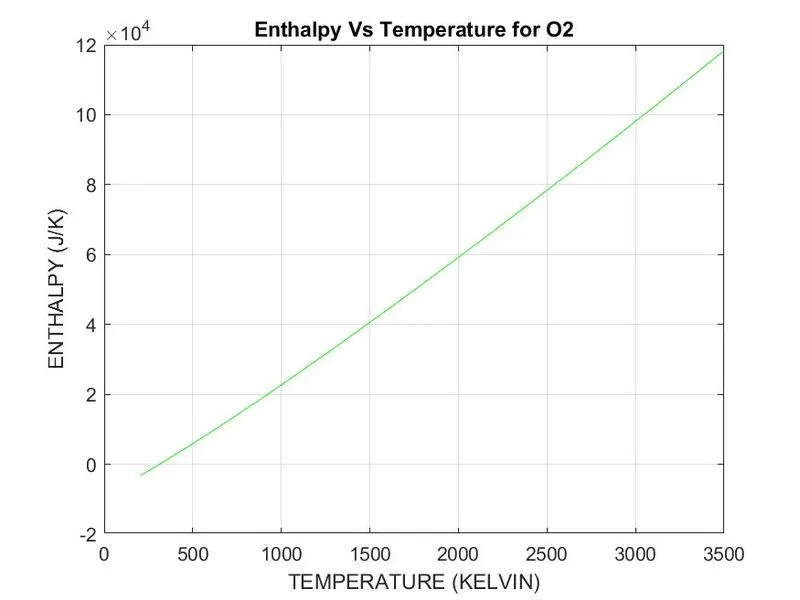
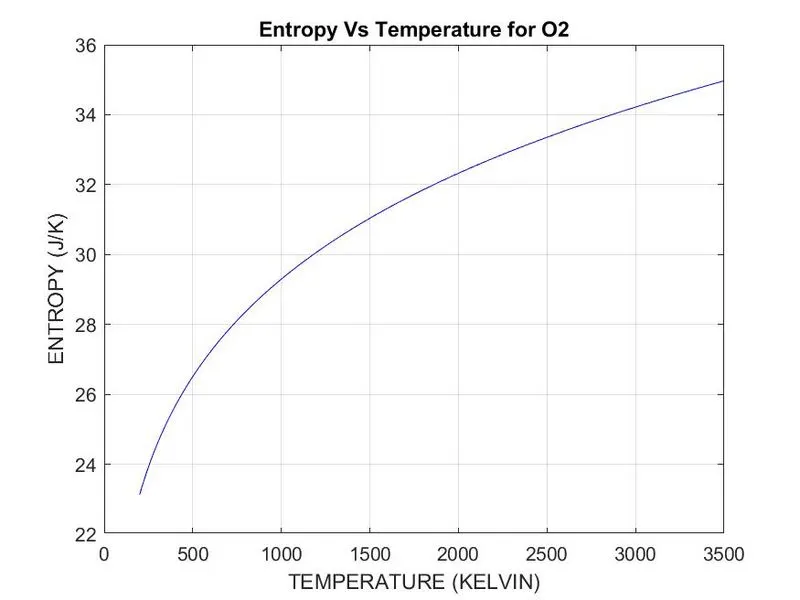
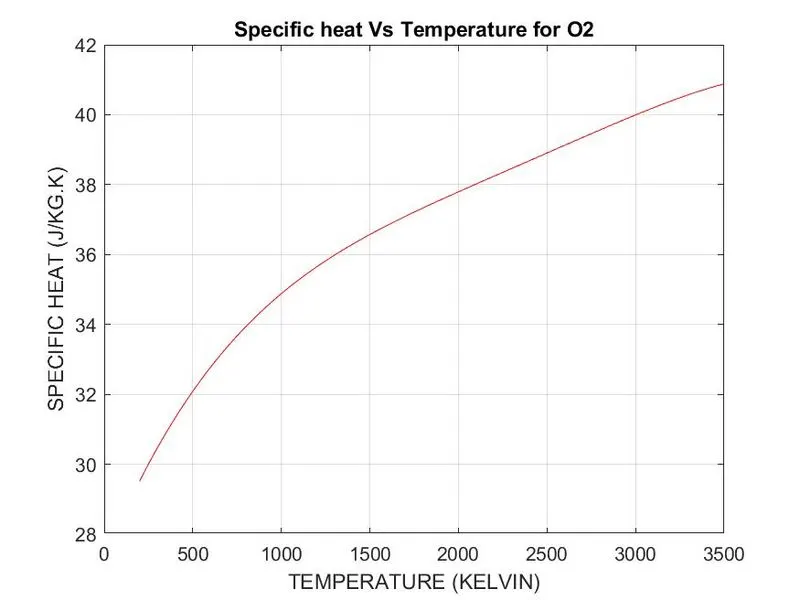
- figure 1 is a plot between specific heat vs temperature and figure 2 is a plot between enthalpy vs temperature and figure 3 is a plot between entropy vs temperature
- now the directory file is changed using CD(change directory) and each figure is saved in jpeg format using saveas
OUTPUT-
file folder
Plots for o2
plots for N2
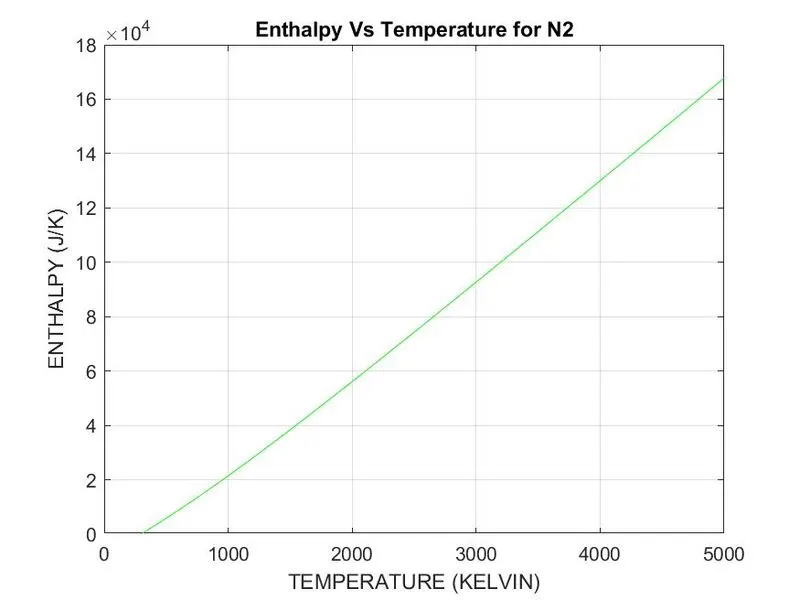
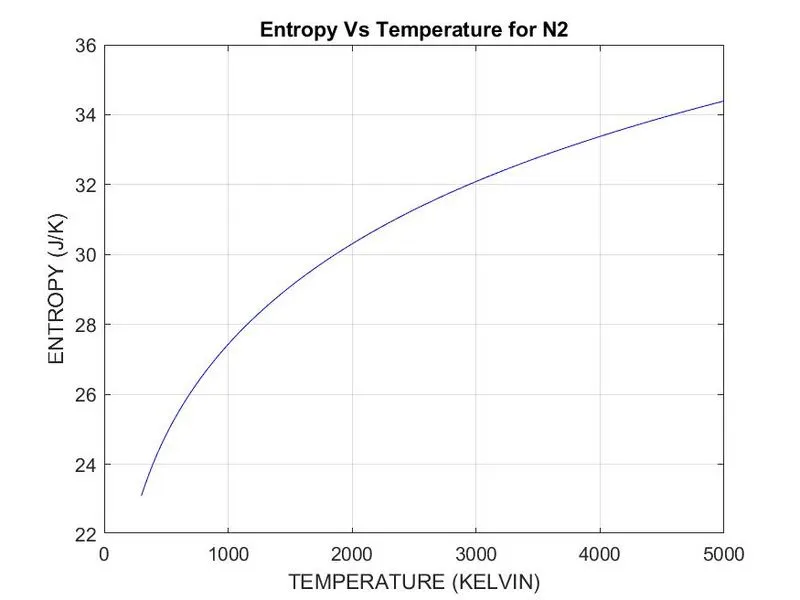
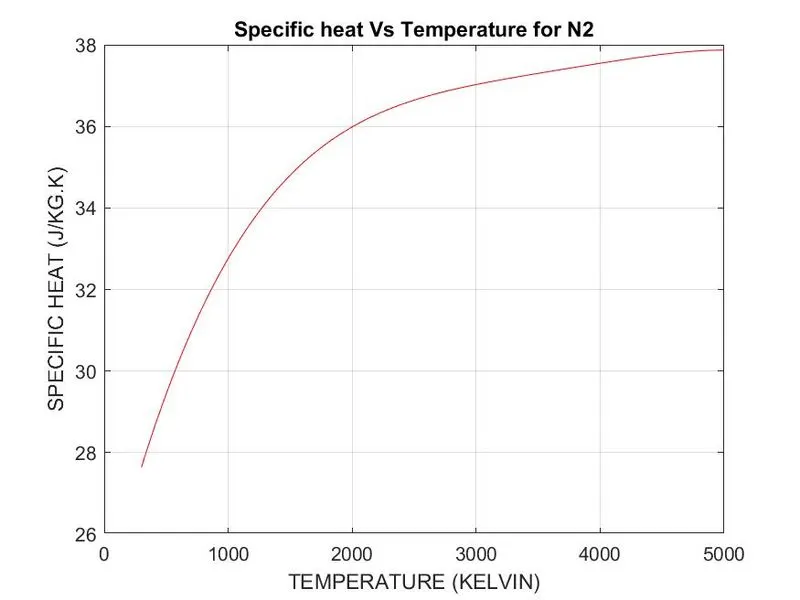
plots for Co2
Matlab command window displaying molecular weights
errors faced while programming

here folder path is not given correctly this was rectified further by knowing the syntax of mkdir and cd in the Matlab help section
references
https://www.grc.nasa.gov/www/k-12/airplane/enthalpy.html
https://www.grc.nasa.gov/www/k-12/airplane/entropy.html
https://www.britannica.com/science/specific-heat
https://in.mathworks.com/help/matlab/ref/mkdir.html?searchHighlight=mkdir&s_tid=srchtitle_mkdir_1
https://in.mathworks.com/help/matlab/ref/cd.html?searchHighlight=cd&s_tid=srchtitle_cd_1
https://in.mathworks.com/help/matlab/ref/fgetl.html?searchHighlight=fgetl&s_tid=srchtitle_fgetl_1
https://in.mathworks.com/help/matlab/ref/strfind.html?s_tid=doc_ta