Modelling of Battery Pack
AIM: Modelling of Battery Pack.
OBJECTIVE:
a.Configure the batteries as per a Lithium-ion battery datasheet.
b.Explain your parameters.
c.Simulate the model and comment on the results for SOC, voltage, current in detail.
d.Change the configuration to 4S3P and simulate the model.
e.Compare the results for both models and give your explanation for the results.
OBJECTIVE 1 - Configure the batteries as per a Lithium-ion battery datasheet
Battery Configuration
The lithium-ion datasheet used for this project is given below.
https://drive.google.com/file/d/1dzaIY7UpP-7ViRNp7J23MyI0crZFWcPz/view?usp=sharing
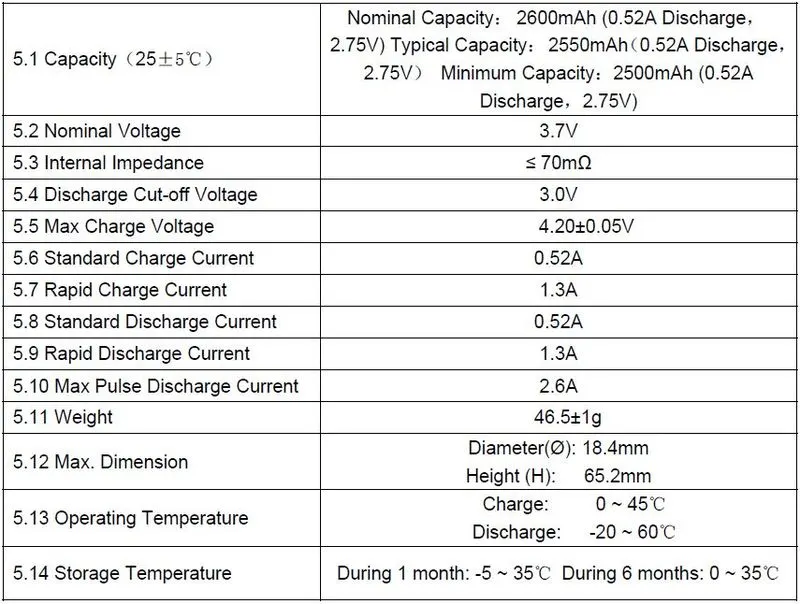
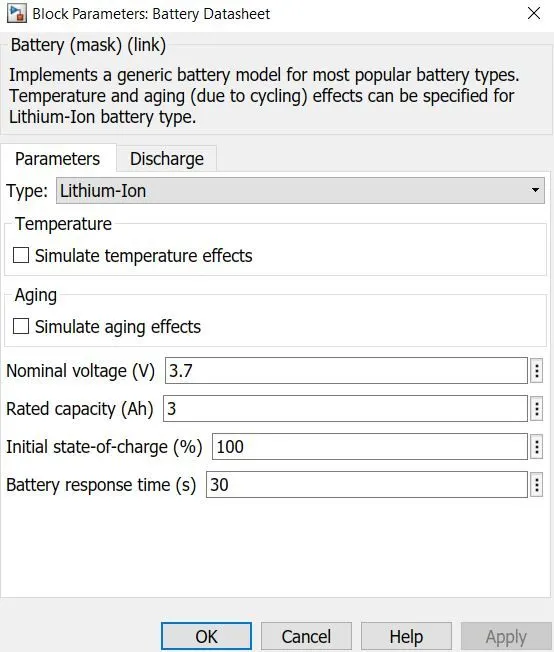
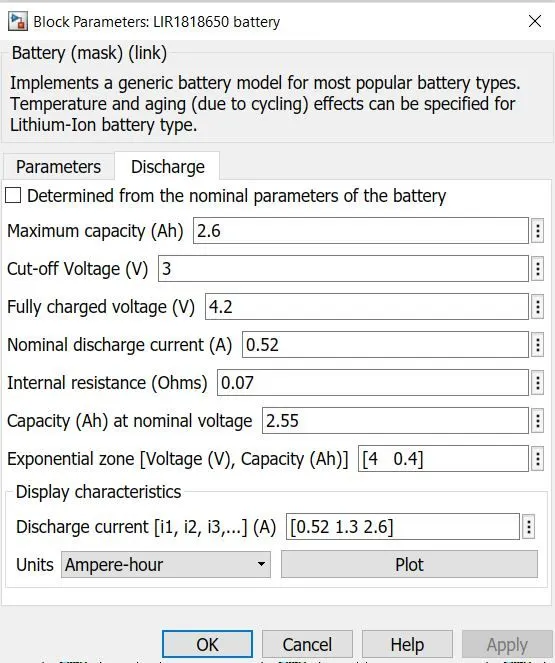
All the batteries are configured as per the datasheet and those batteries are then later arranged in the required combination.
OBJECTIVE 2 - Explain your parameters.
The Nominal voltage of the battery is kept as 3.7v. The start of the battery is with the 100% SOC rate for all batteries in the pack.
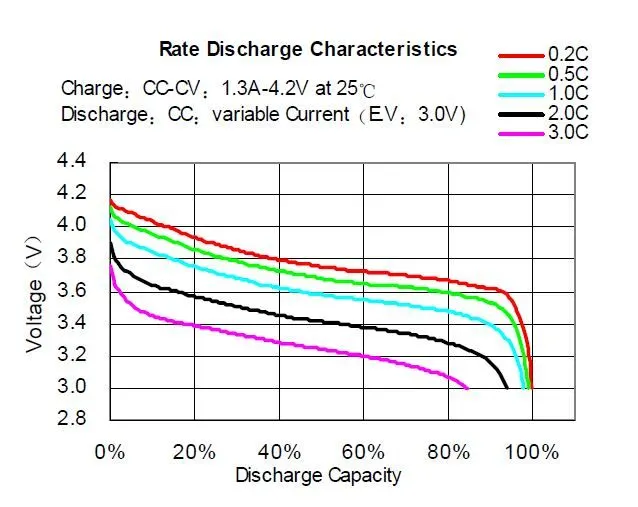
- This is the discharge profile for the battery according to the voltage is given in the datasheet.
- This is how the rated discharge of the battery is plotted in the datasheet that we consider for our model.
- The following are the discharge curves that are plotted from the inputs data above.
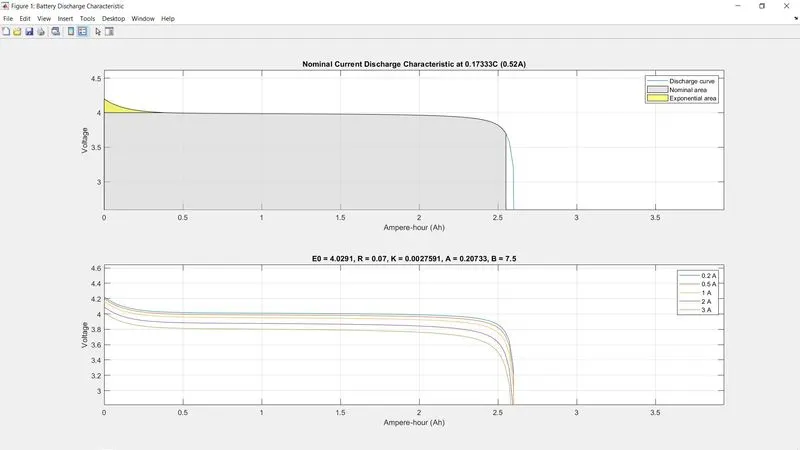
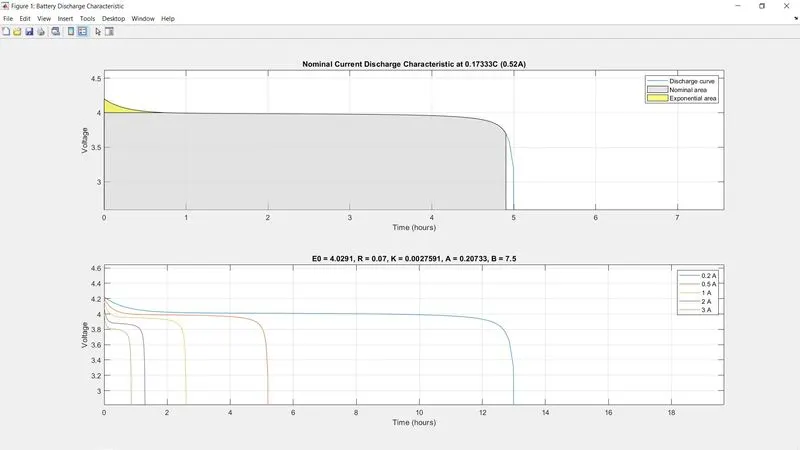
- From the discharge curves, the nominal and exponential areas are clearly distinguishable. The maximum capacity of this battery is 2.6Ah, while the standard discharge current rate is 0.52A, which makes it a standard discharge of 0.2C rate, capable of running for 5 hours at 0.52A.
- However, due to Peukert's law, this is not possible in reality due to the internal resistance and heat generated by the battery when it has to supply a higher current. If the battery were discharged at a 1C rate i.e. 2.6A, then it should certainly run for less than 1 hour due to reduced capacity.
- According to the discharge curves in the datasheet, it is shown that when the battery is discharged at 7.8A or 3C, then the capacity reduces to about 85% i.e. from 2.6Ah to ≈">≈≈2.2Ah. In addition, due to Peukert's law, the battery should not be able to run for 20 minutes at 7.8A. However, the curves plotted above depict that the capacity has only reduced from 2.6Ah to ≈">≈≈2.53Ah and it will also run for 20 minutes at 7.8A - both of which should not be the case.
- Hence, this implies that this built-in battery model in MATLAB/SIMULINK does not account for Peukert's law and that the internal resistance of the battery does not vary with the amplitude of the current.
OBJECTIVE 3 - Simulate the model and comment on the results for SOC, voltage, current in detail.
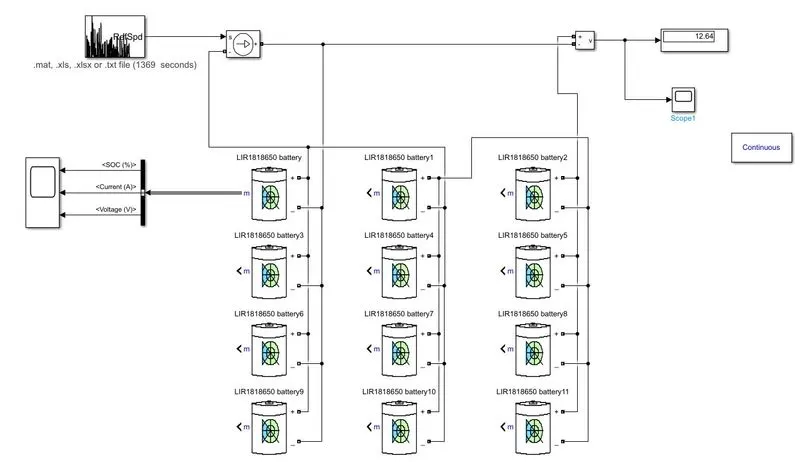
- 3S4p refers to 3 series and 4 parallel as it shows 3 cells are connected in series i.e +ve terminal connected to -ve terminal and 4 in parallel i.e +ve terminal connected to +'ve and -ve to -ve.
- The fully charged voltage of one cell is 4.2V, hence 3 cells connected in series would mean a total voltage of around 12.6V, which is evident from the voltage measurement
- The maximum capacity of each cell is 2.6Ah so 4 cells connected in parallel means a total capacity of 2.6*4 = 10.4Ah.
How to ensure the total pack capacity.
- The battery is configured to discharge a nominal current of 0.52A which means if the current is assumed to be 0.52A how long the battery will last.
- 10.4Ah/0.52A= 20 hrs, but this is not the actual case. In an actual drive cycle the discharge of the current is not constant. Higher current discharge brings in peukert effects and the capacity of the battery is reduced.
- So the UDDS cycle was run for a complete 20hrs to find out the SOC to become 0 of the battery pack. Approximately the battery pack lasted for about 17.4 hrs.
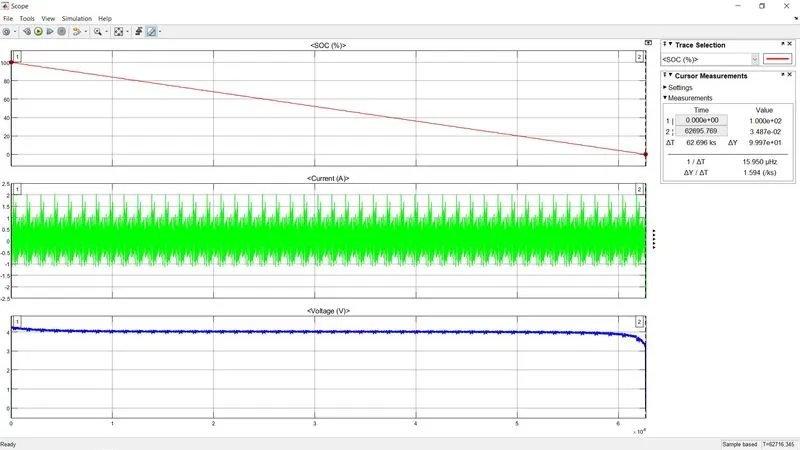
- Evidently, SOC depleted to 0% before 63000 seconds, which is about 17.5 hours. Hence, it can be concluded that this pack was indeed constructed in the correct way to provide a capacity of 10.4Ah
- There might be an easier way to confirm that the cells have been connected correctly to give the expected capacity, but as of now, I'm unaware of it.
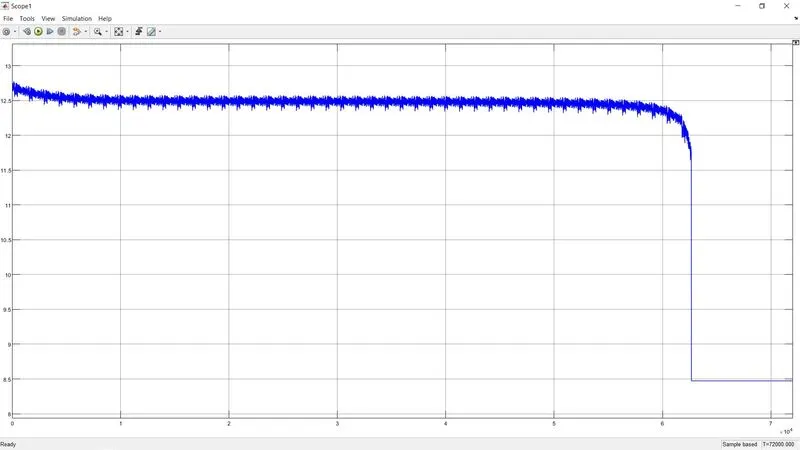
- While the battery completely depletes from 100 to 0%, the voltage levels have gone from 12.6V to about 8.5V
- Note how this voltage discharge curve matches exactly with a Li-ion discharge curve; starting off with an exponential zone, into the nominal linear zone, and then the steep zone, wherein the final 5% SOC the voltage has drastically reduced from 12.4V to 8.5V
OBJECTIVE 4 - Change the configuration to 4S3P and simulate the model.
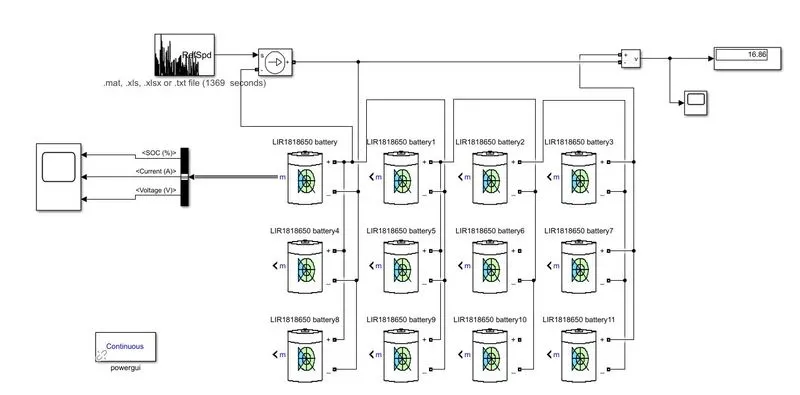
- As opposed to the first model, 4 cells are connected in series and 3 in parallel. Same total number of cells, but arranged differently, giving different voltages and capacities
- The fully charged voltage of one cell is 4.2V, hence 4 cells connected in series would mean a total voltage of around 16.8V, which is evident from the voltage measurement
- The maximum capacity of each cell is 2.6Ah so 3 cells connected in parallel means a total capacity of 2.6*3 = 7.8Ah
Error check:
- To make sure this modeled battery pack is providing a capacity of 7.8Ah, the same procedure was repeated, where this time the UDDS drive cycle was run for 7.8Ah/0.52A = 15 hours to see the change in SOC. The approximation for when SOC would deplete to 0% was around 13 hours.
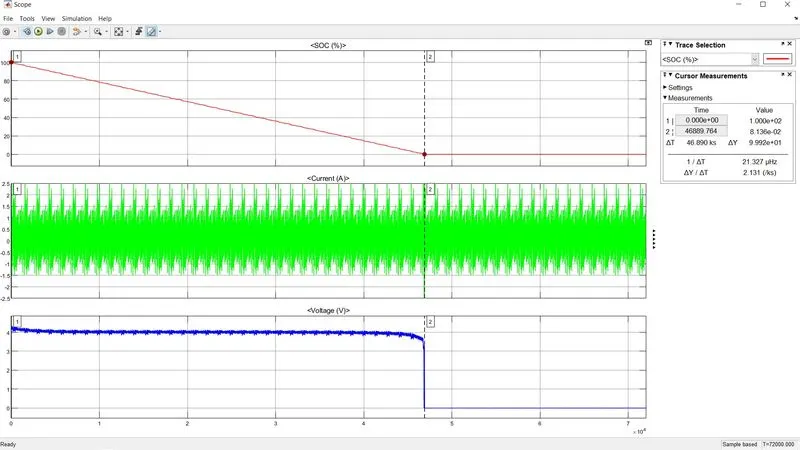
- Evidently, SOC depleted to 0% before 47000 seconds, which is about 13 hours. Hence, it can be concluded that this pack was indeed constructed in the correct way to provide a capacity of 7.8Ah.
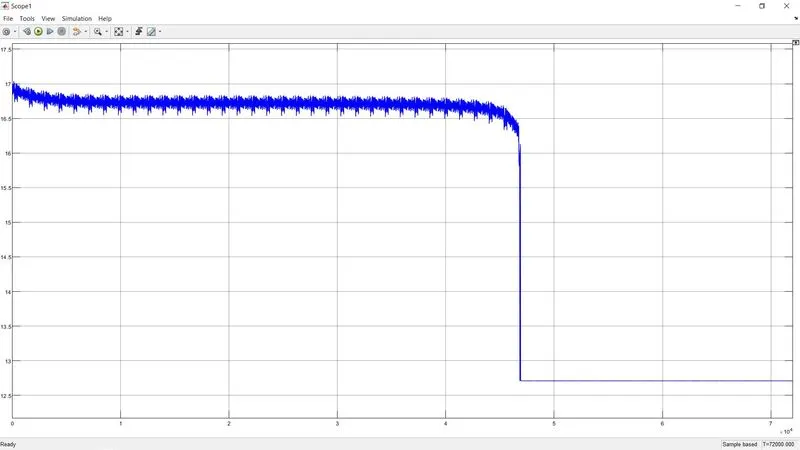
- While the battery completely depletes from 100 to 0%, the voltage levels have gone from 16.8V to about 12.7V
OBJECTIVE 5 - Compare the results for both models and give your explanation for the results.
The UDDS drive cycle was run for both the battery pack.
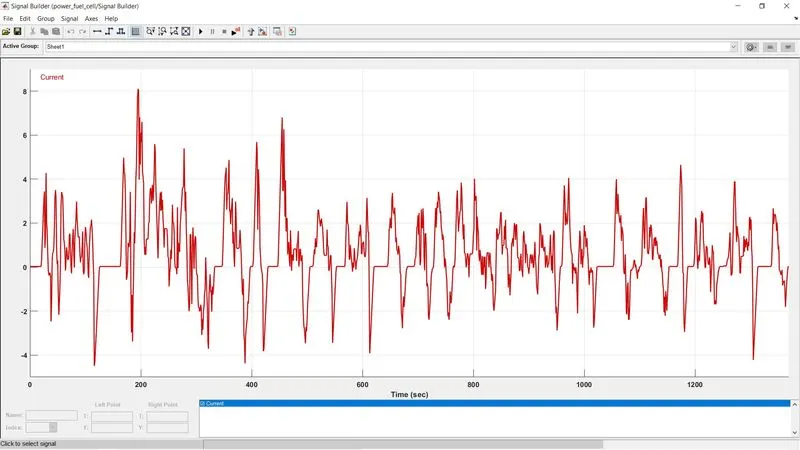
For 3S4P battery pack
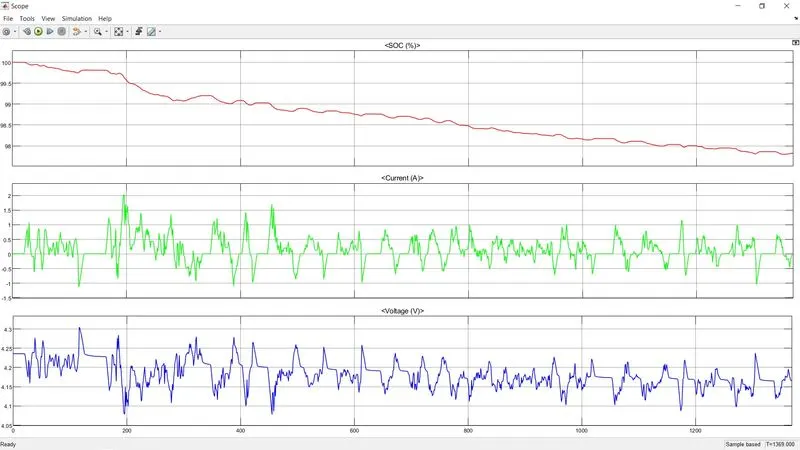
4S3P Battery pack
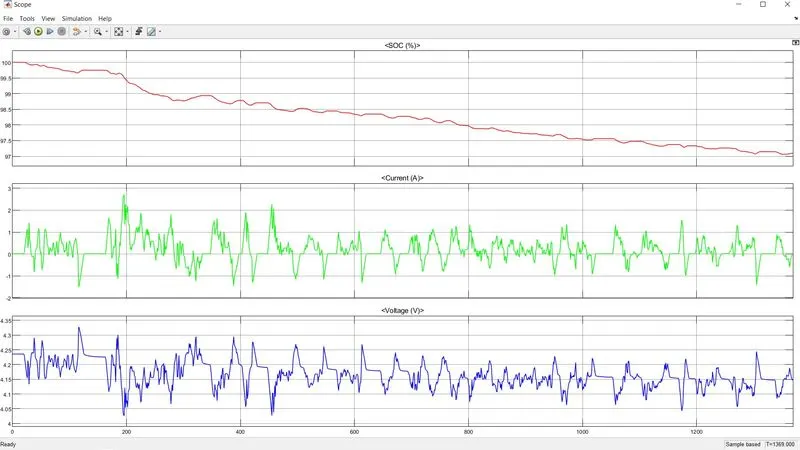
For SOC
3S4P -
- Decrease to 97.82%
- Has lower DOD because capacity is higher (10.4 Ah)
4S3P
- Decrease to 97.1%
- has higher DOD because capacity is ower (7.8Ah).
For Current
3S4P -
- Right before 200 sec the drive cycle demands a current of about 8A, but this configuration can discharge a peak current of 2A.
- The entire current follows the drive cycle, However, from the comparison, it is evident that the drive cycle requirements exceed what the battery pack can provide.
4S3P -
- This configuration at the same point can discharge a peak current of about 2.7A.
- The same thing is happening here except that the battery pack can discharge a little more current due to greater voltage hence current amplitude are higher than the 3S4P.
For Voltage
3S4P -
- Lower voltage due to only 3 cells connected in series.
- Every time there is an increase in current demand, the voltage decrease as the pack needs to discharge a higher current. Every time the current goes negative i.e. during steep deceleration of the vehicle, it means the battery is being charged and that increases the voltage. Hence the graph of current and voltage are totally opposite of each other at all points.
4S3P -
- Higher voltage due to 4 cells connected in series.
- The same voltage theory applies as started in 3S4P.
CONCLUSION-
Here we have modeled 2 different battery packs for the same battery configuration and the same drive cycle. The two different configurations are compared with each other.