Modelling and simulation of flow through a flowbench
Engine valve analysis
Aim :
To create a 3D model of a flow bench and run the flow analysis by using the flow simulation in the solidworks software.
Objective :
- Create the 3D model of the engine valve system.
- To obtain which is the good grid mesh level.
- To find the velocity, pressure and mash flow rate for valve lift value.
- To run the parametric study for various valve lift.
Introduction :
An airflow bench is a device used for testing the internal areodynamic qualities of an engine component and is related to the more familiar wind tunnel. It is used primarily for testing the intake and exhaust ports of cylinder heads of internal combustion engines. It is also used to test the flow capabilities of any component such as air filters, carburetors, manifolds, or any other part that is required to flow gas. A flow bench is one of the primary tools of high-performance engine builders, and porting cylinder heads would be strictly hit or miss without it.
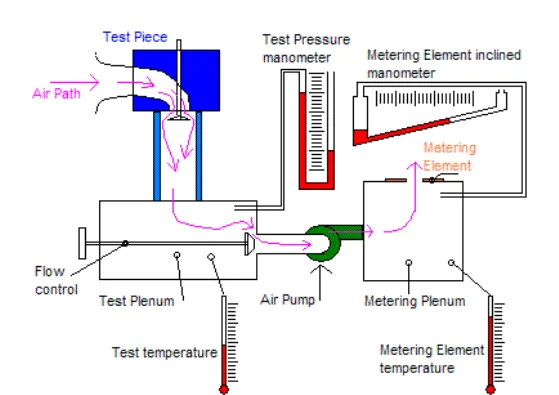
A flow bench consists of an pump of some sort, a metering element, pressure and temperature measuring instruments such as manometers, and various controls. The test piece is attached in series with the pump and measuring element and air is pumped through the whole system. Therefore, all the air passing through the metering element also passes through the test piece is the same, it is also known. The mass flow rate can be calculated using the known pressure and temperature data to calculate air densities and multiplying by the volume flow rate.
Airflow conditions must be measured at two locations, across the test piece, and across the metering element. The pressure difference across the test piece allows the standardization of tests from through the whole system. The pressure across the metering element allows calculation of the actual flow through the whole system. The pressure across the test piece is typically measured with a U tube manometer while, for increased sensitivity and accuracy, the pressure difference across the metering element is measured with an inclined manometer. One end of each manometer is connected to its respective plenum chamber while the other is open to the atmosphere.
Procedure :
Geometry Modelling :
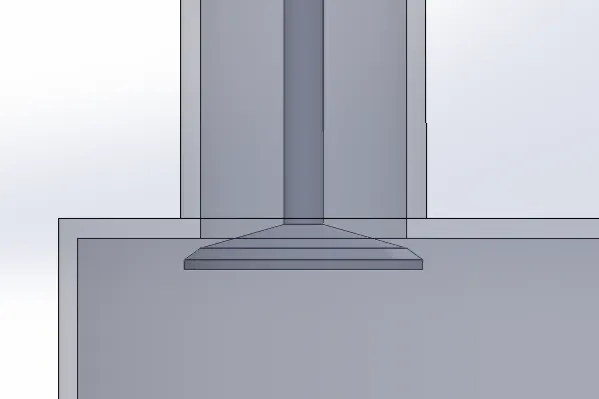
At first 3D model of the flow bench is made. It comprises of making a cylinder, an inlet channel, a valve. For making a cylinder, a circle was drawn and extruded to get a desired cylindrical shape. For making inlet channel, in the front plane of the cylinder, lines were drawn for a path to be swept. After that, a reference plane was inserted by selecting the lines and its initial point to make the required plane. In this plane a circle was drawn and it was sweep tool is used along the lines to make an inlet channel.
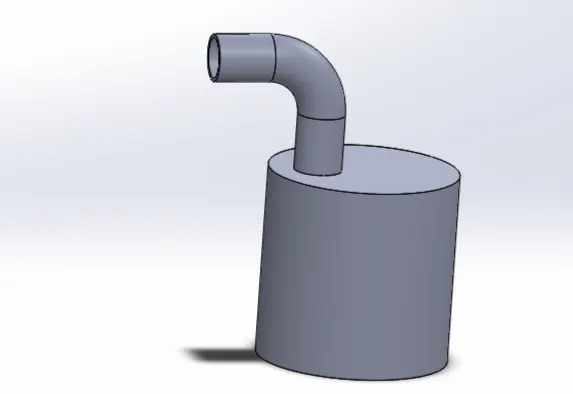
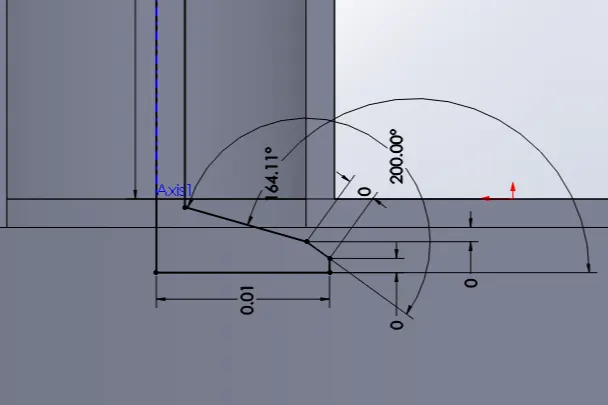
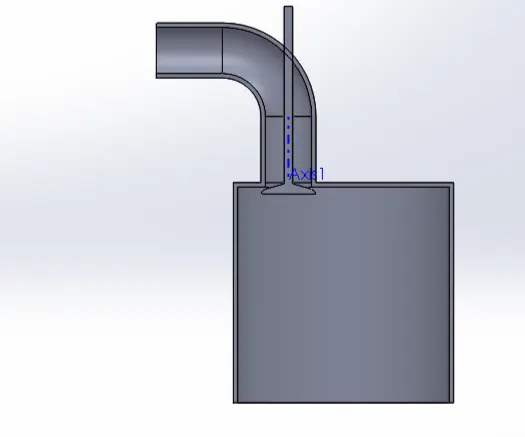
Using the shell tool, holes were provided at the two regions ,inlet and outlet of flow bench. For making a valve, a reference plane is inserted using an axis parallel to inlet channel and right plane. An approximate geometry of valve was made and was revolved around its axis. It has to be taken care that all the geometries are properly constrained and was saved.
Flow Simulation setup :
After sketching flow simulation was setup and lids were given at two openings and following parameter were given as inputs.
Analysis type : Internal
Type of fluid : Air
Type of flow : Laminar and Turbulant
Wall conditions : Adiabatic with 0 micrometer roughness
Initial conditions : Pressure (101325 Pa) , Temp (293.2 K)
Boundary conditions were given to the surface of inlet and outlet regions with Total pressure of 202650 Pa and the Static pressure of 50662.5 Pa
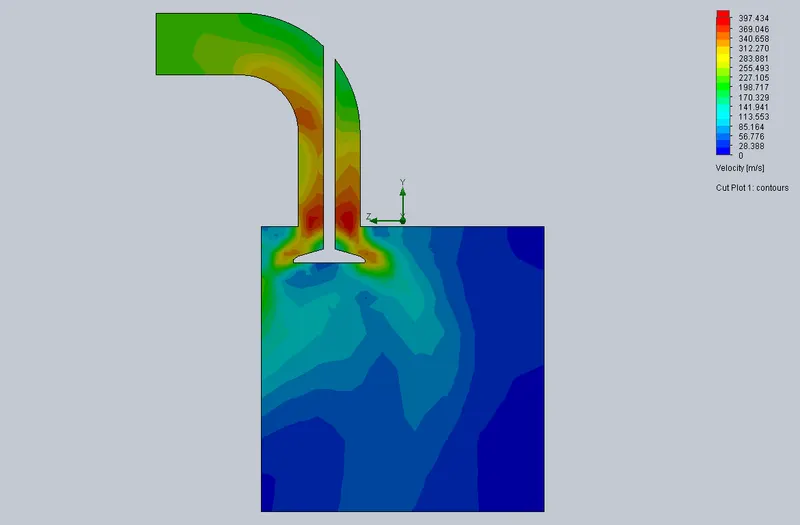
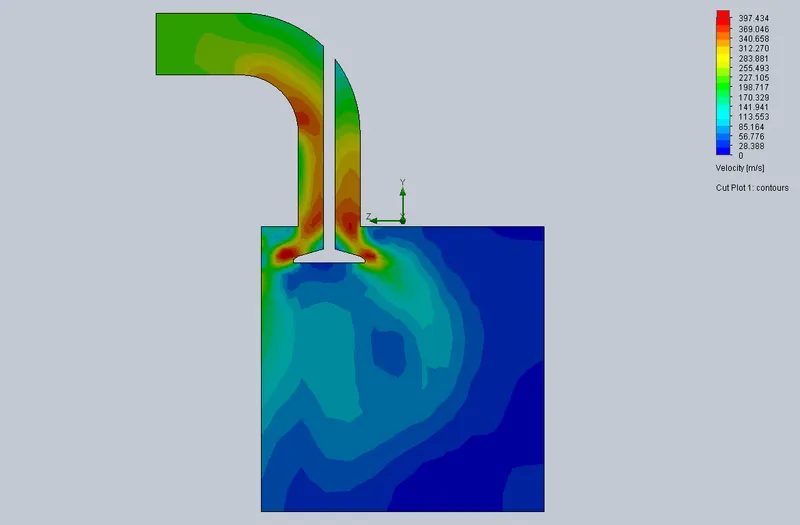
As per the first objective different grid sizes from 3 to 6 were given at a particular valve lift to simulate and deciding which will be best for rest of simulation and was run to get cut plots for velocity.
Case 1 (For grid mesh size - 3)
Velocity cut plot :
Case 1 (For grid mesh size - 4)
Velocity cut plot :
Case 1 (For grid mesh size - 5)
Velocity cut plot :
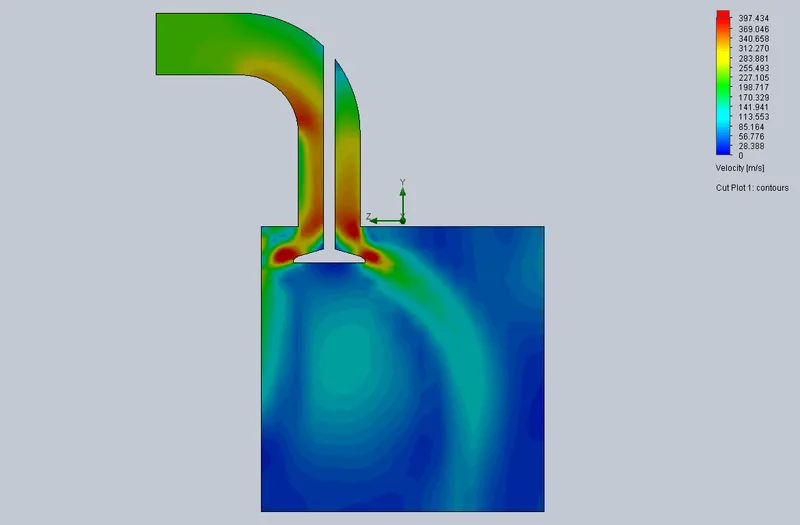
After these simulations it was decided to go for most fine mesh quality, and mesh size 6 will be used for parametric studies. In addition to that a local mesh surrounding valve faces were also selected to get many accurate results as smaller the mesh size, more accurate is the result but on the other hand processing time will increase.
For Parametric study :
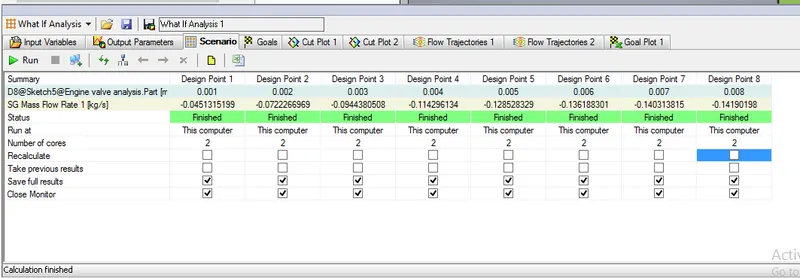
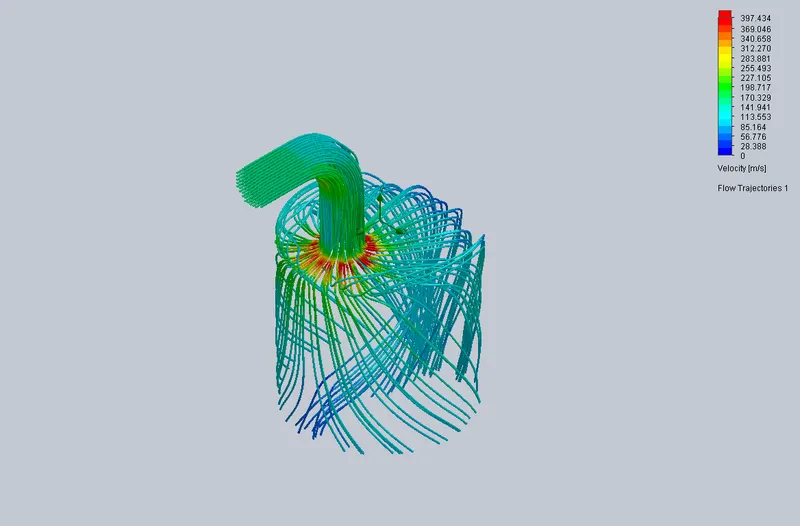
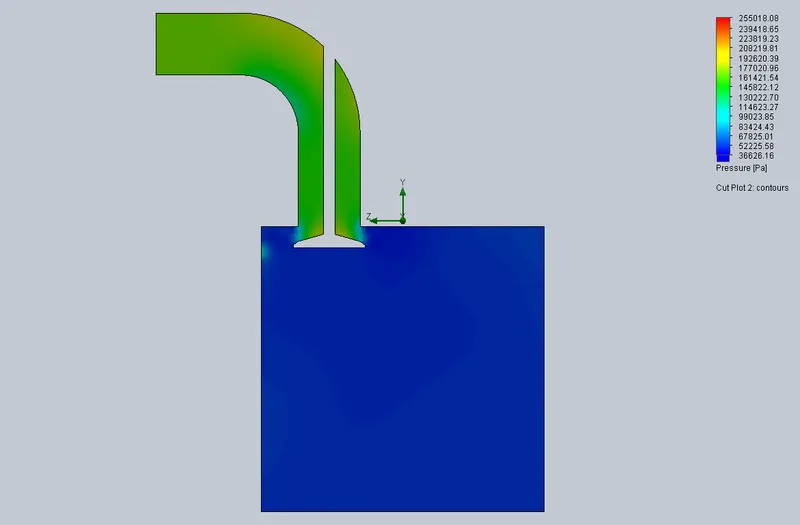
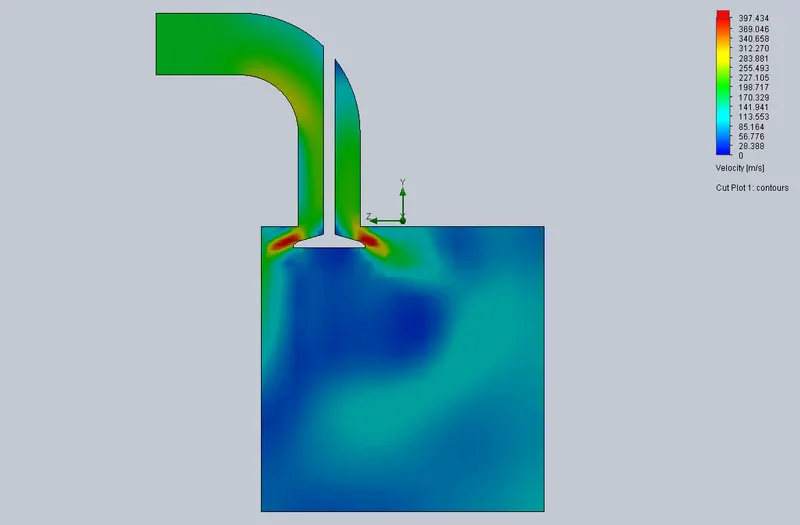
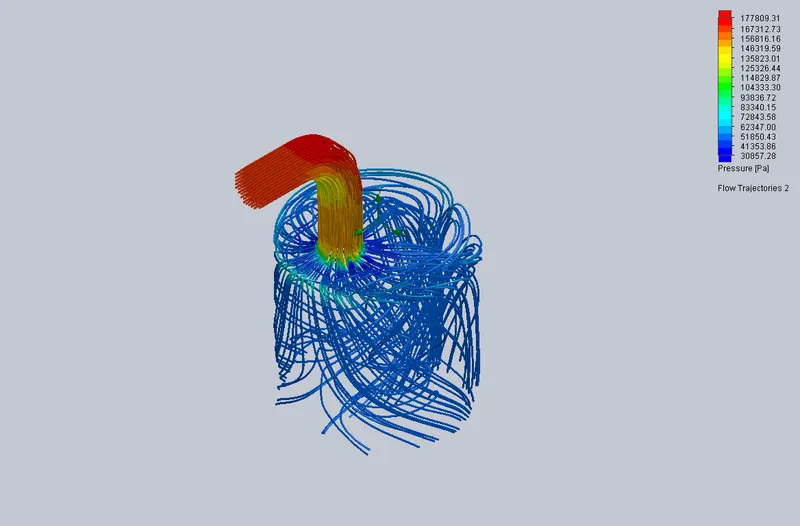
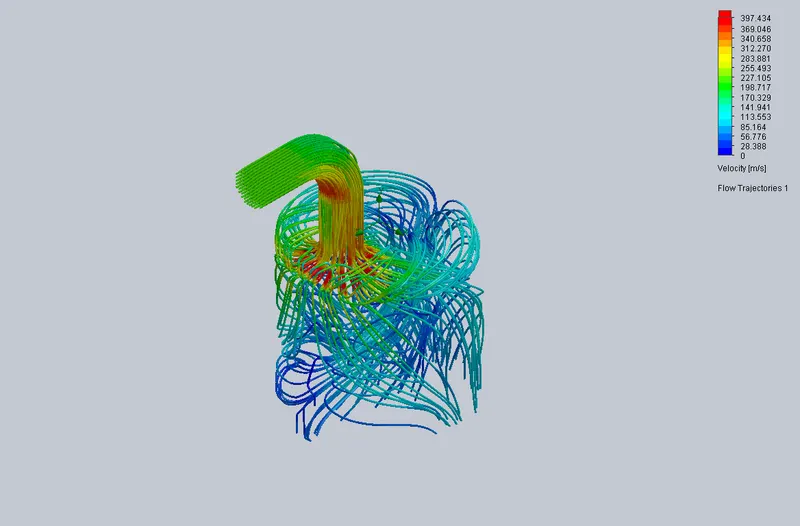
After choosing correct mesh size, a parametric study was setup and for input conditions the distance between valve and cylinder head were given in the range of 1mm to 8mm with steps in between them. For output, all cutplots, flow trajectries, surface goal of mass flow rate from outlet were given and were made to run.
Results :
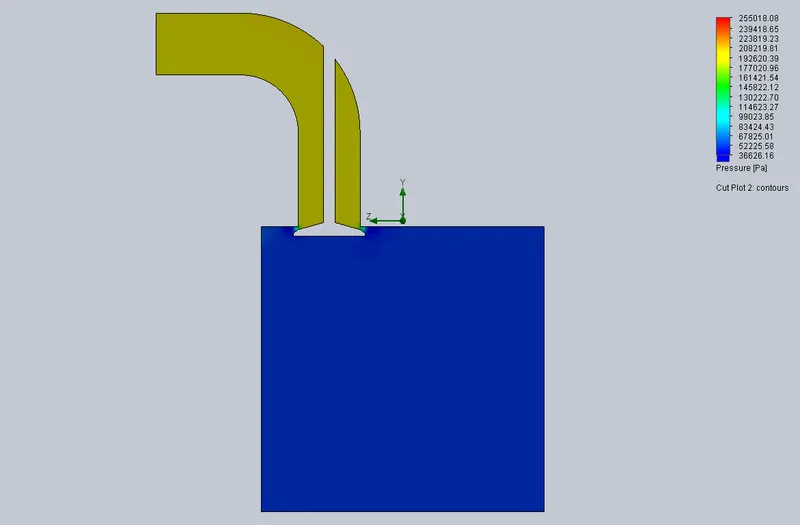
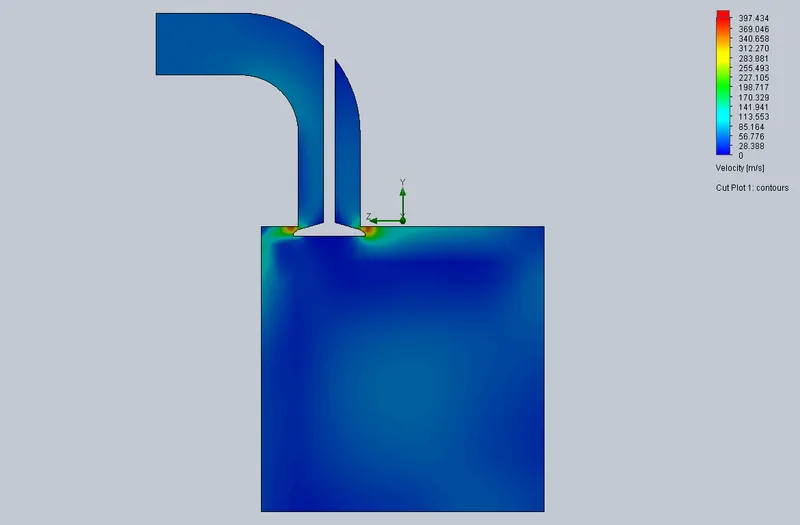
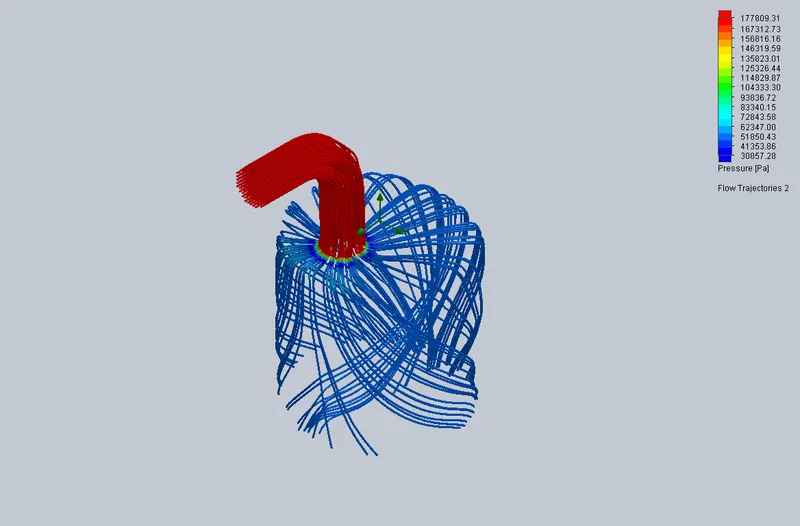
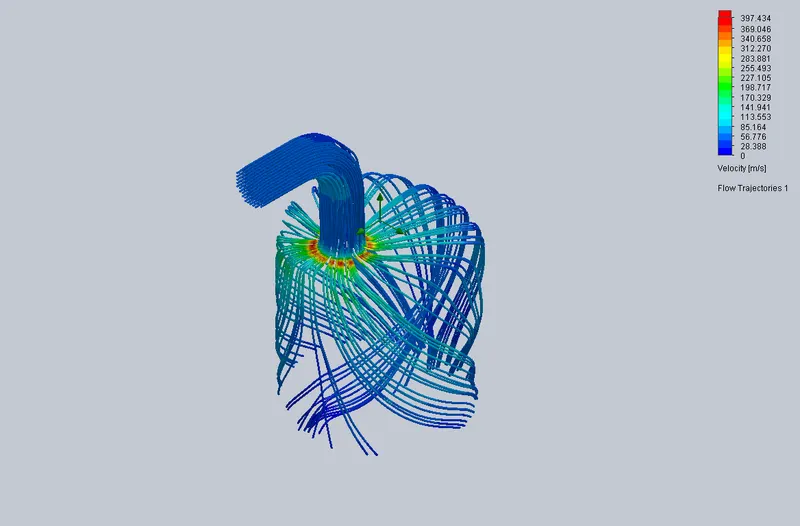
Case 1 : (For valve lift 1 mm)
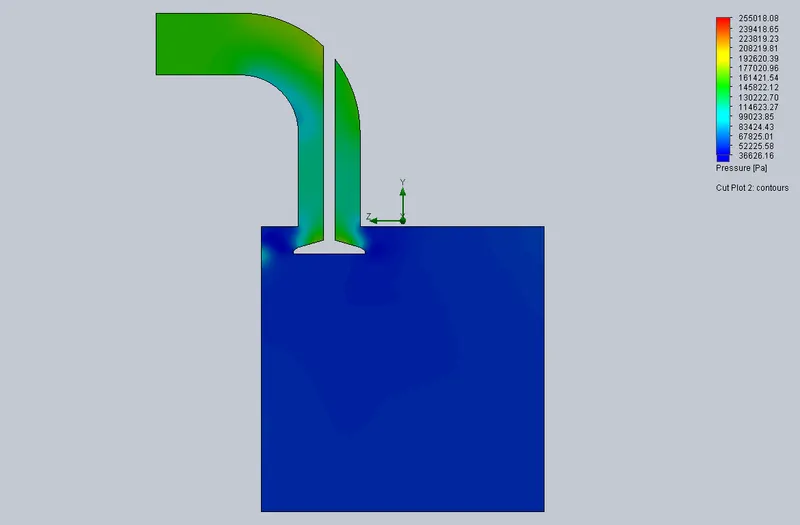
1) Pressure cut plot 2) Velocity cut plot
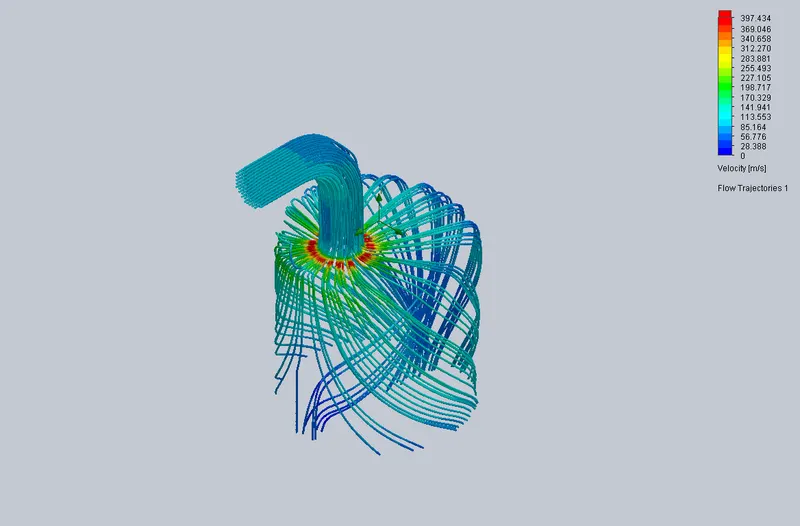
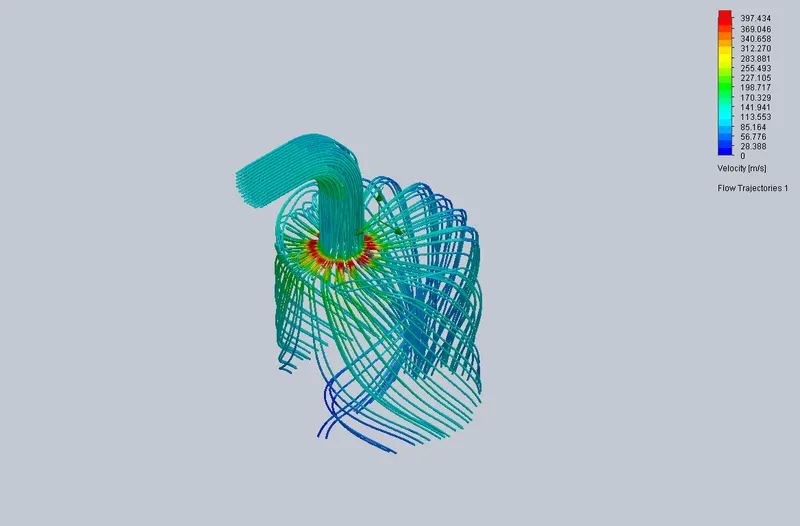
3) Pressure trajectries 4) Velocity trajectries
Case 2 : (For valve lift 2 mm)
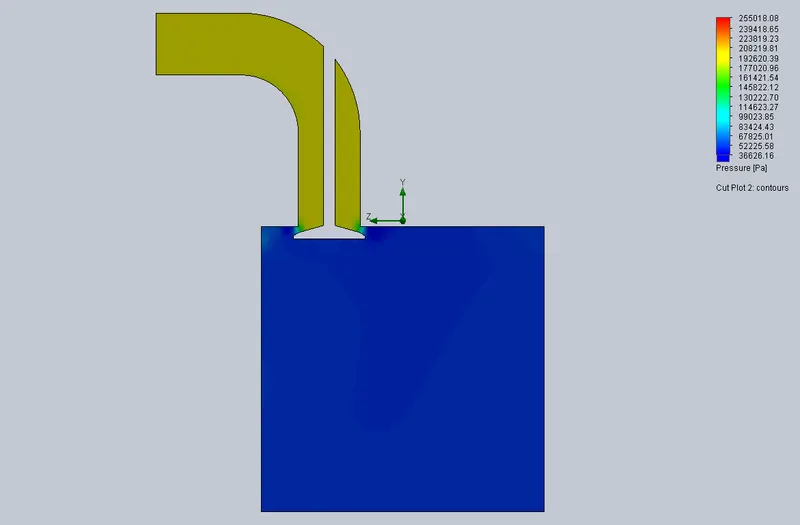
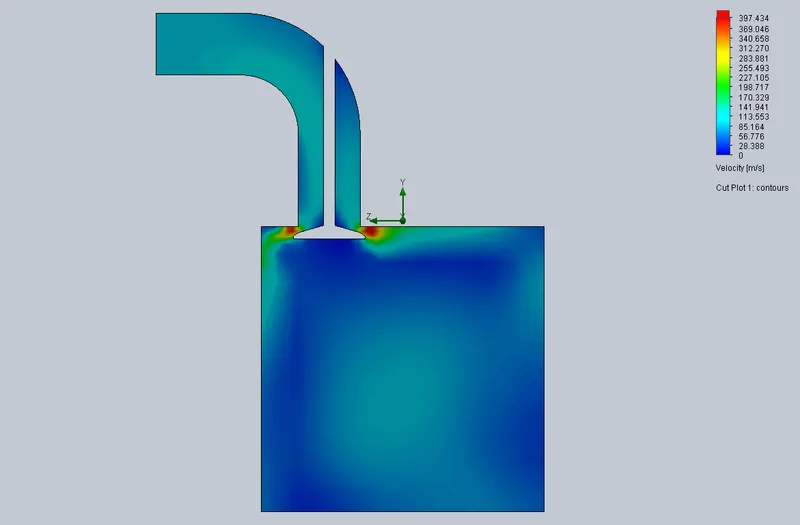
1) Pressure cut plot 2) Velocity cut plot
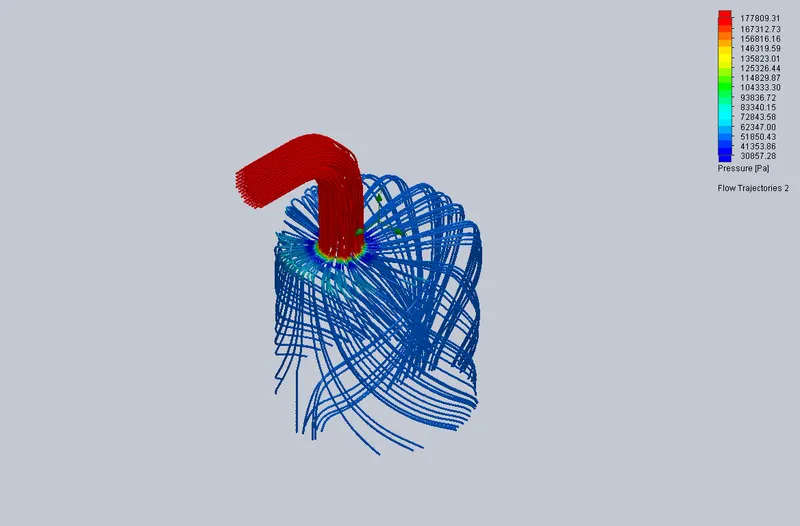
3) Pressure trajectries 4) Velocity trajectries
Case 3 : (For valve lift 3 mm)
1) Pressure cut plot 2) Velocity cut plot
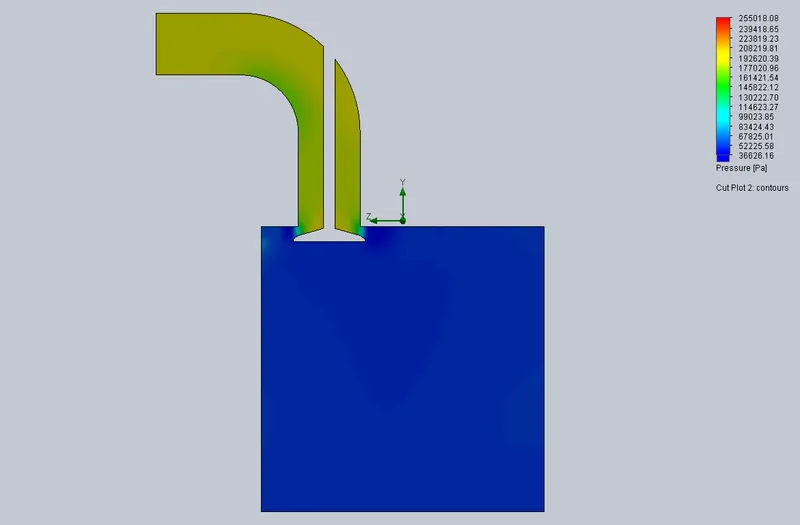
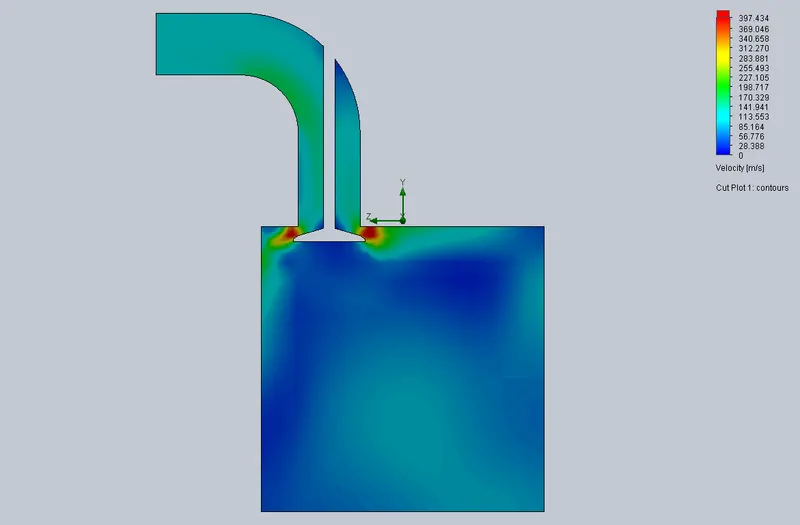
3) Pressure trajectries 4) Velocity trajectries
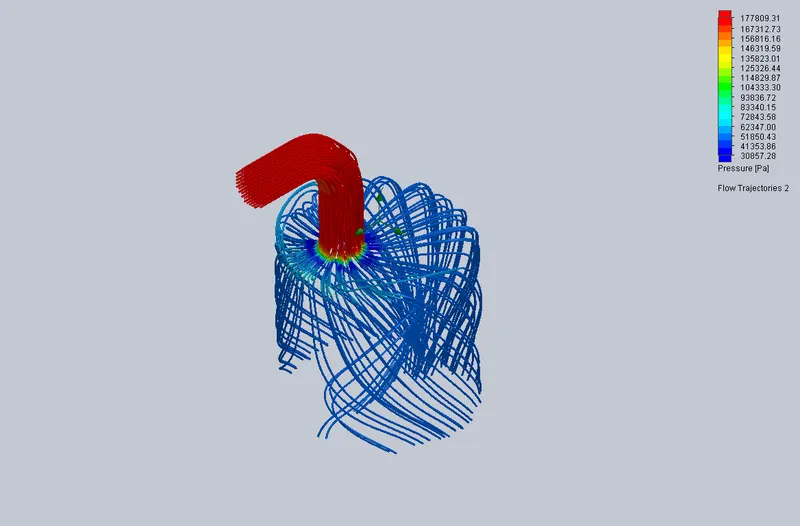
Case 4 : (For valve lift 4 mm)
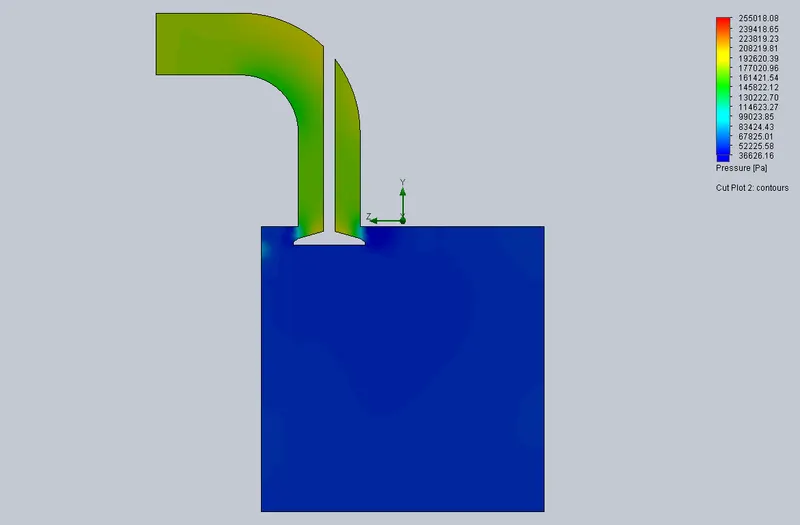
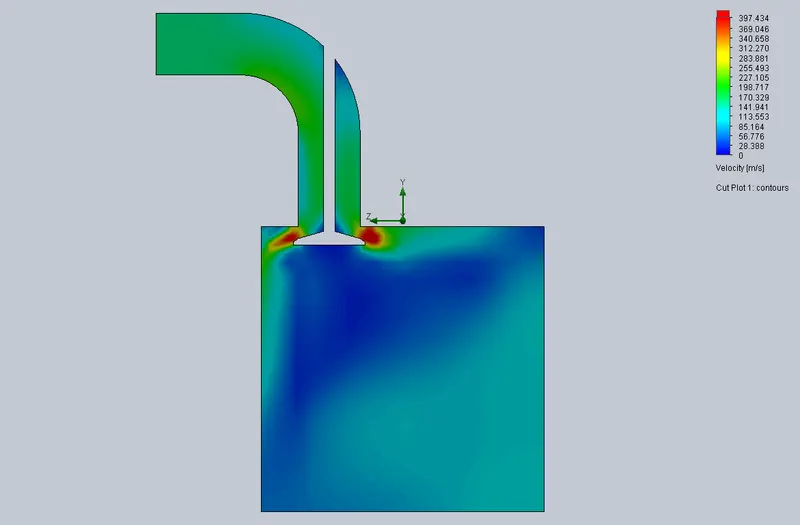
1) Pressure cut plot 2) Velocity cut plot
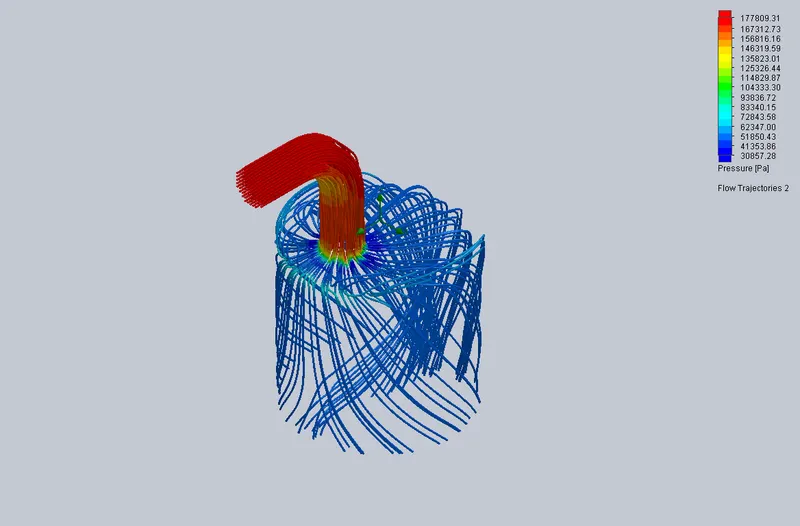
3) Pressure trajectries 4) Velocity trajectries
Case 5 : (For valve lift 5 mm)
1) Pressure cut plot 2) Velocity cut plot
3) Pressure trajectries 4) Velocity trajectries
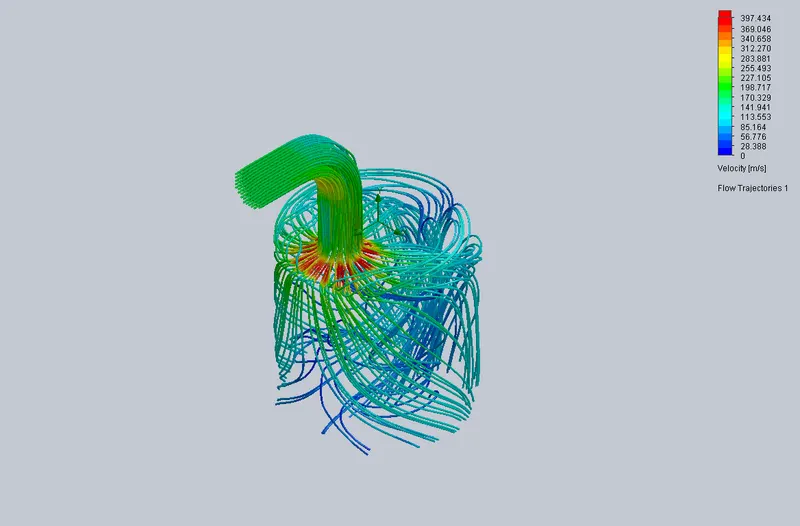
Case 6 : (For valve lift 6 mm)
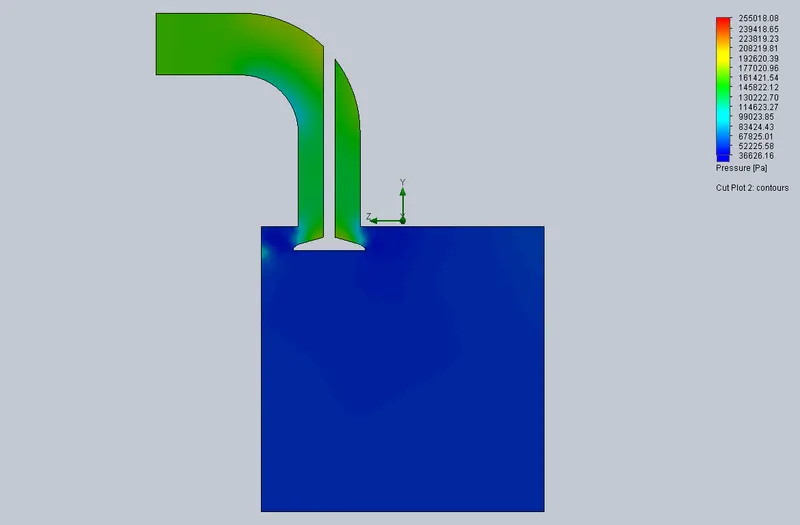
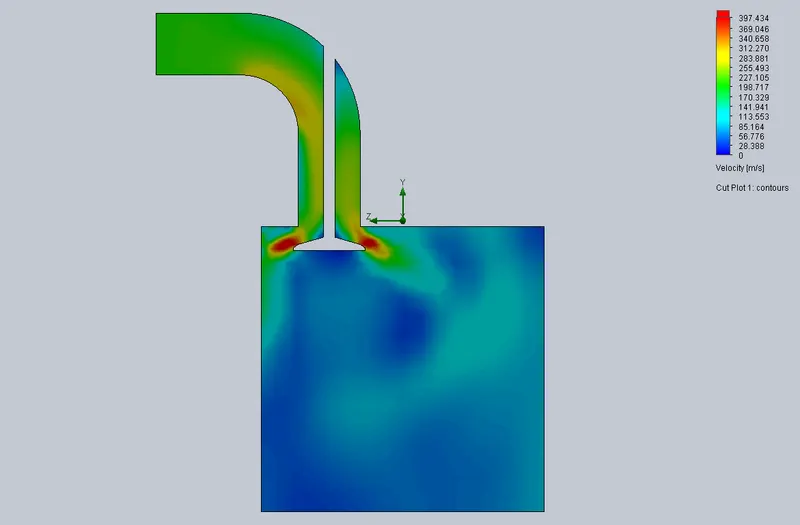
1) Pressure cut plot 2) Velocity cut plot
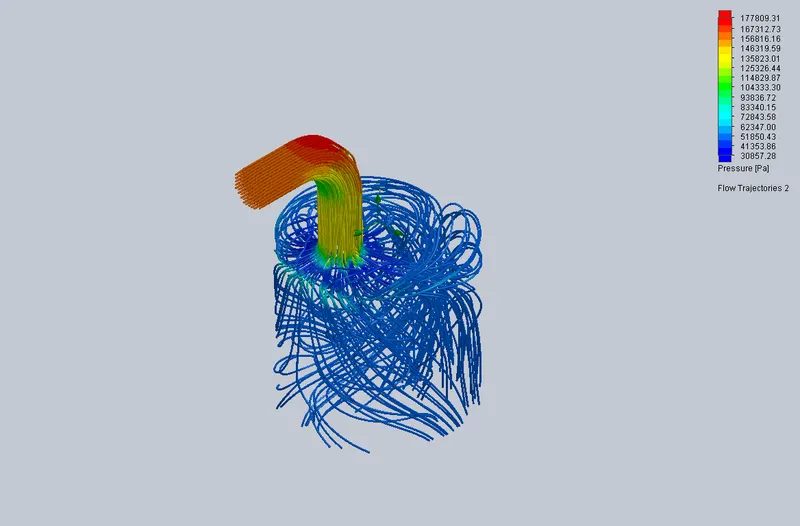
3) Pressure trajectries 4) Velocity trajectries
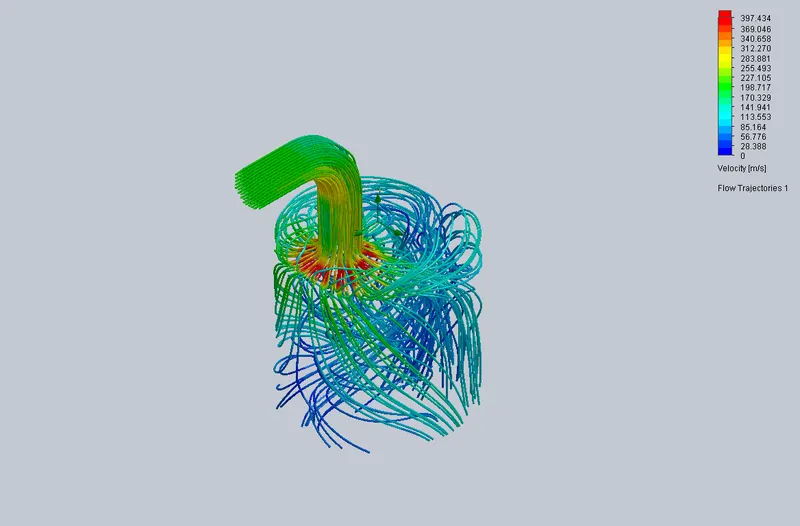
Case 7 : (For valve lift 7 mm)
1) Pressure cut plot 2) Velocity cut plot
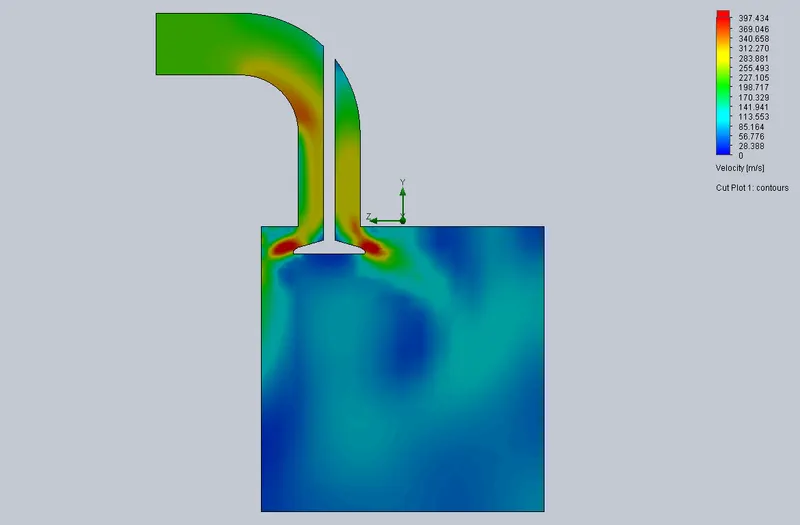
3) Pressure trajectries 4) Velocity trajectries
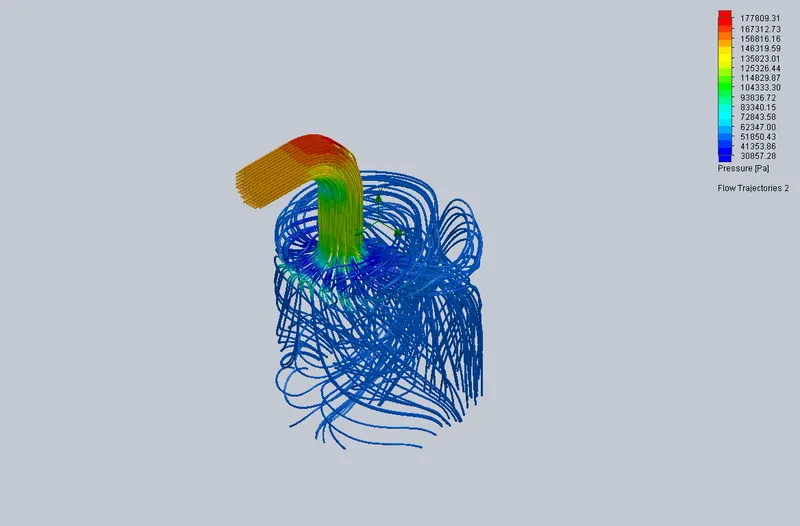
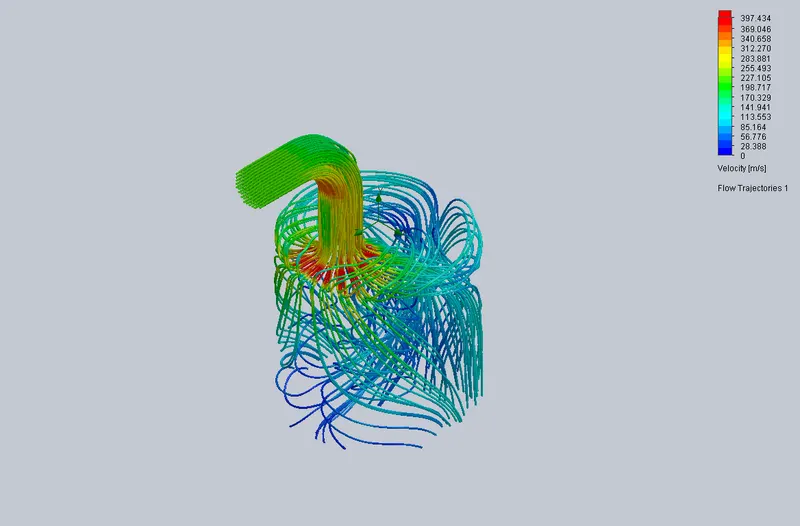
Case 8 : (For valve lift 8 mm)
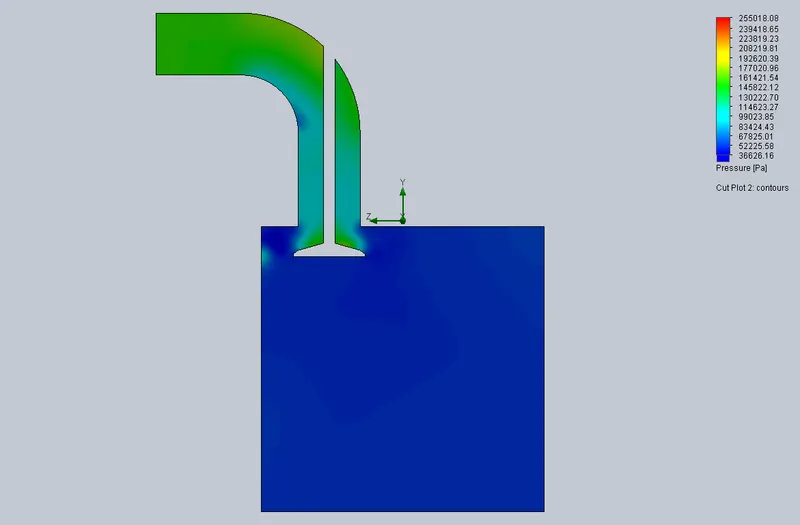
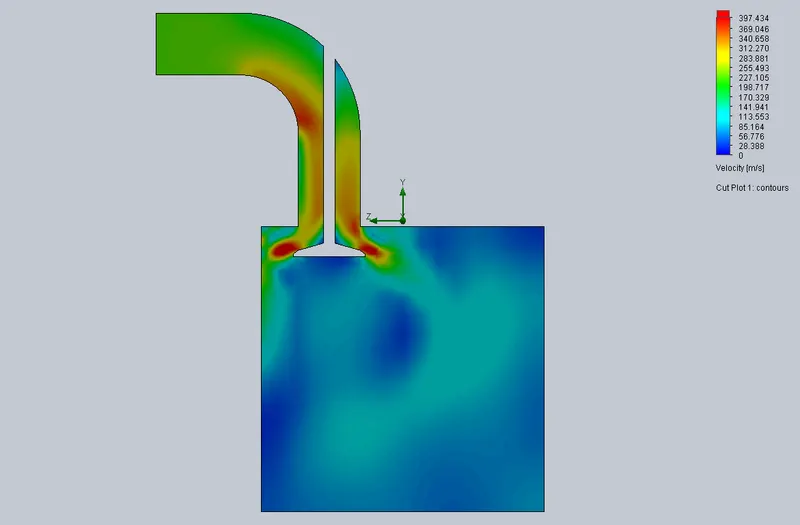
1) Pressure cut plot 2) Velocity cut plot
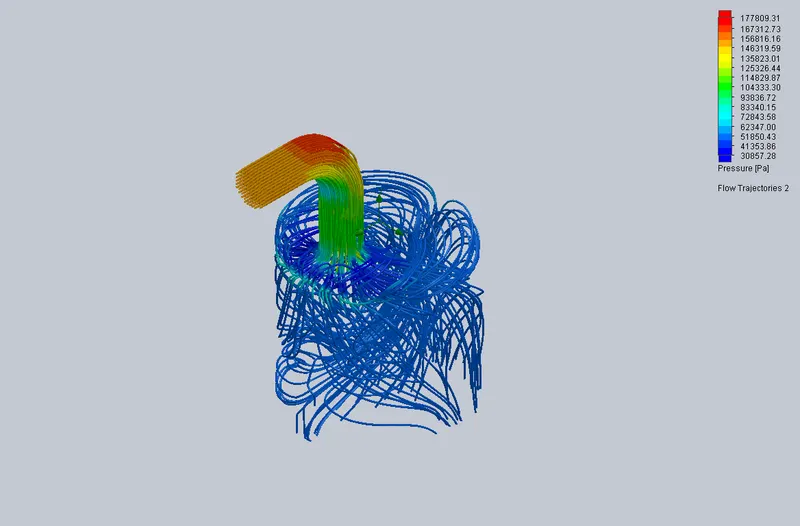
3) Pressure trajectries 4) Velocity trajectries
Output Data of goal :

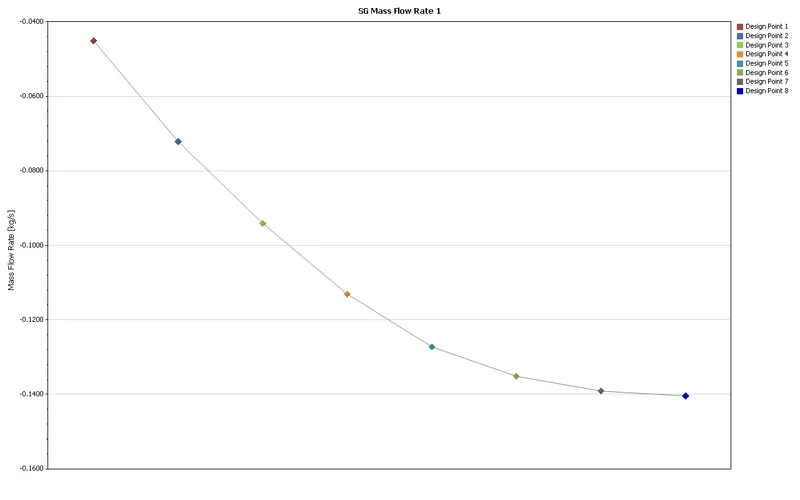
Here mass flow rate was the surface goal from outlet of flow bench. Negative sign indicates that mass is leaving the control volume and is just sign convention.
Conclusion :
As the valve lift increases, the mass flow rate coming out of the outlet also increases simultaneously, as fluid rushes into the cylinder and exit from the outlet. From the velocity cut plots, it can be concluded that as valve lift increases the velocity of the fluid entering into the cylinder also increases and the same thing can also be said for pressure cut plots.
Attachments :
1) Part file and the pressure , velocity plots and trajectries plots are ziped into the same file.