Modelling and simulation of flow through a flowbench
Modelling and Simulation of Flow through a Flowbench
using SolidWorks
BE (Mechanical Engineering)
by
Prajat Uday Sawant
Contents
Title
Contents
Introduction
Objective
Case Setup
Observations
Conclusion
Introduction
A flow bench is used to measure the flow restriction of various engine components, like air cleaners, carburettors, throttle bodies, manifolds, mufflers, and most importantly cylinder head ports. Lower restriction parts provide better HP and performance. The flow bench provides air flow through a component.
Flow control valves control the volumetric rate of the fluid that flows through them. Generally, changing the size of the orifice is how the flow rate is set and adjusted. A tapered needle moving in and out of an orifice or opening and closing the gap inside a ball valve changes this rate.
Objective
The aim is to understand and simulate a flow through a flowbench in SolidWorks by finding mass flow rate for various grid and selecting the best gride. And run a parametric study to understand the effect of valve lift on mass flow rate and observe the variation of velocity, pressure, flow trajectory and mass flow rate in a domain.
Case setup
At the beginning of the simulation the part/model is required to be made. A basic flow bench model is created as per dimension in Fig.1 in SolidWorks using tools and features. The model is show below with an isometric view and also a cross sectional view in Fig.2 and Fig.3 resp. then part/model is saved.
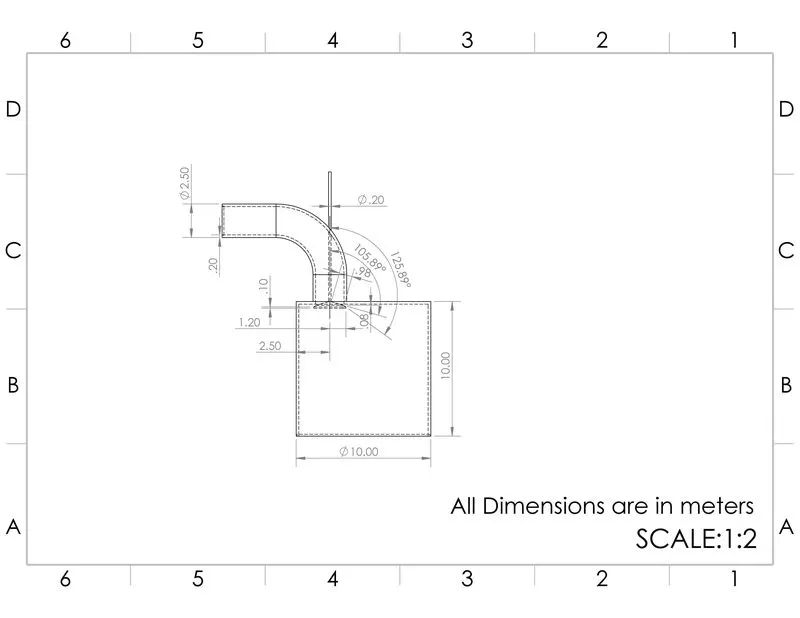
Fig.1
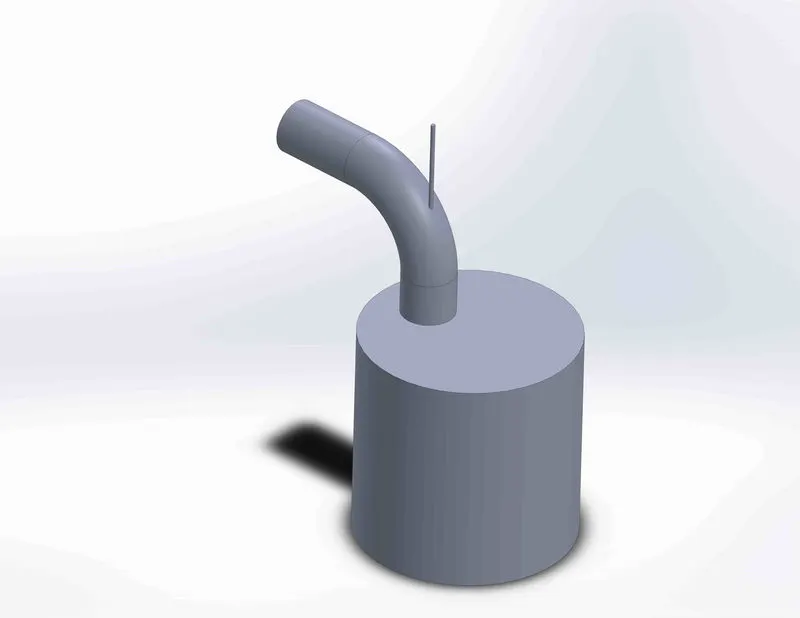
Fig.2
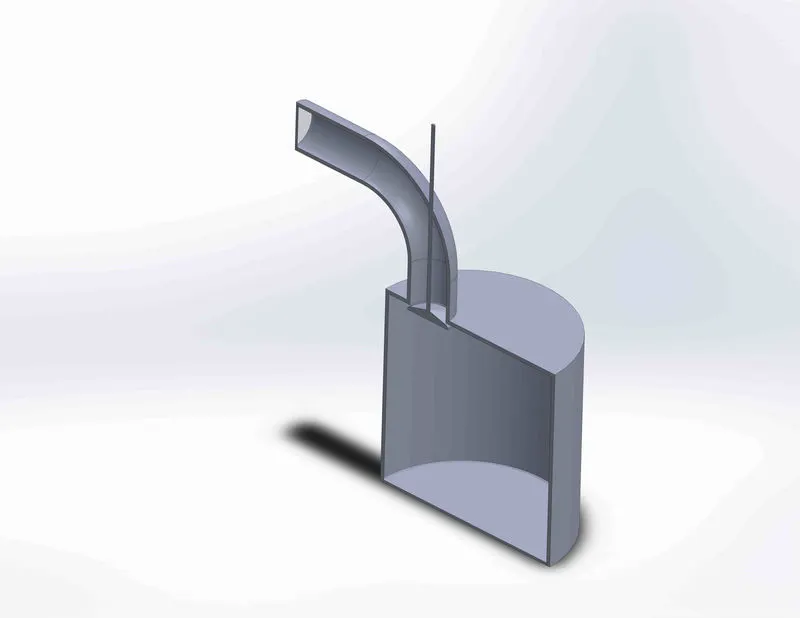
Fig.3
Applied the lids, at the inlet and outlet of the flowbench which creates the closed volume for the CFD simulation. Create a new simulation giving the name of the project. The model/part is given a Boundary condition to the part/model Total Pressure at intake and static pressure at exit. Added a surface goal as mass flow rate at the valve surface shown in Fig.4.
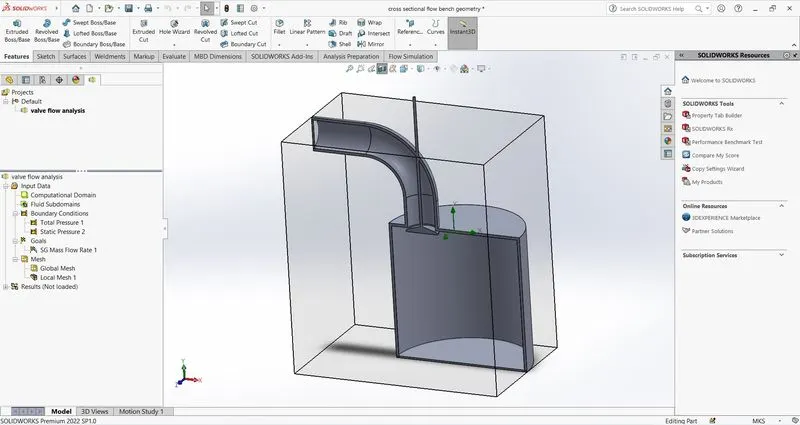
Run the basic simulation to observe the flow is flowing in right direction. After running a basic simulation velocity and pressure plot has been added to observe the results.
A grid dependency test has performed by creating a new parametric study keeping the valve lift at particular value and inserting input variable as a simulation parameter as global mesh level giving values as 3, 4, 5, 6 and 7. And output as surface goal (mass flow rate), velocity, pressure and trajectory plot. The study is run and values are being observed and exported to excel file.
After performing the gride dependency test, the appropriate mesh size is selected based on the results in grid dependency test. Again, the new parametric is created keeping the mesh size base on previous result and giving the input variable as dimension parameter as valve lift dimension giving values as 0.002m 0.004m, 0.006m, 0.008m and 0.01m. and output is same as in previous parametric study i.e., surface goal (mass flow rate), velocity, pressure and trajectory plot. Run the study and observed the results and exported to excel file.
Observations
Grid Dependency Test
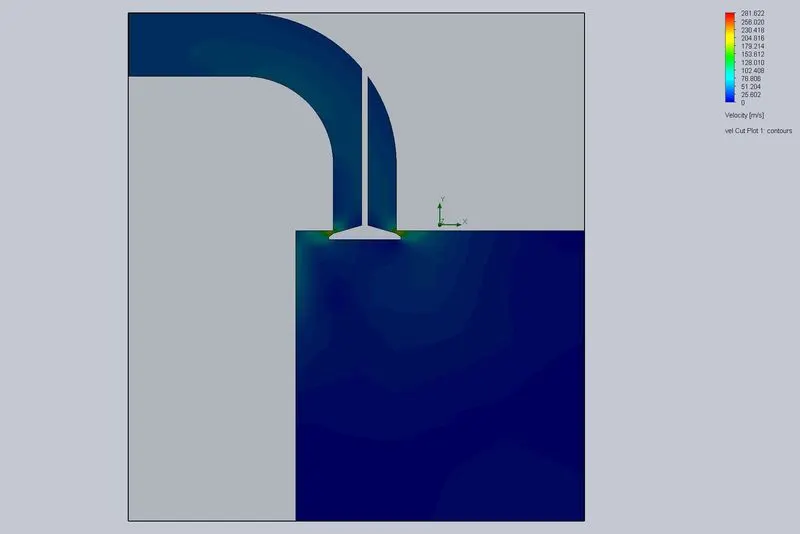
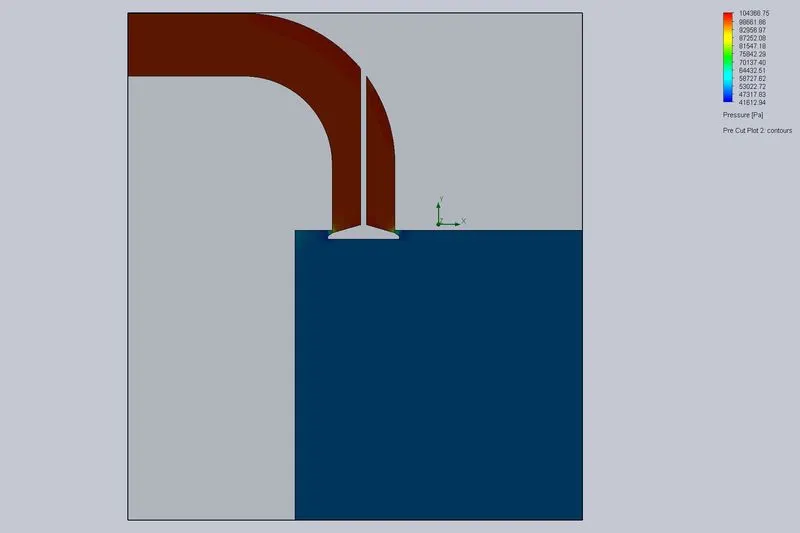
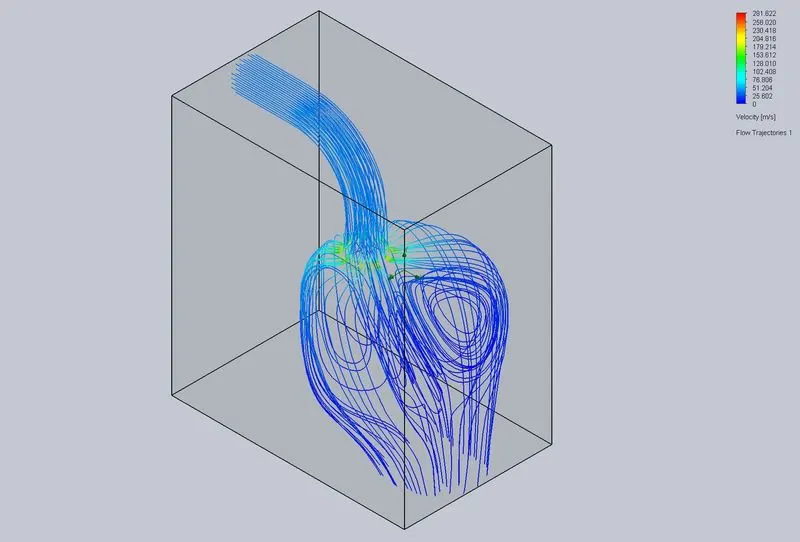
- Mesh size=3
Velocity plot
Pressure plot
Flow trajectory plot
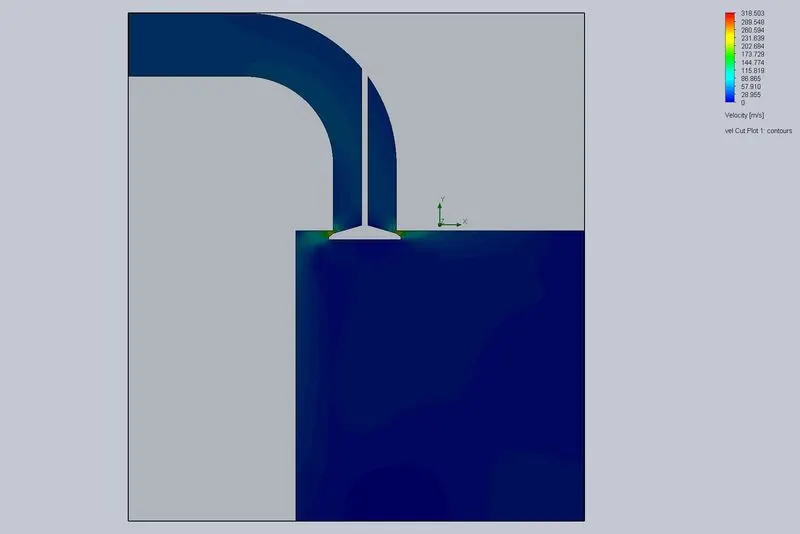
- Mesh size=4
Velocity plot
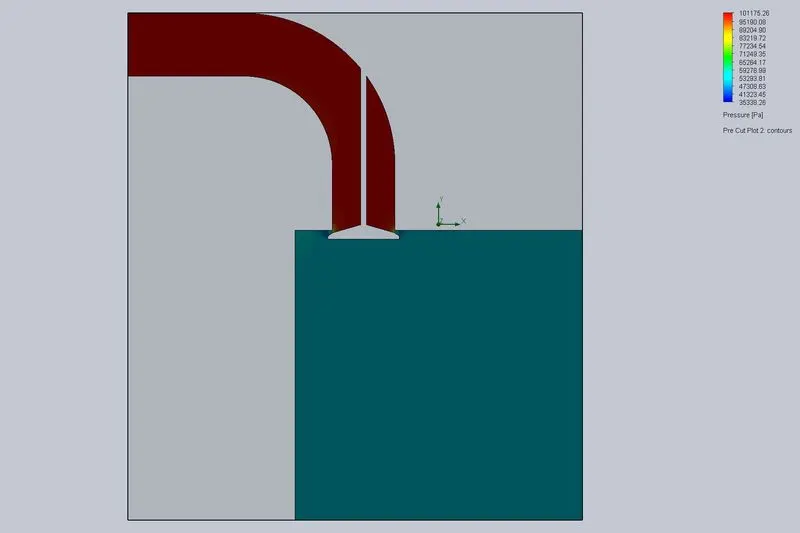
Pressure plot
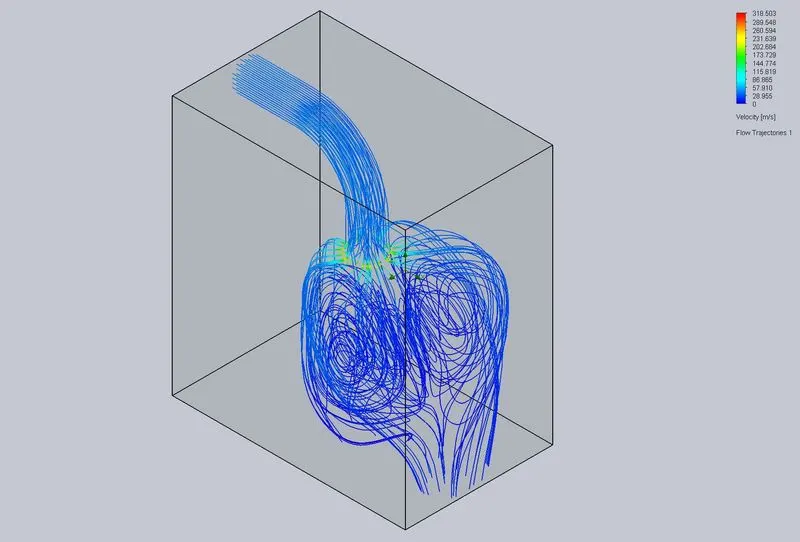
Flow trajectory plot
- Mesh size=5
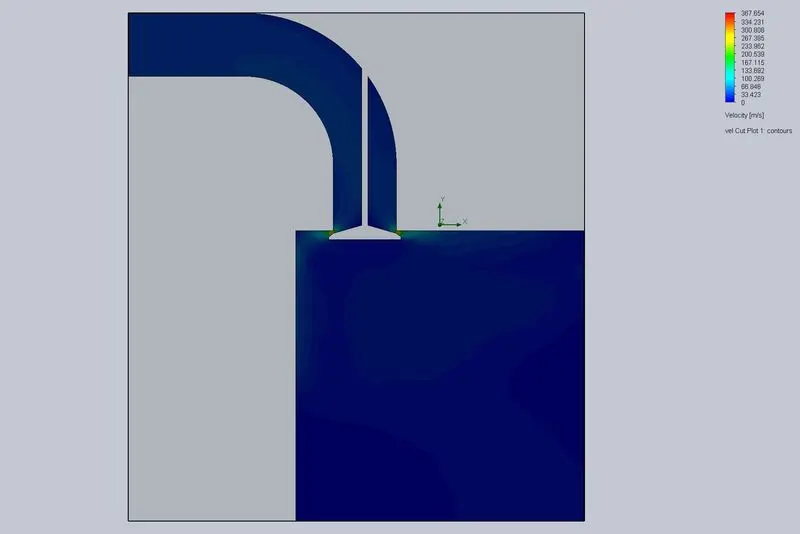
Velocity plot
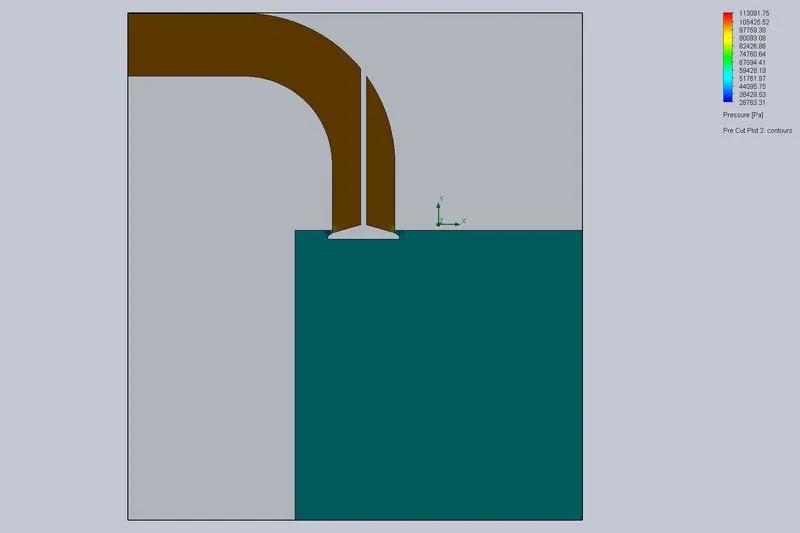
Pressure plot
Flow trajectory plot
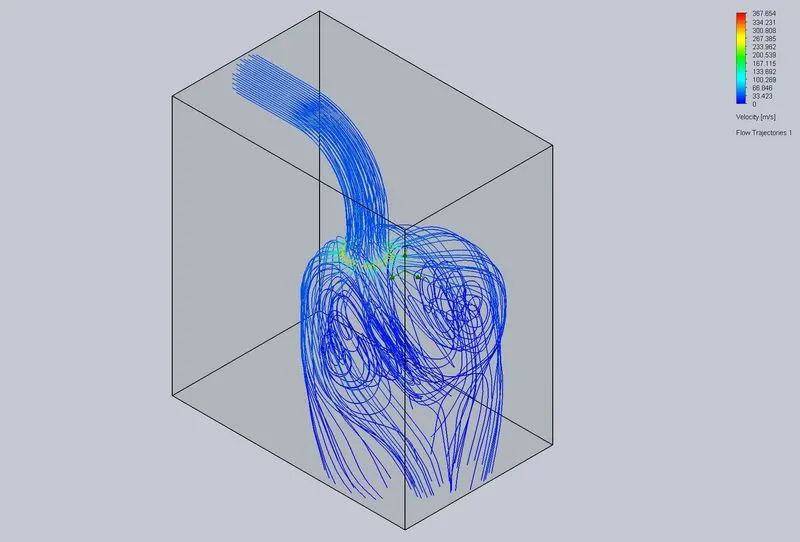
- Mesh size=6
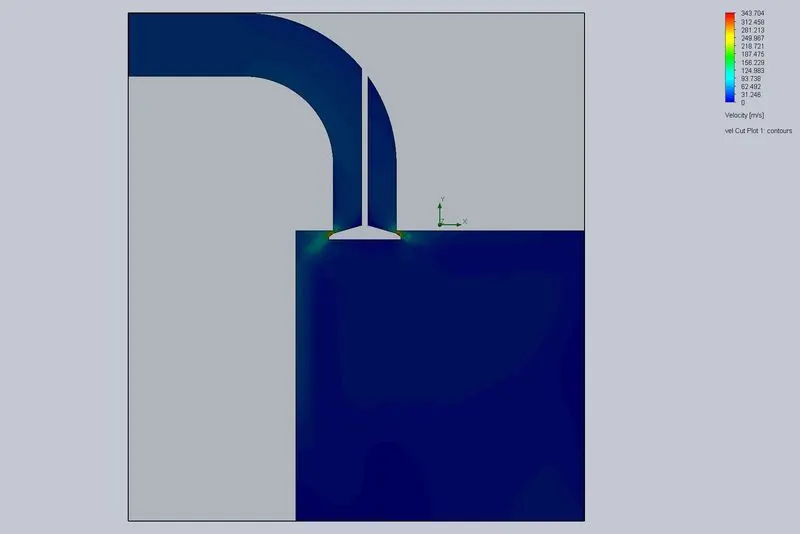
Velocity plot
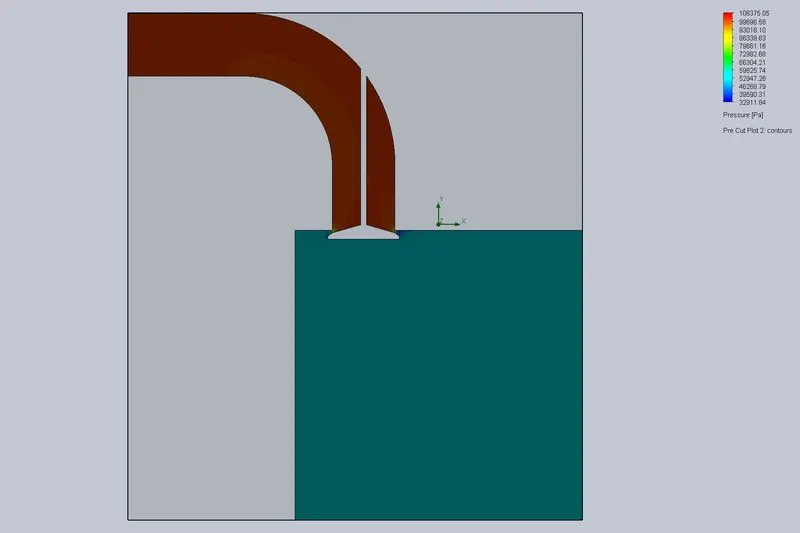
Pressure plot
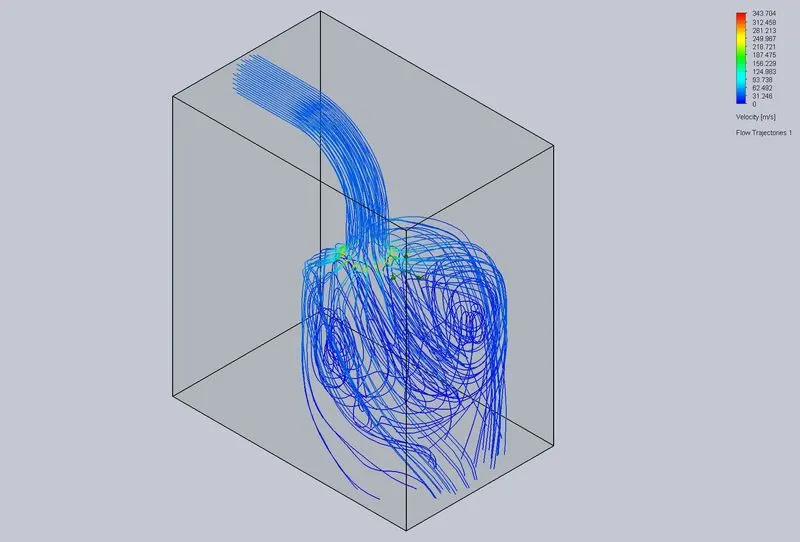
Flow trajectory plot
- Mesh size=7
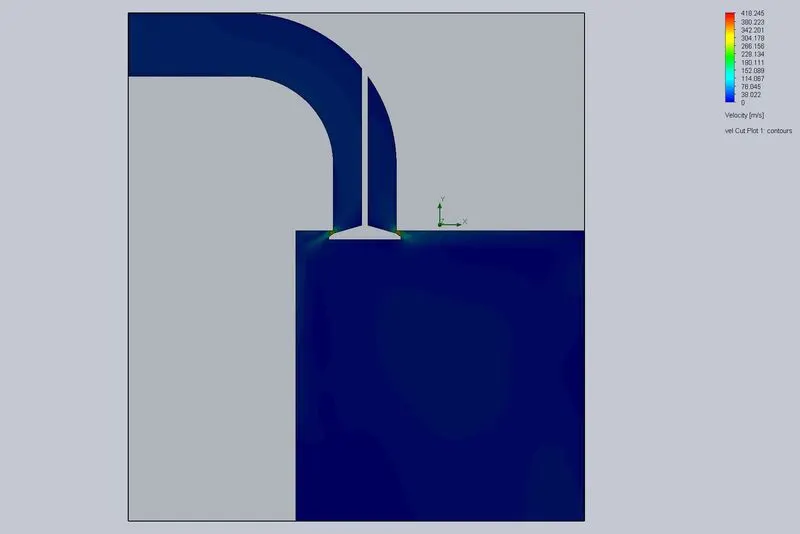
Velocity plot
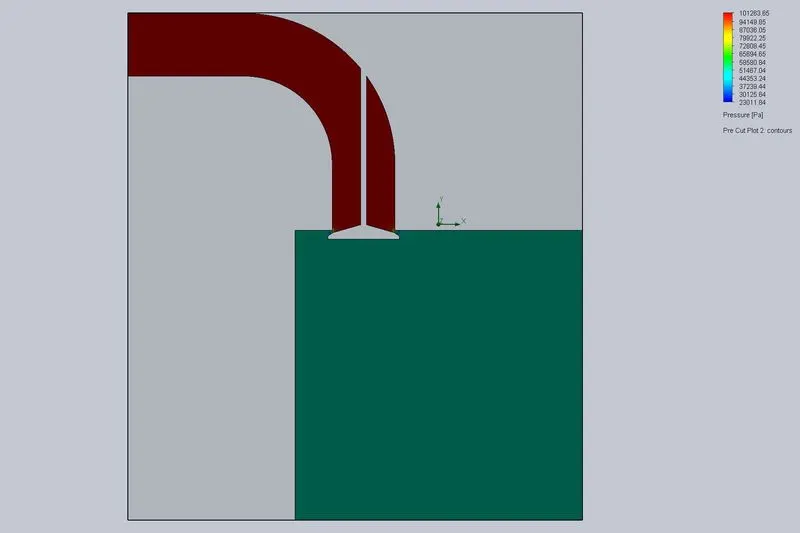
Pressure plot
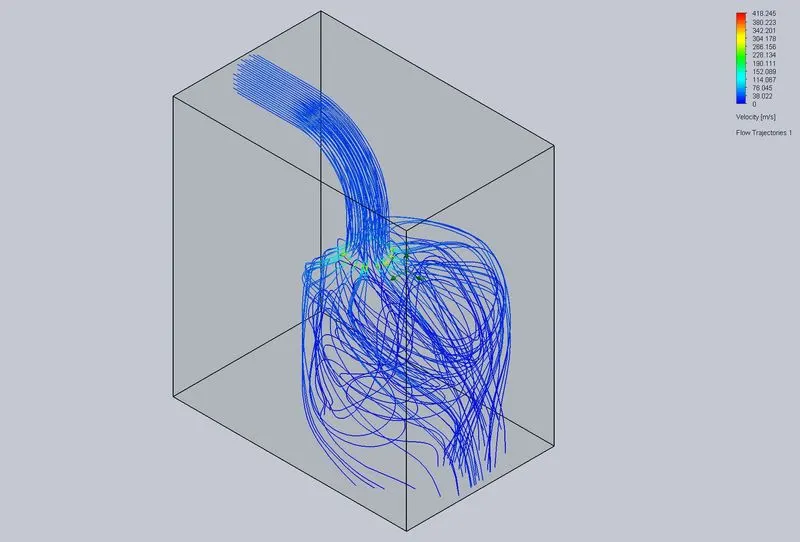
Flow trajectory plot
| Goal (value) | Design Point 1 | Design Point 2 | Design Point 3 | Design Point 4 | Design Point 5 |
| Level of Initial Mesh | 3 | 4 | 5 | 6 | 7 |
| SG Mass Flow Rate [kg/s] | 0.016076829 | 0.016464268 | 0.014453038 | 0.015418073 | 0.014154871 |
Form the table, the mass flow rate is not at stable value. so, the mesh size is been selected by calculating the average of the mass flow rates and selecting the mesh size nearest value to mass flow to it. In this case the average mass flow is 0.0153134158kg/s and is nearest value to mass flow rate to mesh size 6.
Flow at different Valve Lifts
-Velocity plots:
- Valve lift = 0.002m
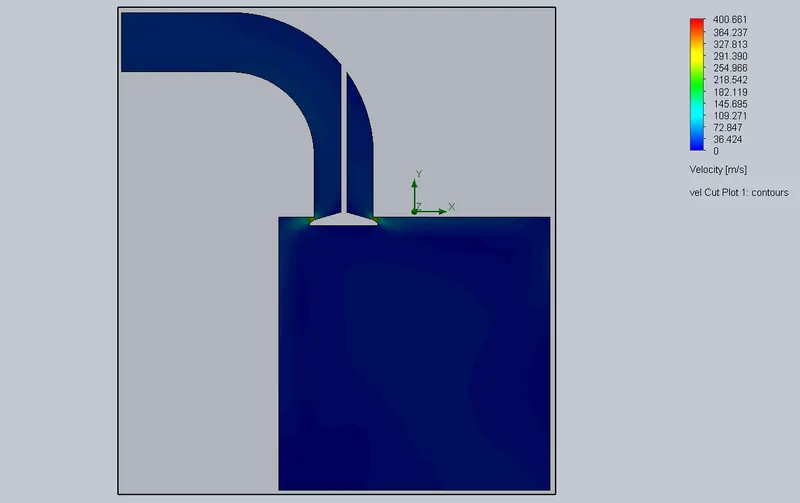
- Valve lift = 0.004m
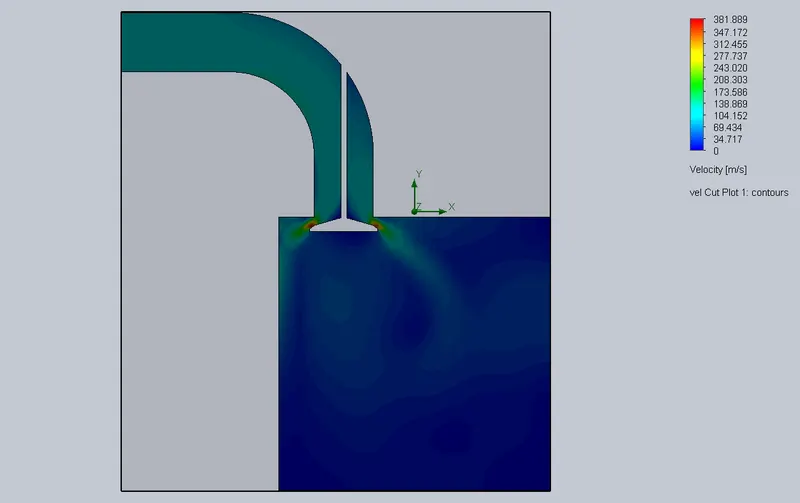
- Valve lift = 0.006m
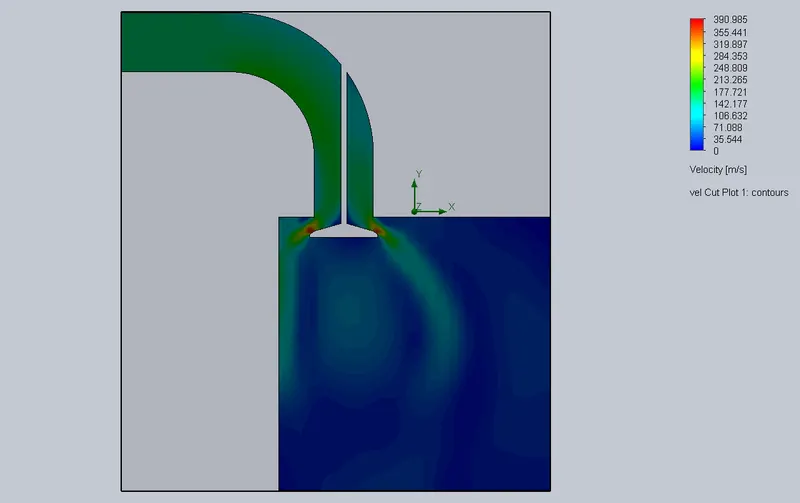
- Valve lift = 0.008m
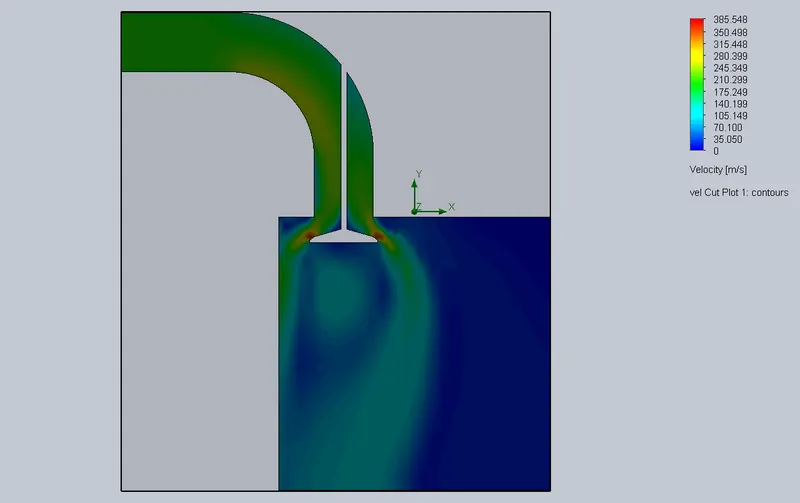
- Valve lift = 0.01m
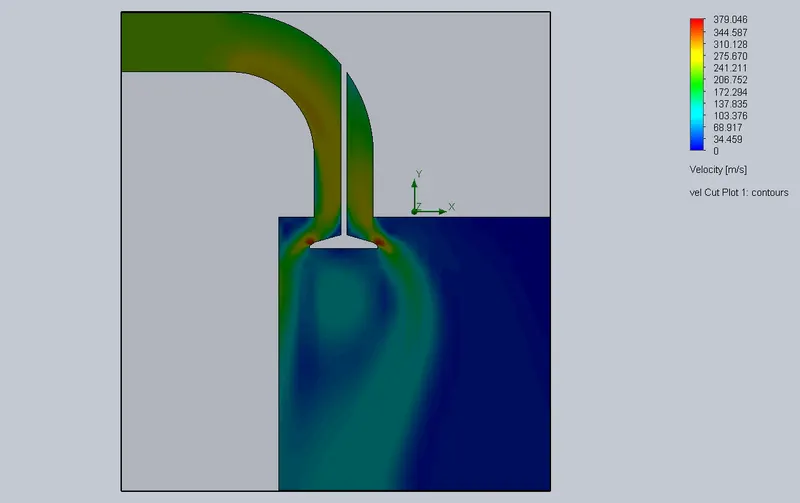
Form velocity contours, it can be observed that increased in valve lift increases the velocity at intake.
-Pressure plots:
- Valve lift = 0.002m
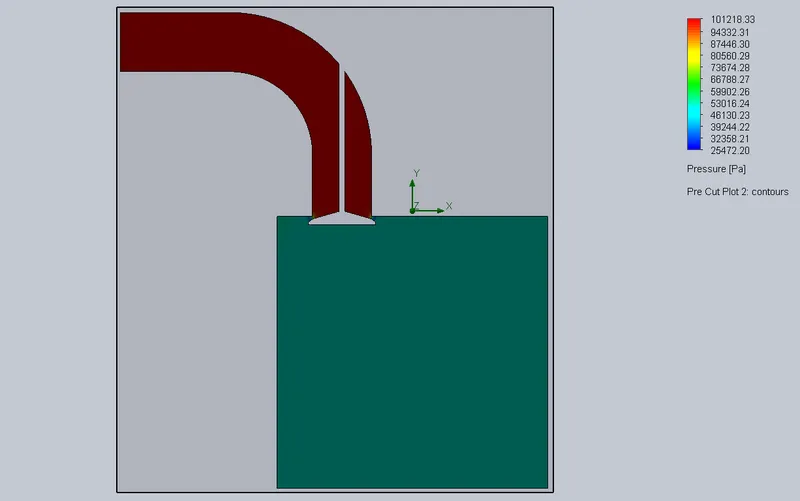
- Valve lift = 0.004m
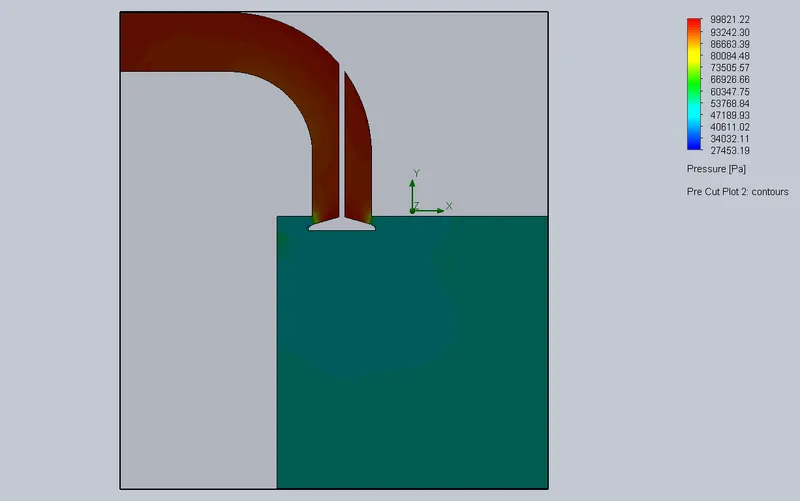
- Valve lift = 0.006m
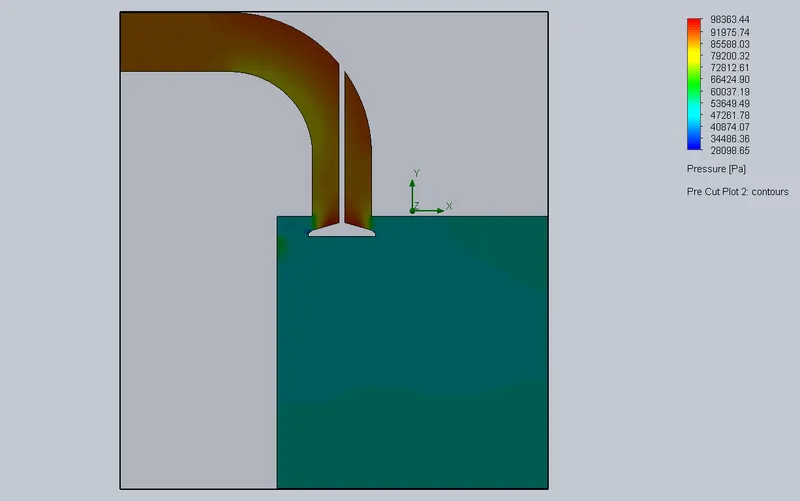
- Valve lift = 0.008m
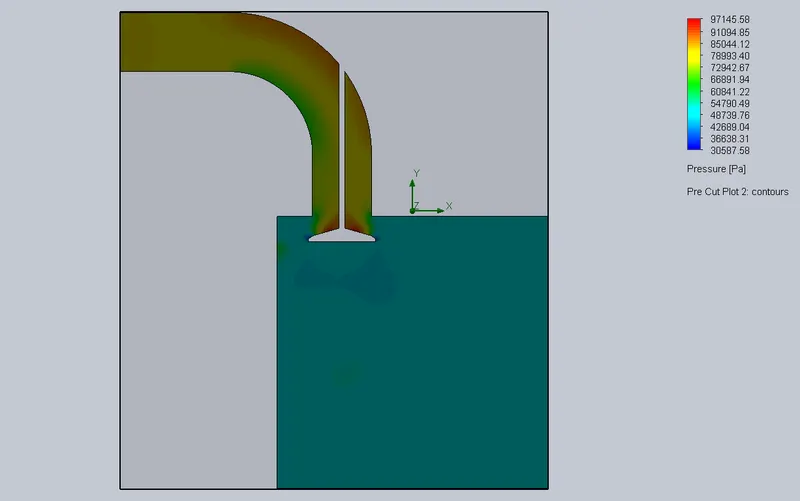
- Valve lift = 0.01m
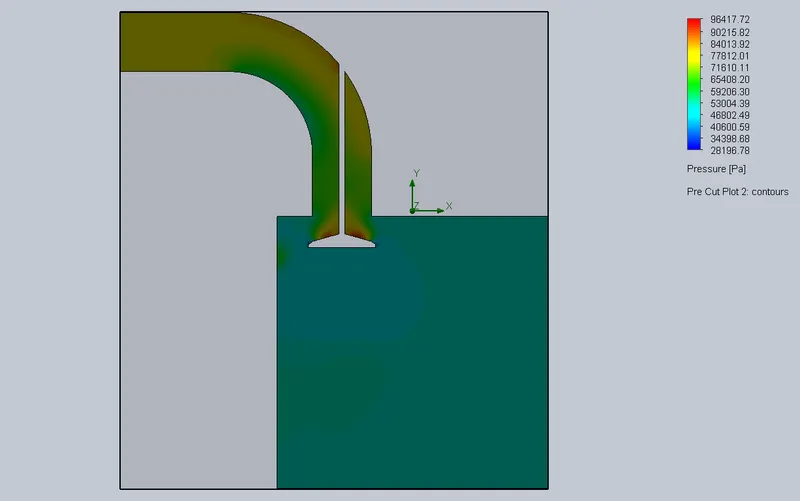
Form pressure contours, it can be observed that increased in valve lift decreases the pressure at valve.
-Flow Trajectory plots:
- Valve lift = 0.002m
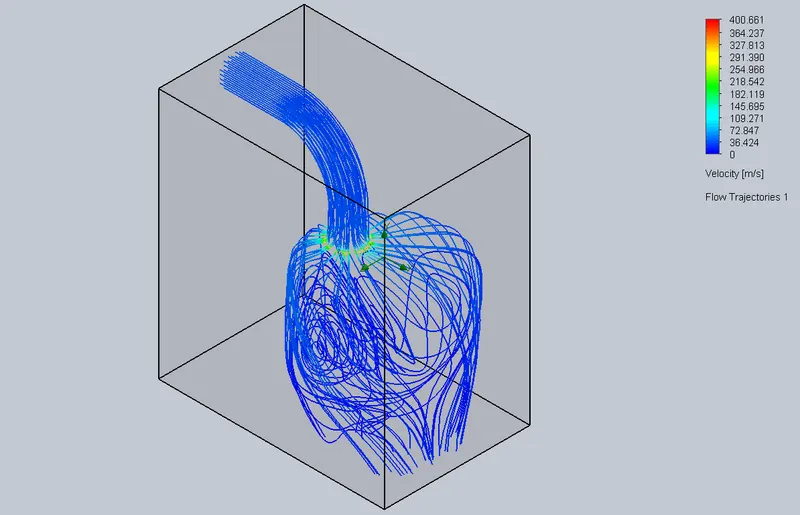
- Valve lift = 0.004m
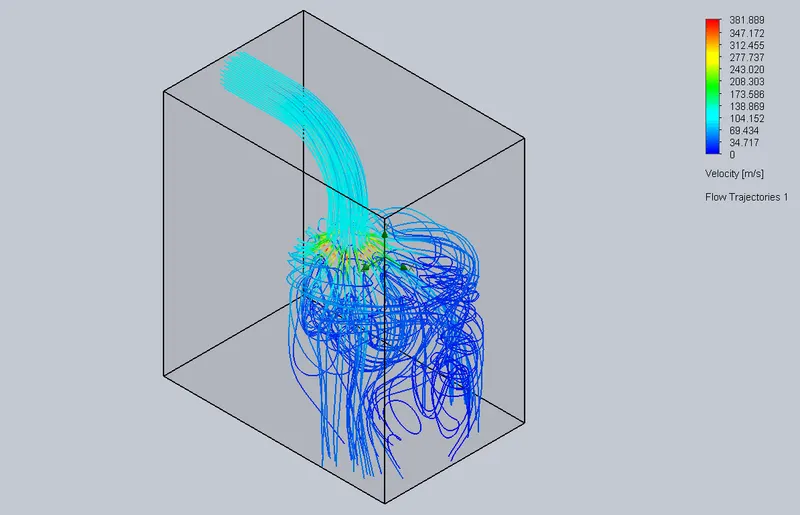
- Valve lift = 0.006m
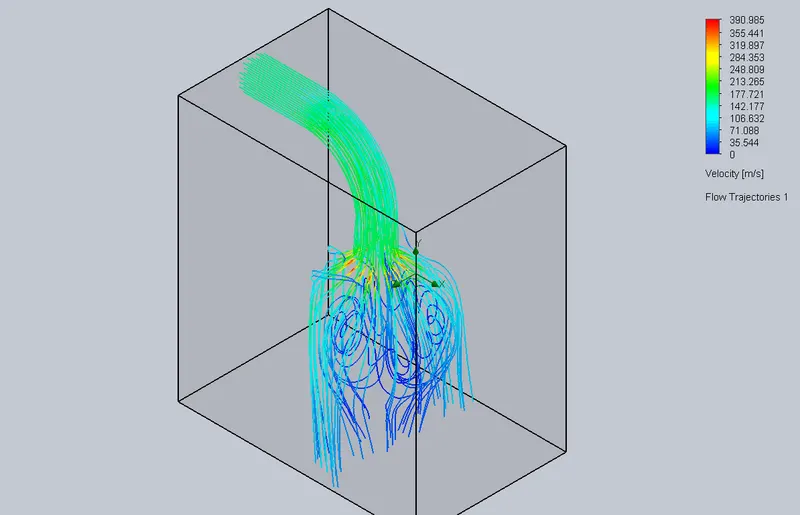
- Valve lift = 0.008m
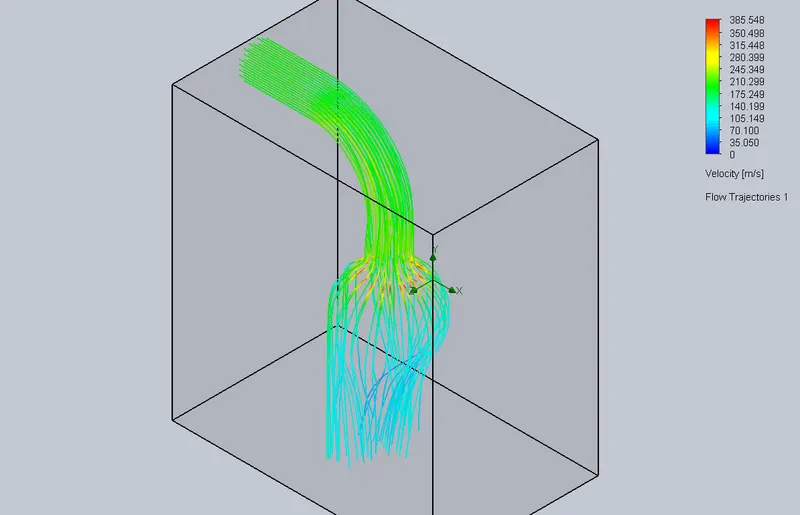
- Valve lift = 0.01m
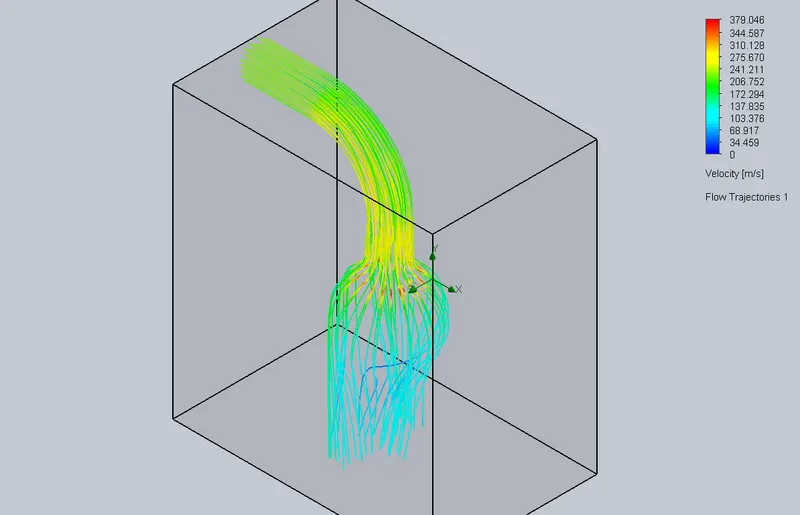
Form flow trajectory plot, it can be observed that increased in valve lift increases the velocity on fluid and decreases the pressure the allow the fluid to flow.
| Goal (Value) | Design Point 1 | Design Point 2 | Design Point 3 | Design Point 4 | Design Point 5 |
| Valve lift [m] | 0.002 | 0.004 | 0.006 | 0.008 | 0.01 |
| SG Mass Flow Rate [kg/s] | 0.014260756 | 0.039446231 | 0.056109611 | 0.065599114 | 0.070220209 |
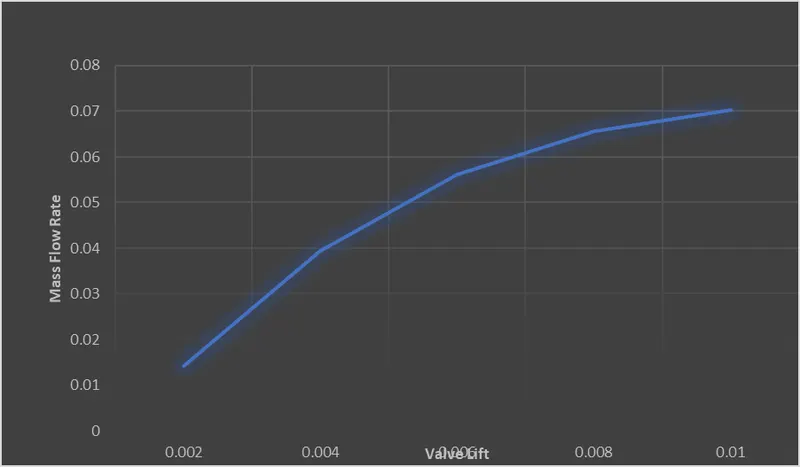
From above plot, it observed that there is increase in mass flow rate as the valve lift is increased.
Conclusion
The concept of a flow through a Flowbench simulation has been properly implemented using the SolidWorks by creating a flowbench model and doing simulation. From Grid dependency test the appropriate grid is found to be mesh size 6 which is also reduces the computational time for the study. Also, the doing parametric study on effect of different valve lift on mass flow rate, which results that increase in valve lift increases the mass flow rate.