Centrifugal pump design and analysis
Centrifugal pump Design and Analysis
using SolidWorks
BE (Mechanical Engineering)
by
Prajat Uday Sawant
Contents
Title
Contents
Introduction
Objective
Case Setup
Observations
Conclusion
Introduction
The flow analysis in the centrifugal pump is highly complex mainly due to 3d flow structure involving turbulence, secondary flow, cavitation, unsteadiness.
The applications of CFD in design of water pumps and turbines stared about 30 years ago. Initially finite element method was used which is now replaced by RANS equations solved using advanced turbulence models. Most recent areas of research are effects of 2 phase flow and fluid structure interaction.
Computational Flow Dynamics helps in prediction of flow behaviour in different parts of hydraulic machines before actually manufacturing them. CFD analysis helps in studying the effects of various parameters, independently as well as by forming non dimensional groups on pump performance.
Objective
The aim is to design a centrifugal pump and simulate a flow through a pump in SolidWorks. And run a parametric study to understand the effect outlet velocity and observe the variation of velocity, pressure, flow trajectory and mass flow rate in a domain.
Case setup
At the beginning of the simulation the part/model is required to be made. A centrifugal pump model is created as shown in Fig.1. The impeller is been made with six blades is shown in Fig.2. and dimensions are in Fig.3. Impeller and the pump casing are not merge with each other. For the rotating region for impeller, a cylindrical chamber is created enclosing the impeller. The part/model is saved.
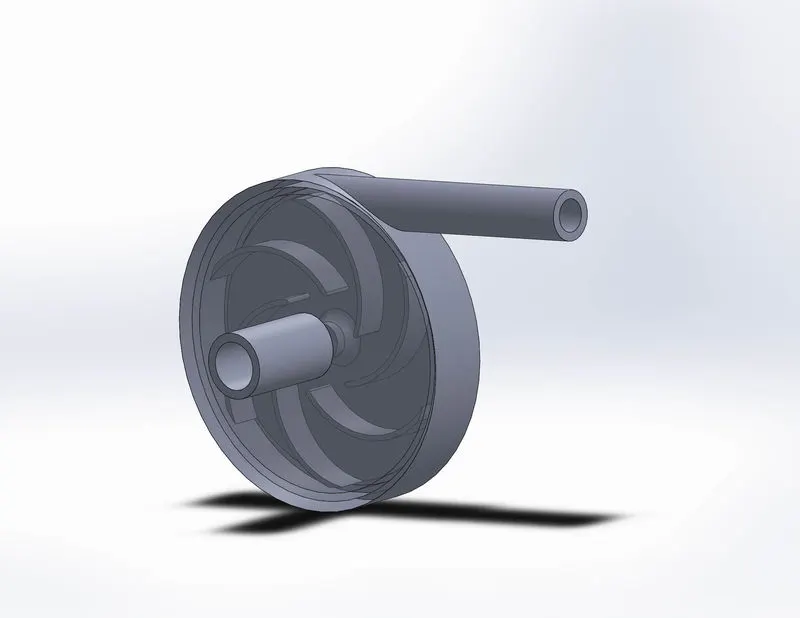
Fig.1
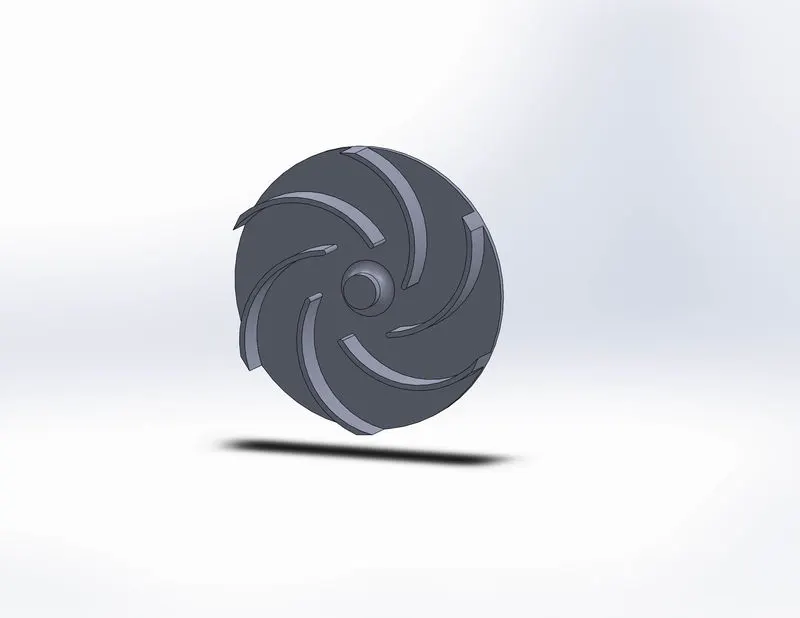
Fig.2
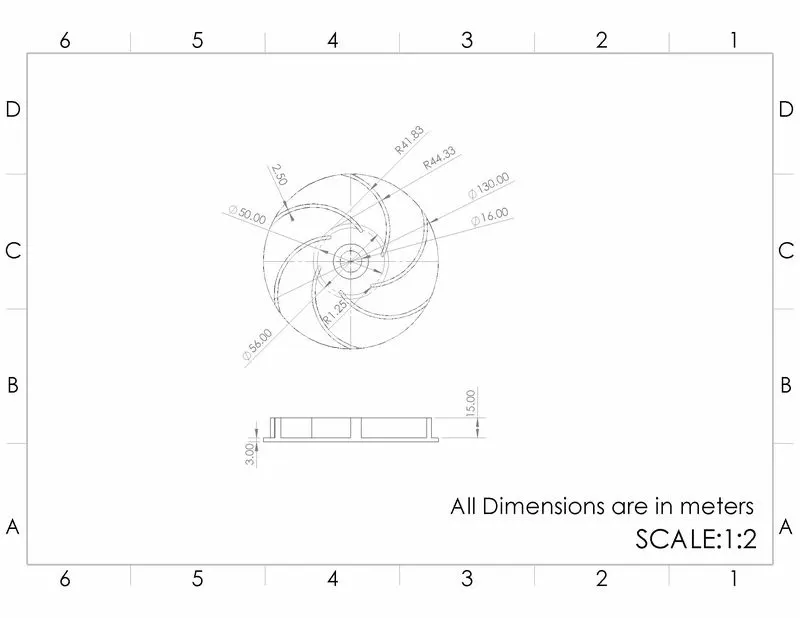
Fig.3
Applied the lids, at the inlet and outlet of the pump which creates the closed volume for the CFD simulation. Create a new simulation giving the name of the project. Creating internal flow with rotation. Chosen fluid as a water. Editing the control components and deselecting the rotating region which is not a part of the pump structure. Inserted rotating region with 1000rad/s in clockwise direction. The model/part is given a Boundary condition, Environment pressure at intake and Outlet velocity of 10m/s at outlet. Added a surface goal as average total pressure at inlet outlet and mass flow rate shown in Fig.4.
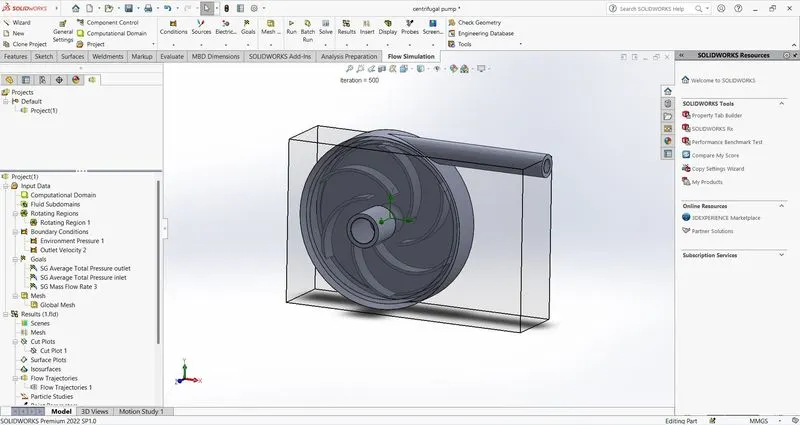
Fig.4
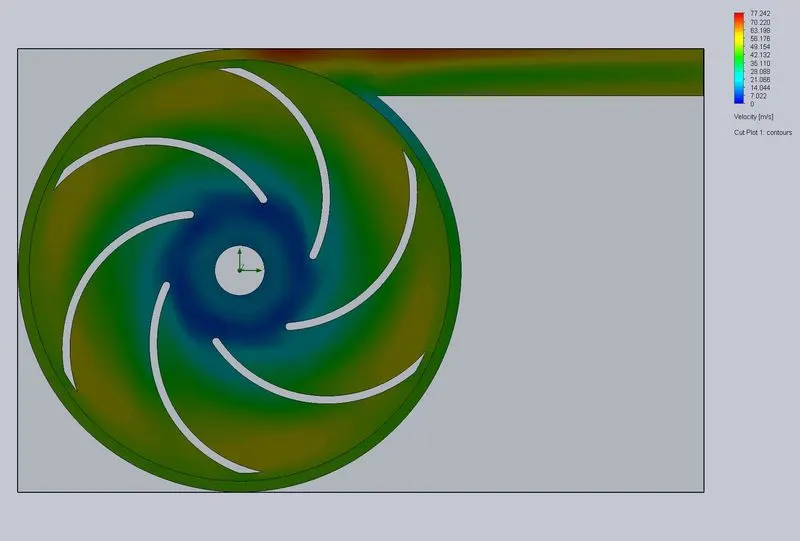
Run the basic simulation to observe the flow is flowing in right direction. After running a basic simulation velocity plot and flow trajectory has been added to observe the results.
After performing the basic simulation, the new parametric is created giving the input variable as simulation parameter as outlet velocity giving values as 10m/s, 20m/s, 30m/s, 40m/s and 50m/s. and output variables as surface goals (average total pressure at inlet & outlet and mass flow rate), velocity plot and trajectory plot. Run the study and observed the results and exported to excel file.
Observations
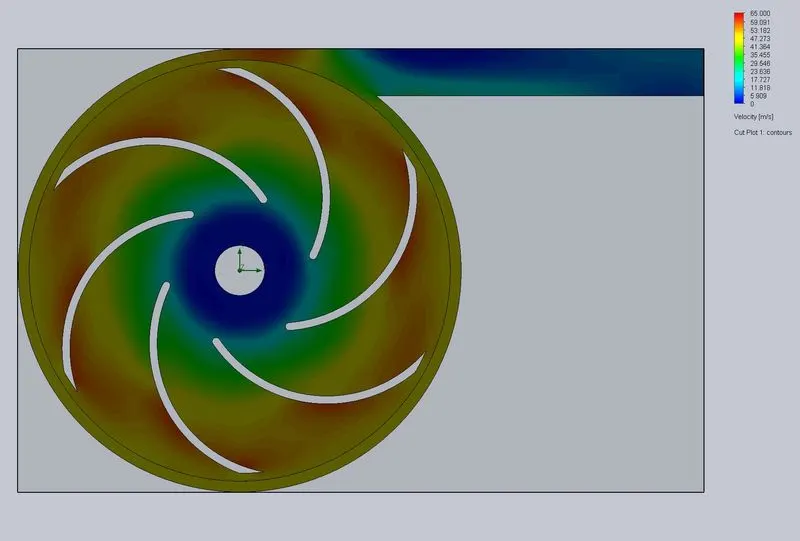
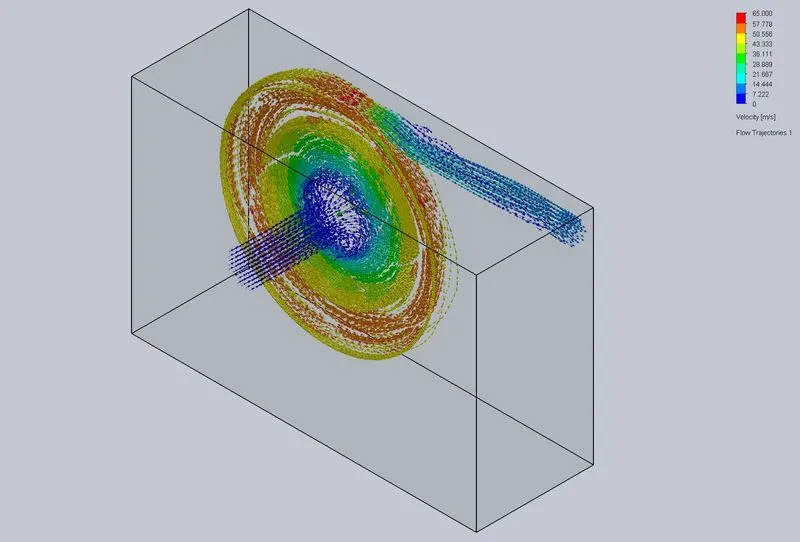
- For Outlet Velocity=10m/s
Velocity plot
Flow trajectory plot
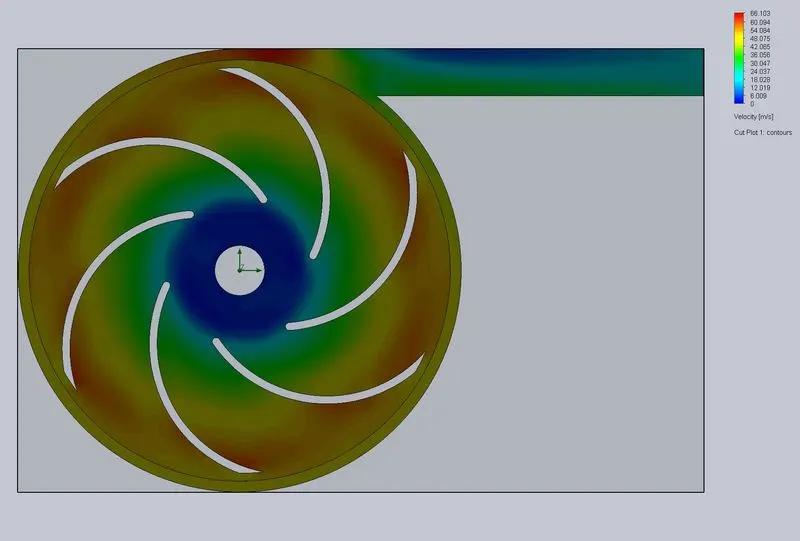
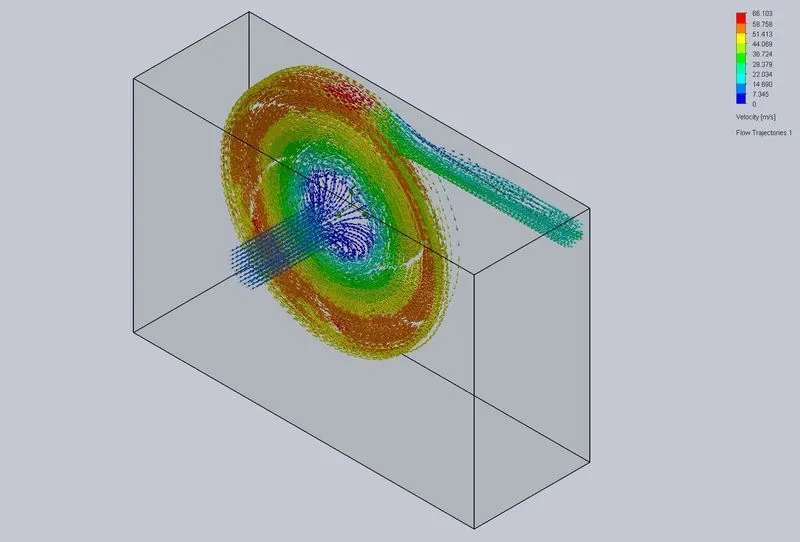
- For Outlet Velocity=20m/s
Velocity plot
Flow trajectory plot
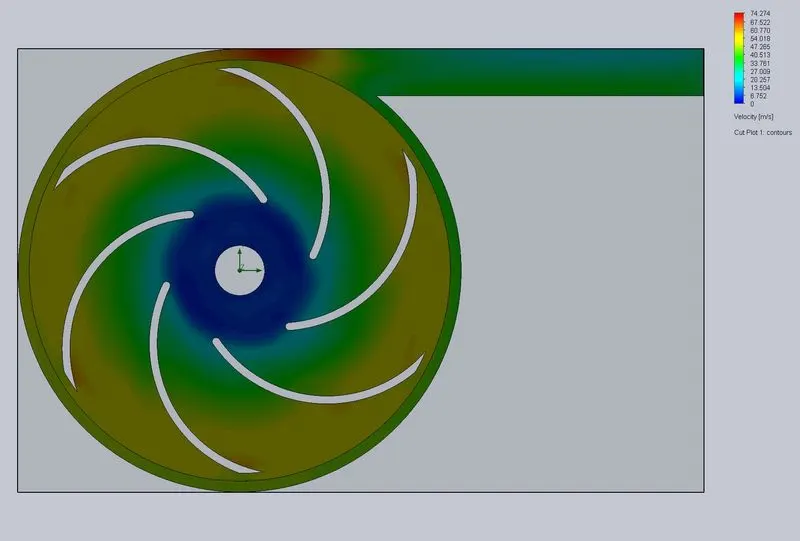
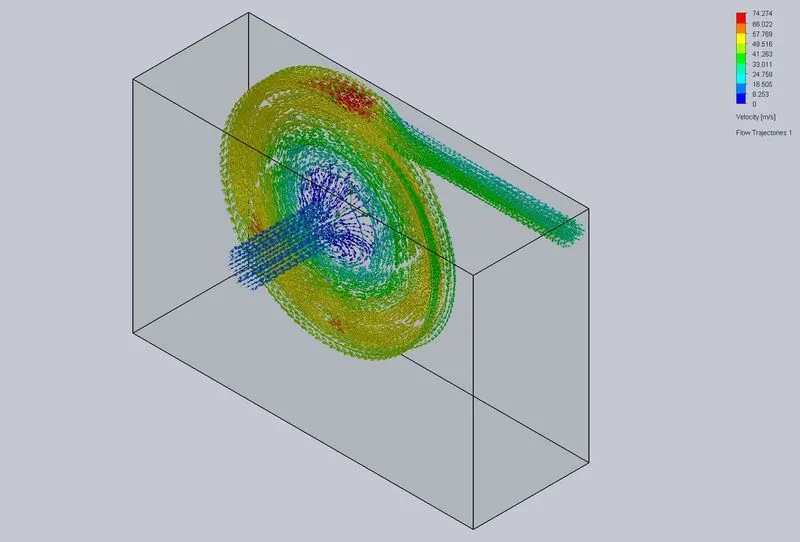
- For Outlet Velocity=30m/s
Velocity plot
Flow trajectory plot
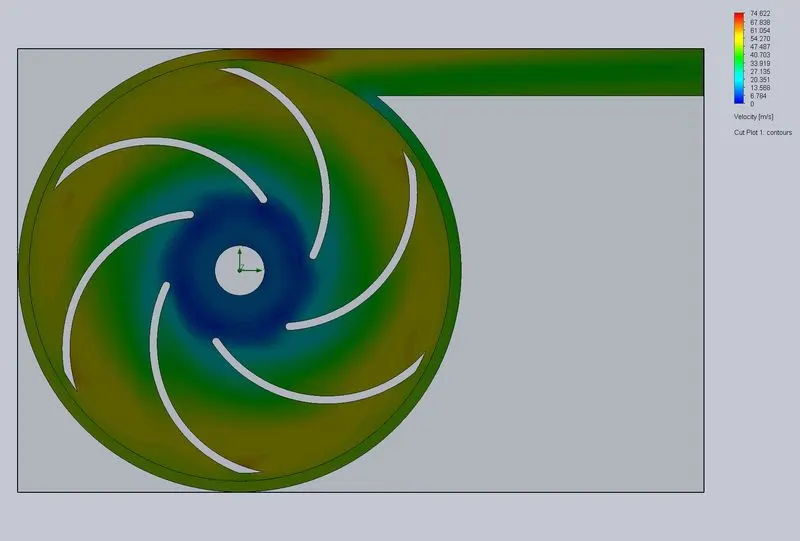
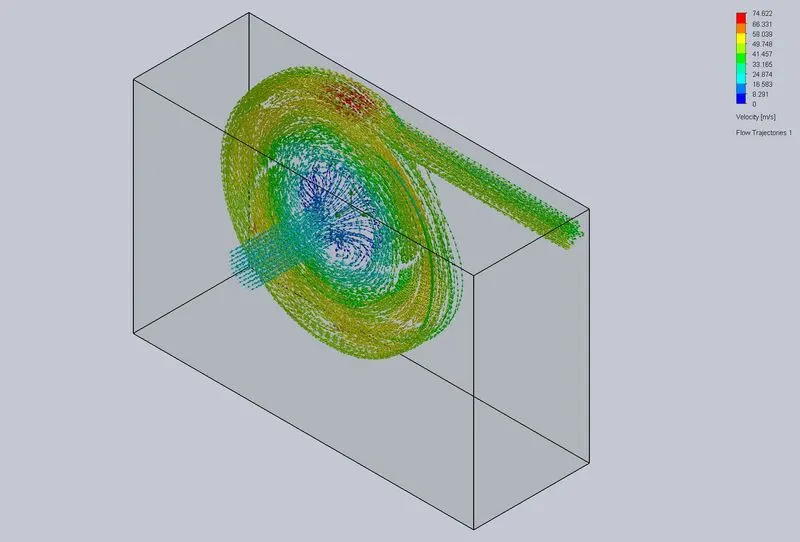
- For Outlet Velocity=40m/s
Velocity plot
Flow trajectory plot
- For Outlet Velocity=50m/s
Velocity plot
Flow trajectory plot
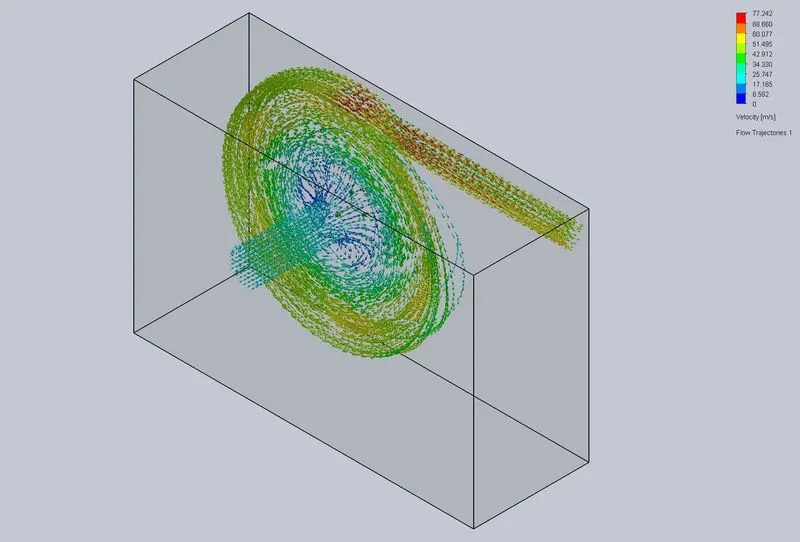
From the above plots it can be observed that it increases in outlet velocity as it was defined in input variable for the parametric study.
|
Goal |
Design Point 1 |
Design Point 2 |
Design Point 3 |
Design Point 4 |
Design Point 5 |
|
Outlet Velocity [m/s] |
10 |
20 |
30 |
40 |
50 |
|
SG Average Total Pressure outlet [Pa] |
2705867.563 |
2386746.339 |
1989082.668 |
1696067.921 |
1145677.301 |
|
SG Average Total Pressure inlet [Pa] |
101325 |
101325 |
101325 |
101325 |
101325 |
|
SG Mass Flow Rate [kg/s] |
1.71194128 |
3.423977058 |
5.135760429 |
6.848098582 |
8.558395733 |
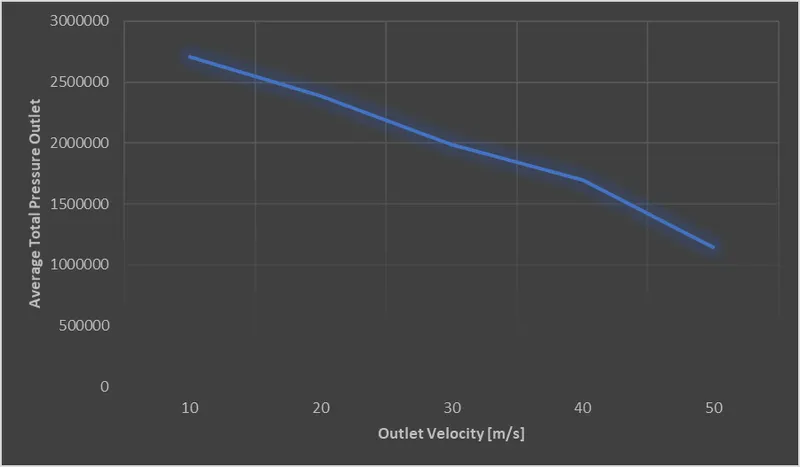
Outlet Pressure:
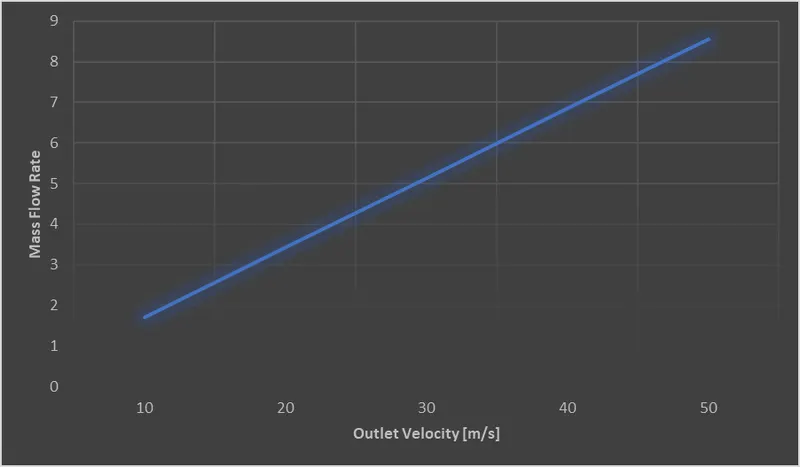
Mass Flow Rate:
Pressure Ratios at Velocities [ in m/s]
10. 2705867.563/101325=26.70484
20. 2386746.339/101325=23.55535
30. 1989082.668/101325=19.63072
40. 1696067.921/101325=16.73889
50. 1145677.301/101325=11.30696
As observed in above plots and the graphs, it can be observed that as the velocity increases, the pressure decreases and also the mass flow increases with the increase in the velocity.
Conclusion
The concept of a designing a centrifugal pump and flow through a pump simulation has been properly implemented using the SolidWorks by creating a centrifugal pump model & creating a rotating region for the impeller and doing simulation. And creating a parametric study on effect of different outlet velocity, which results that increase in outlet velocity, decreases the pressure and increases the mass flow rate.