Modelling and simulation of flow through a flowbench
OBJECTIVE
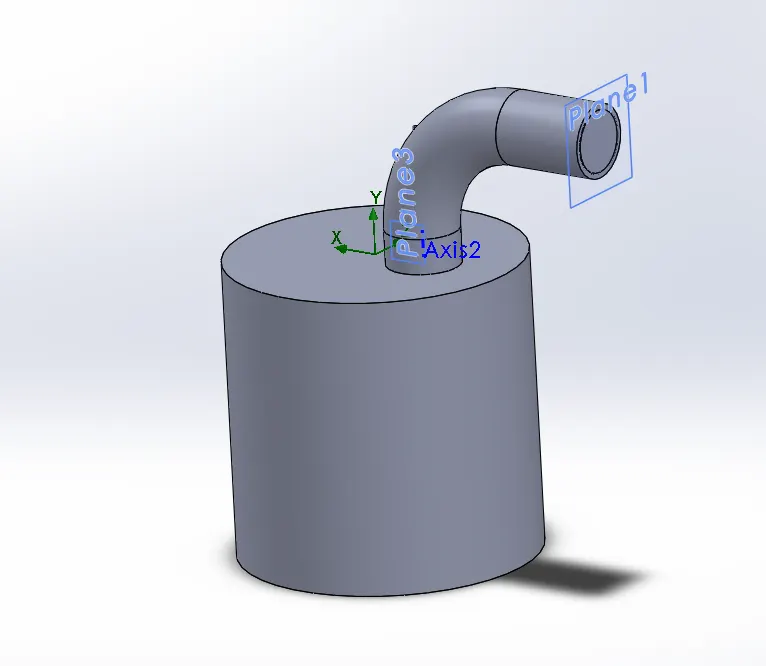
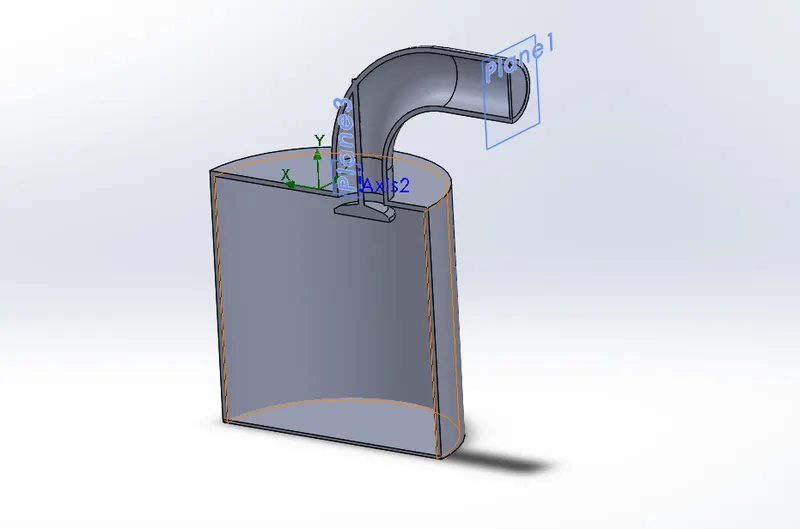
- Create a 3D Model of the flowbench and to run the CFD flow simulation for the intake port
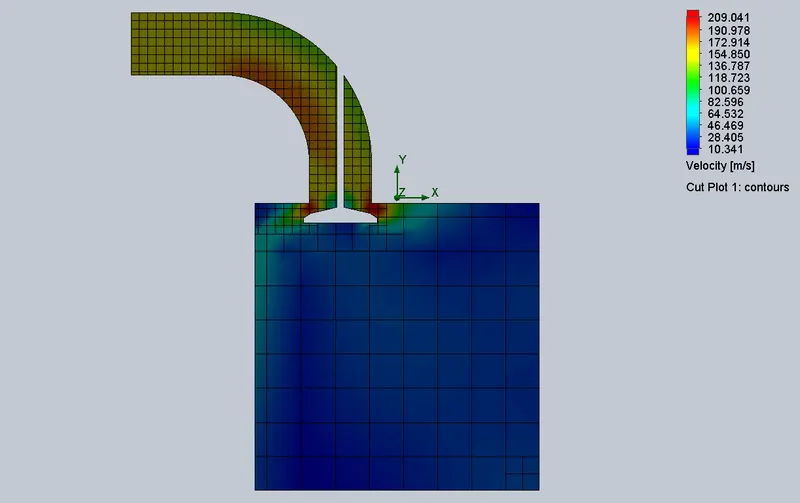
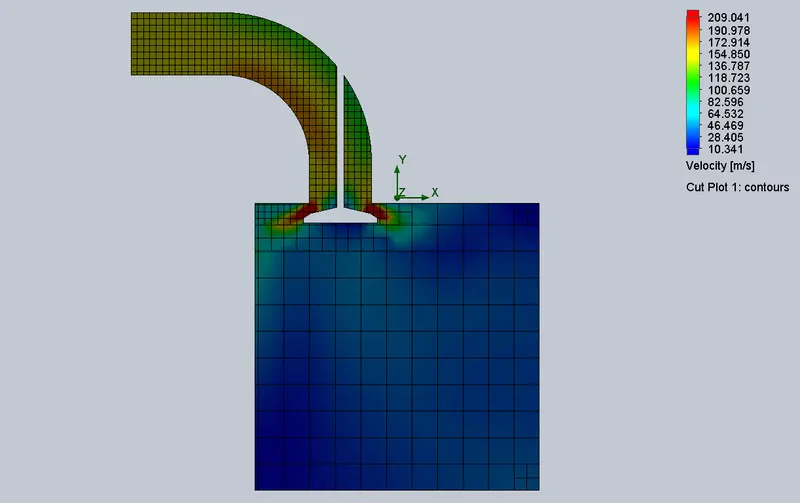
- Perform a Grid dependency test for a particular valve lift
- Perform a parametric study to determine the effect on the mass flow rate with different valve lifts
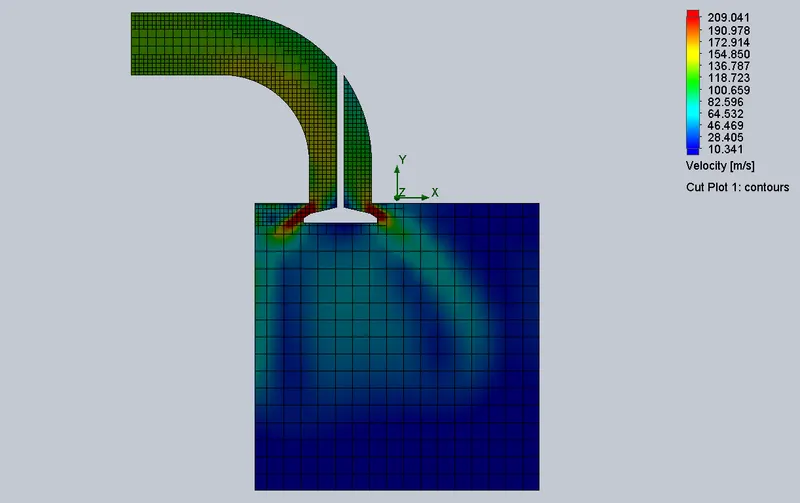
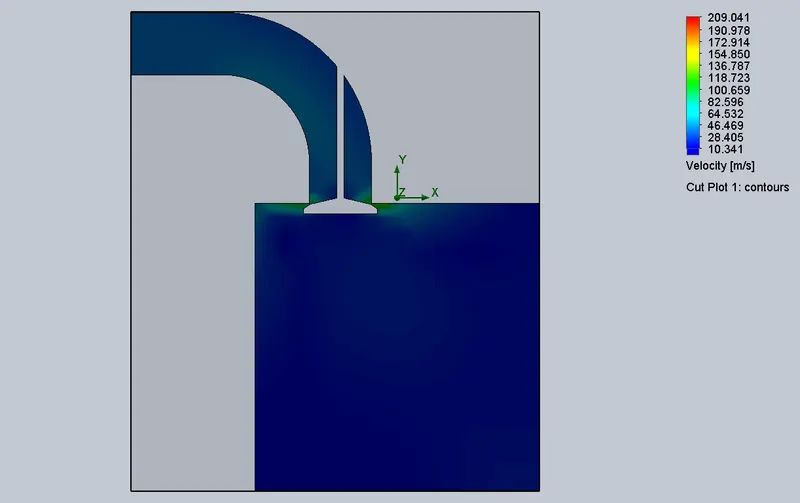
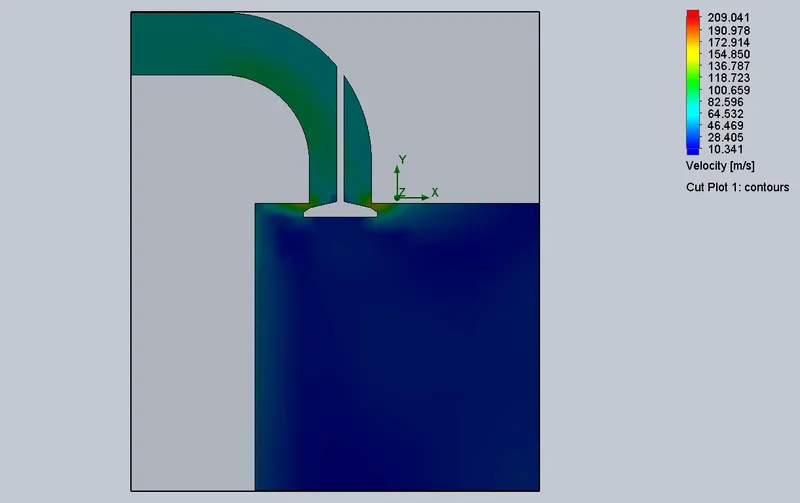
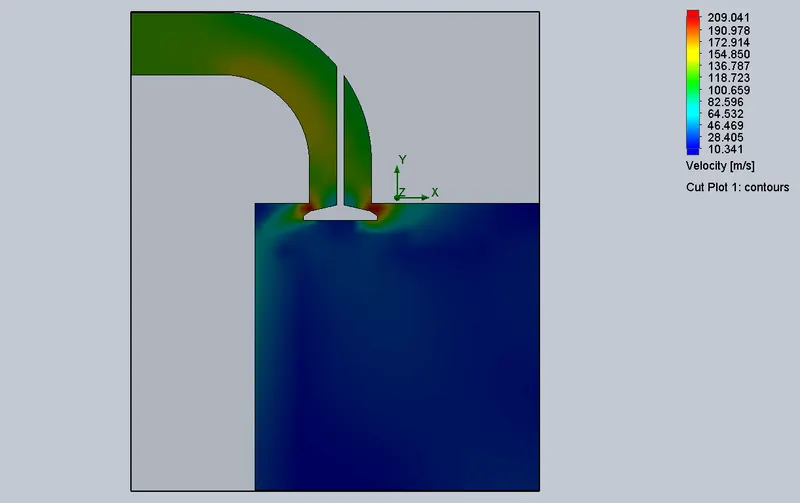
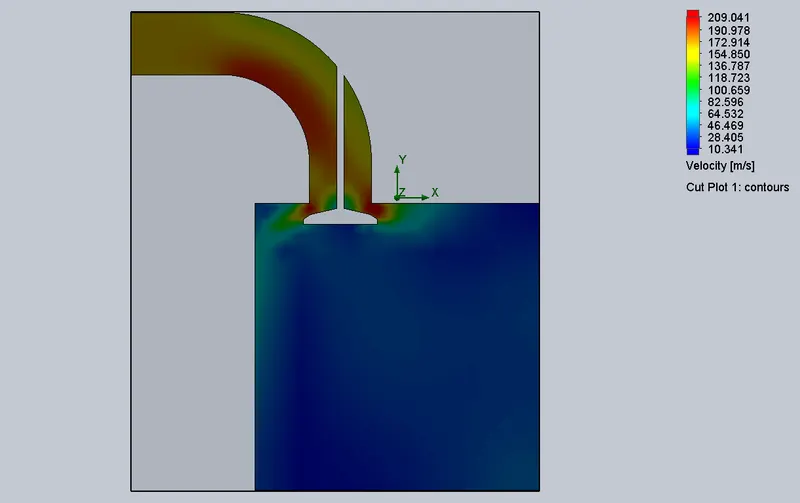
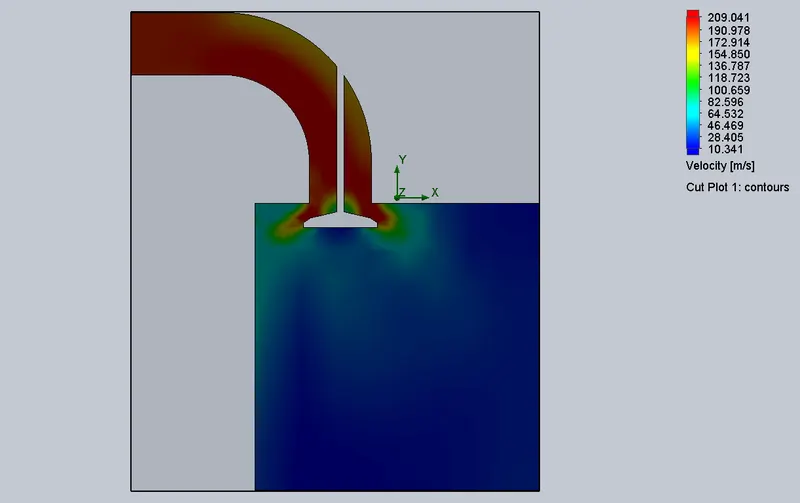
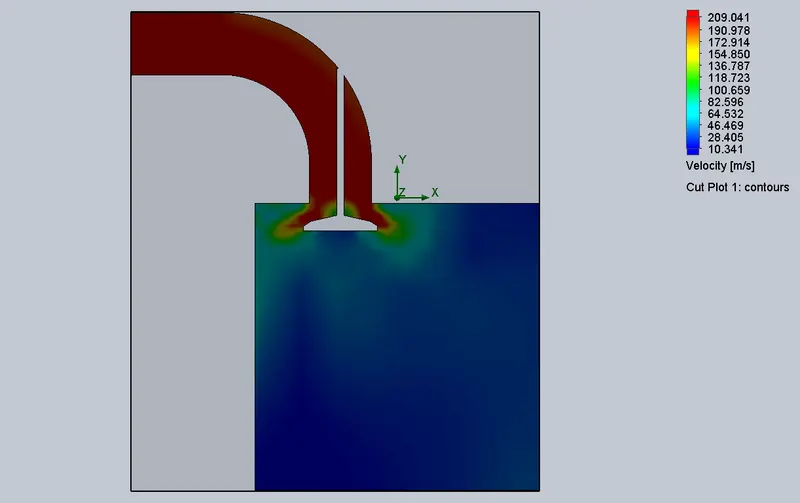
- Plot velocity cutplot for different valve lifts.
THEORY
- Flow bench
An airflow bench is a device used for testing the internal aerodynamic qualities of an engine component and is related to the more familiar wind tunnel. It is used primarily for testing the intake and exhaust ports of cylinder heads of internal combustion engines. It is also used to test the flow capabilities of any component such as air filters, carburetors, manifolds, or any other part that is required to flow gas. A flow bench is one of the primary tools of high-performance engine builders, and porting cylinder heads would be strictly hit or miss without it.
A flow bench consists of an air pump of some sort, a metering element, pressure and temperature measuring instruments such as manometers, and various controls. The test piece is attached in series with the pump and measuring element and air is pumped through the whole system. Therefore, all the air passing through the metering element also passes through the test piece. Because the volume flow rate through the metering element is known and the flow through the test piece is the same, it is also known. The mass flow rate can be calculated using the known pressure and temperature data to calculate air densities and multiplying by the volume flow rate.
PROCEDURE
- Geometry creation as per the dimensions given
1.Simulation Setup
- Analysis Type - Internal
- Steady-state analysis
- Type of Fluids - Air
- Flow Type - Laminar and Turbulent.
- Boundary condition at inlet - Total pressure (202650 bar)
- Boundary condition at outlet - Static pressure
- Goals - SG mass flow rate
- Adding flow trajectory
- Cutplot - velocity
2.Parametric Study for grid dependancy test
- New parametric study
- Simulation parameter - Level of initial mesh (3,4,5)
- Output parameter - Cutplot
- Run
3.Parametric study for different valve lift
- New parametric study
- Dimension parameter - Select the driving dimension (valve lift)
- Create 7 different cases for dimension parameters by using discrete values option. Set starting value as 0.001mm and set ending value as 0.008mm.
- Output parameter - Cutplot, Goal and Flow trajectory
- Run
3D MODEL OF THE GEOMETRY
RESULTS
1.Parametric Study for grid dependancy test
- Level of initial mesh = 3
- Level of initial mesh = 4
- Level of initial mesh = 5
2.Parametric study for different valve lift
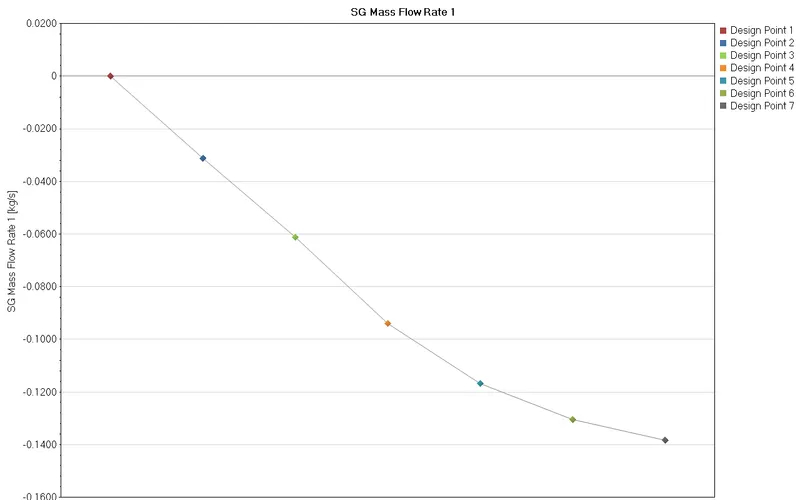
3.Plot - Massflow rate vs different valve lifts
CONCLUSION
- From the Velocity cutplots we can observe that there is an increase in the velocity when the fluid reaches the valve lip region since the area across which the fluid is required to pass reduces, and also as the valve lift increases the velocity also increases.
- From the Pressure cut plot of the first case, we can observe that there is not much significant pressure drop across the valve and hence our valve design is good since the significant pressure drop causes an increase in the pumping cost.
- From the mass flow rate at the outlet plot, we can observe that the mass flow rate increases almost linearly as the valve lift increases, because from the equation, the density is constant and the velocity at the inlet is also constant, and from Area, the diameter of the port is constant the only thing changing is the valve lift so the mass flow rate varies linearly with valve lift.
- The plot of mass flow rate at the outlet is very important since it is going to tell us how much amount of air is going inside the system, which affects the Air-fuel Ratio and compression rate, and we use all this information to tune in our engine correctly so that correct amount of valve lift gives us the required amount of the fuel inside the engine in order to get the correct of air-fuel mixture.