Modelling and simulation of flow through a flowbench
Aim :
To
- Create a 3D model of a flow bench, run a flow analysis and obtain a plot of lift vs mass flow rate.
- Conduct a Grid dependence test at a particular valve lift and explain the results.
- To run a parametric sweep to show the effect of valve lift on mass flow rate, once the best grid has been decided.
Modelling :
A 3D flowbench was modelled using the Solidworks, consisting of an intake port, intake valve and cylinder. This flowbench was used to conduct a flow simulation analysis to understand the effect of valve lift on Mass flow rate. This kind of analysis play a vital role in IC engine design, to understand and improve volumetric efficiency and engine performance.
The following is the Cut section view of the flowbench modelled to carry out the flow simulation,
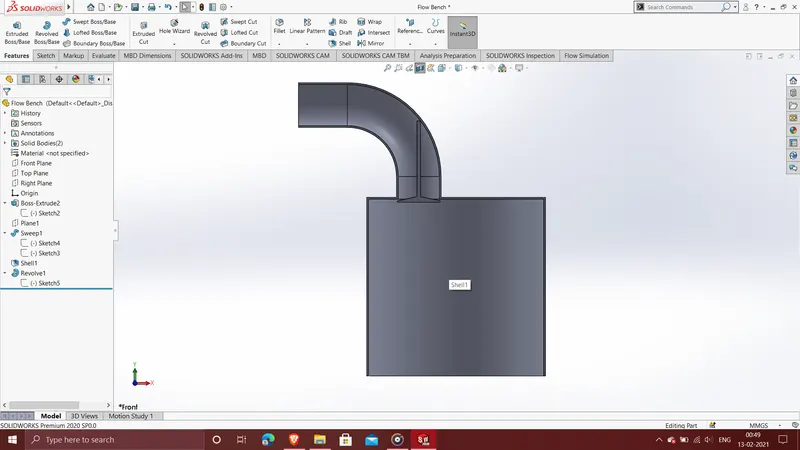
The cylinder has a length of 100mm and bore diameter of 50mm. The intake port has a diameter of 12.5mm.
Simulations and Results :
This analysis involves finding the most suitable mesh size to obtain accurate results before actually conduction the main flow analysis itself.
Determining the best mesh size for the simulation involves performing a grid dependency test.
Grid Dependency Test
For this purpose we analyse the results of a set of simulations wherein all other parameters other than the mesh size is kept constant in all cases,
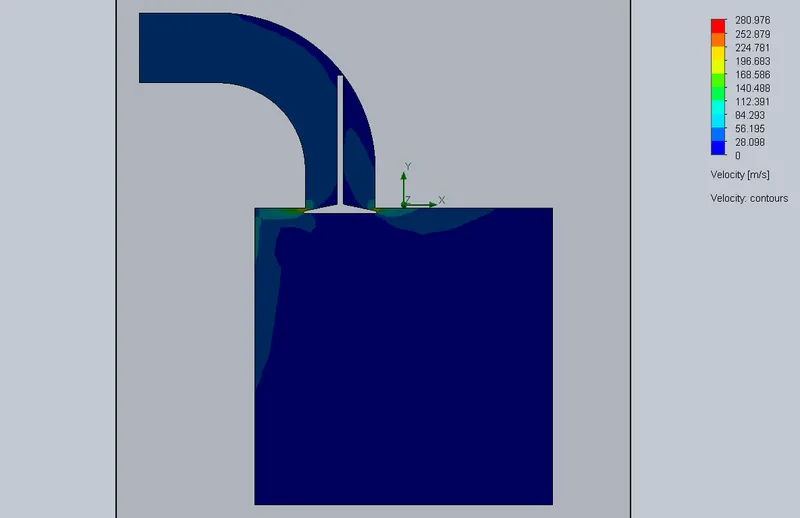
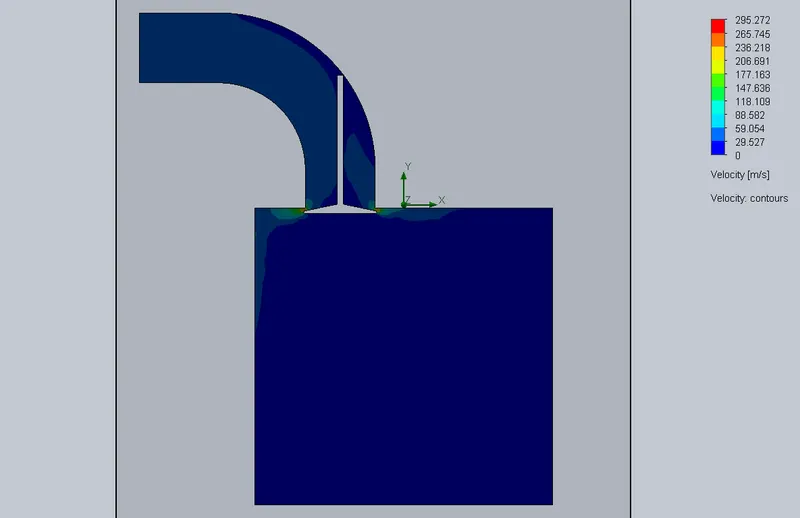
In our case, we set the valve lift to 1mm while varying the mesh size levels between 3,4 and 5.
The results of velocity and pressure are given below,
For Mesh Level 3
Velocity Plot
Pressure Plot
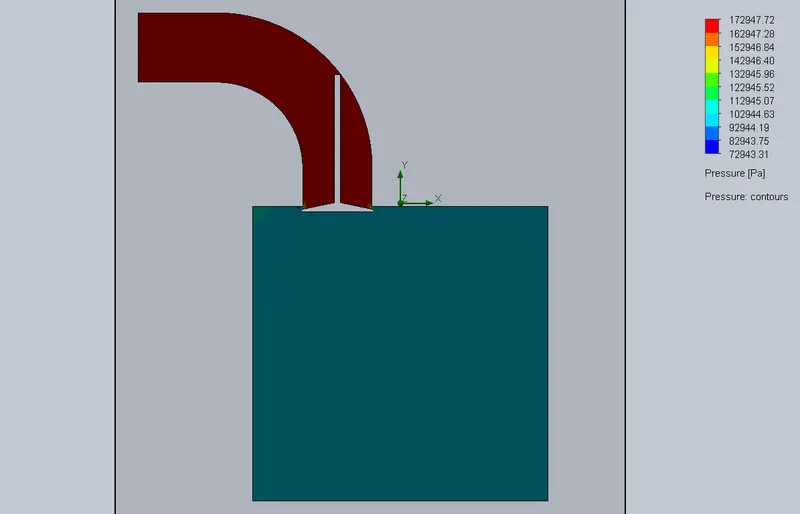
Mass Flow rate = 0.0289 Kg/s
For Mesh Level 4
Velocity Plot
Pressure Plot
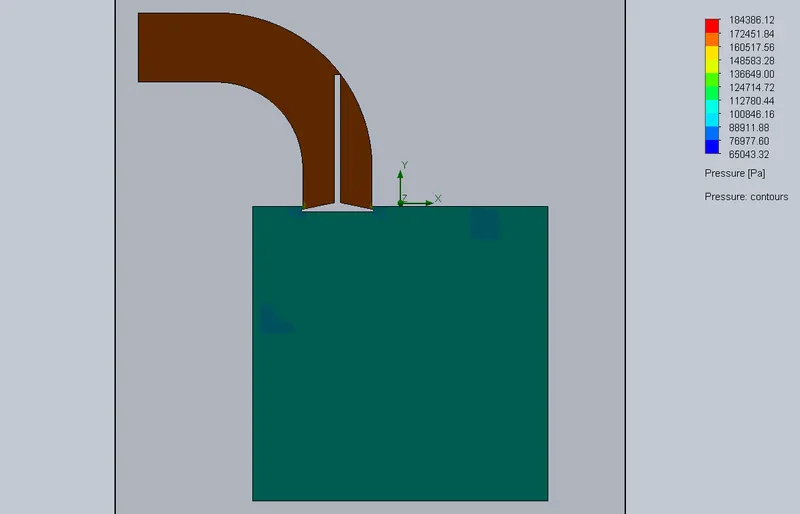
Mass flow rate = 0.0304 Kg/s
For Mesh Level 5
Velocity Plot
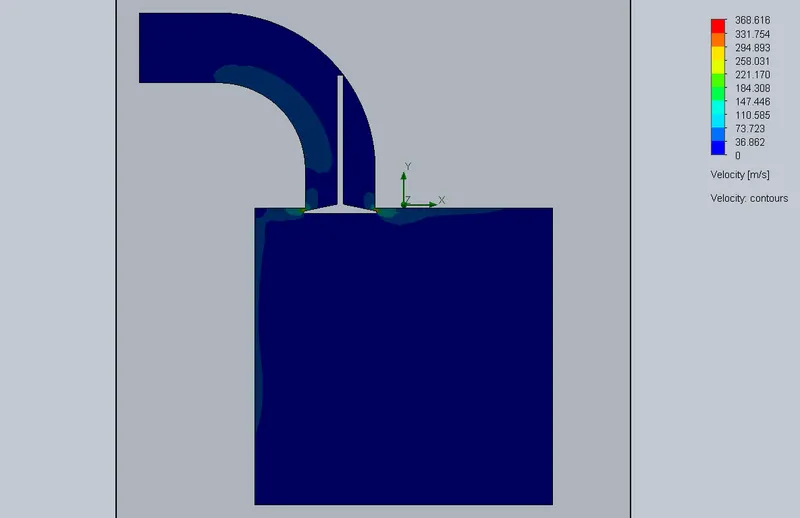
Pressure Plot
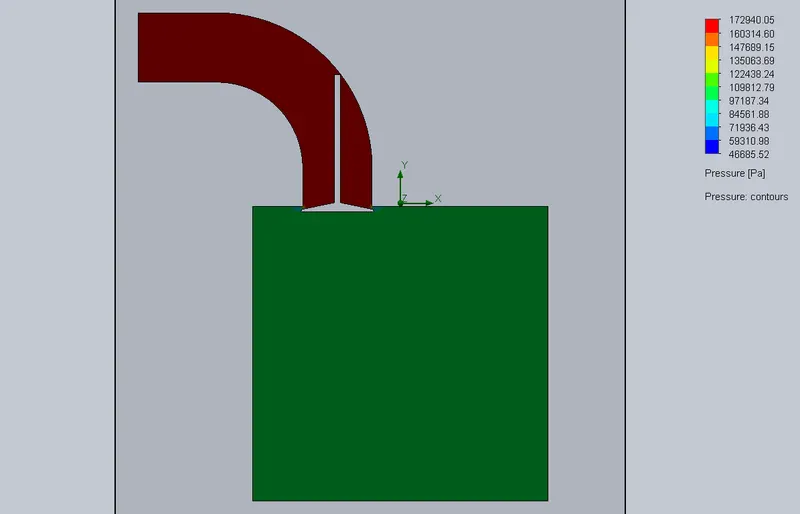
Mass flow rate = 0.0281 Kg/s
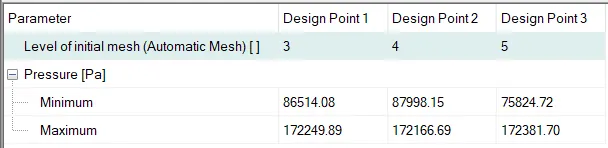
Summary of the Grid Dependency Tests
Velocity
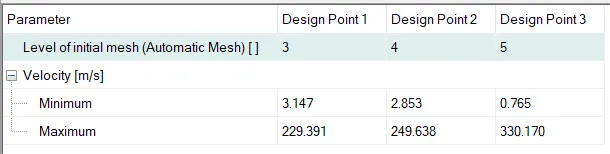
Pressure
Mass Flow Rate

From all of the above data, we can see that the results tend to converge to a better solution as the mesh size increases, because as the mesh size increases, the number of data points also increases thereby increasing data accuracy.
Hence a Mesh level of 5 is chosen for carrying out the rest of the simulation.
Paramatric Study to find the effect of Valve Lift on Mass Flow rate
The purpose of the study is to find out how the Mass Flow rate varies with respect to the valve lift.
This simulation is carried at a Global Mesh level of 5 with a local mesh at the surface of the valve.
The boundary conditions are
Inlet Total Pressure of 172369 Pa at 273.2 K
Outlet Static Pressure of 101325 Pa at 273.2 K
The valve lift was varied between 1mm and 5mm in steps of 1mm between each simulation.
The results of the simulation are as follows,
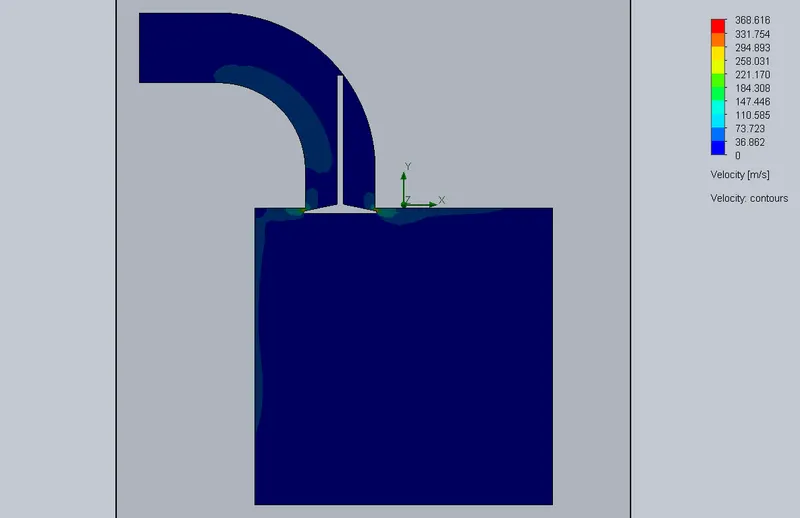
Valve lift 1mm
Velocity Plot
Pressure Plot
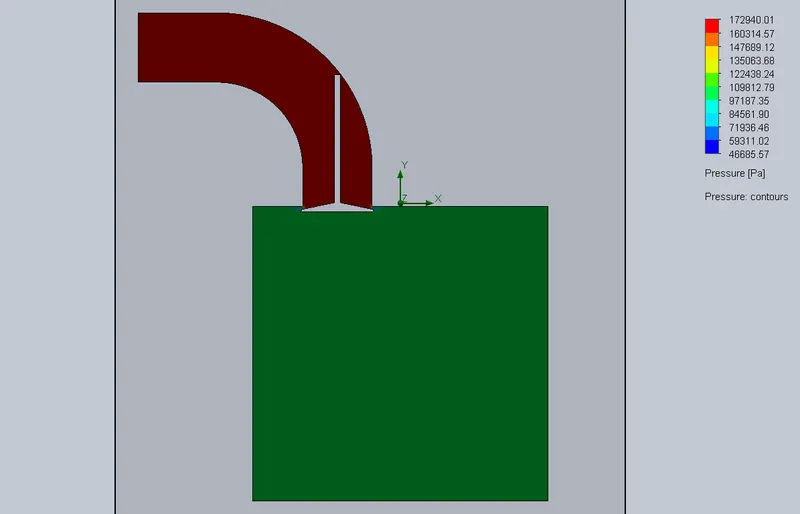
Mass Flow rate = 0.0281 kg/s
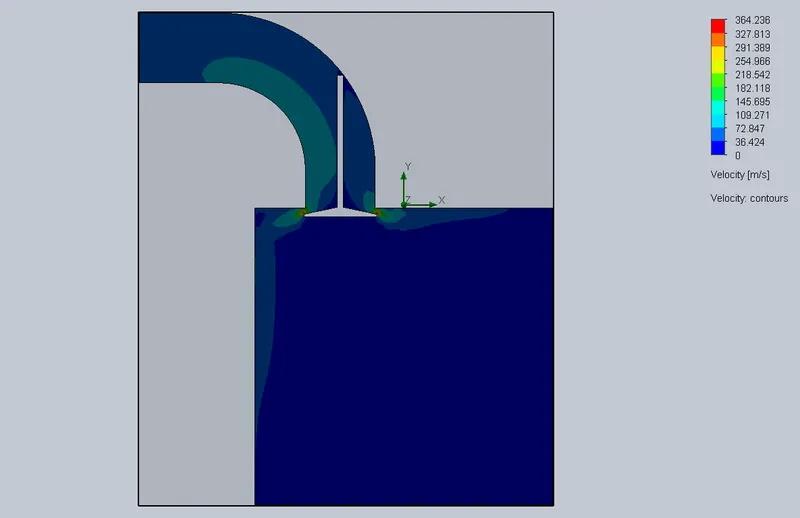
Valve Lift 2mm
Velocity
Pressure
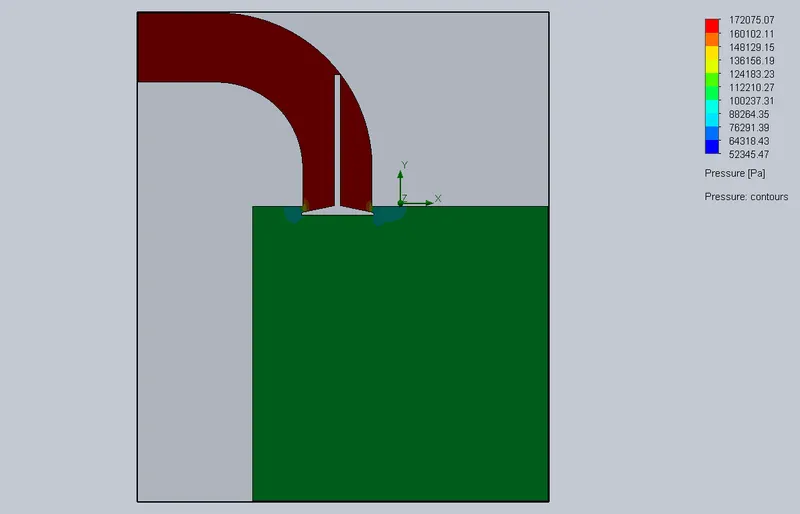
Mass Flow rate = 0.0570 Kg/s
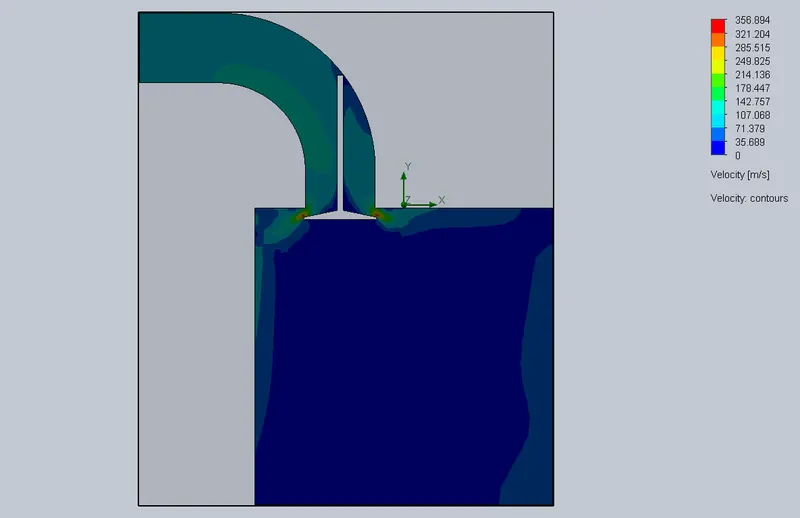
Valve Lift 3mm
Velocity
Pressure
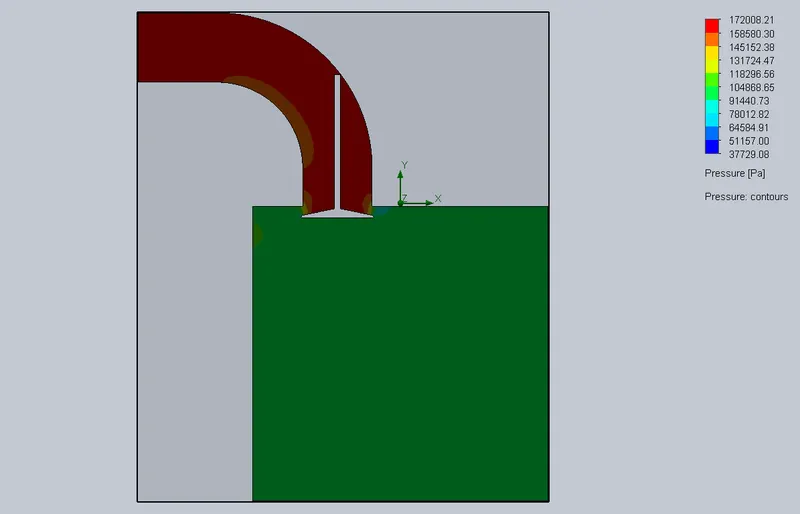
Mass Flow rate = 0.0775 Kg/s
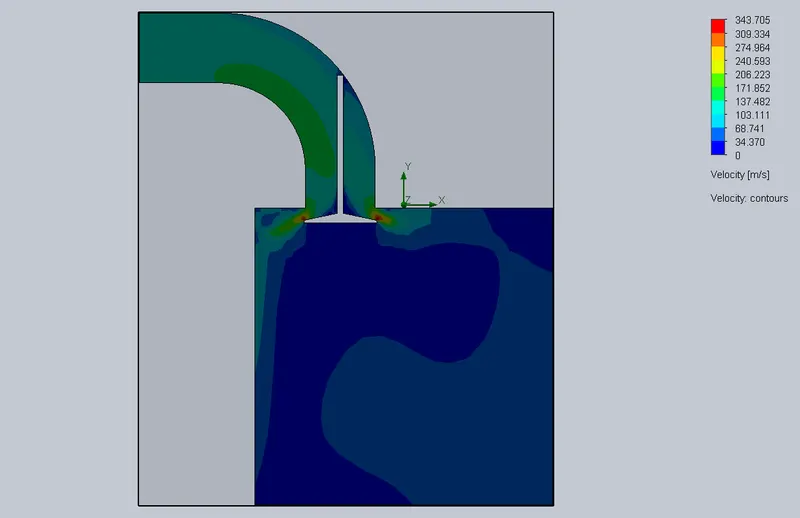
Valve Lift 4mm
Velocity
Pressure
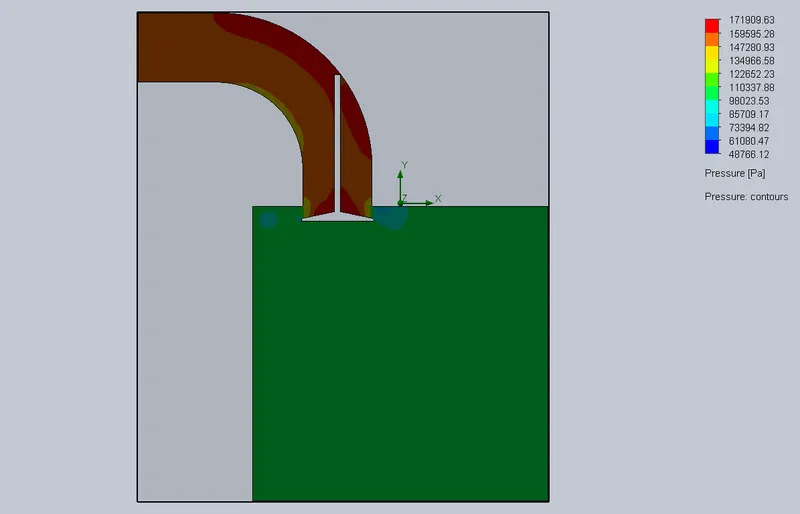
Mass Flow rate = 0.0963 Kg/s
Valve Lift 5mm
Velocity
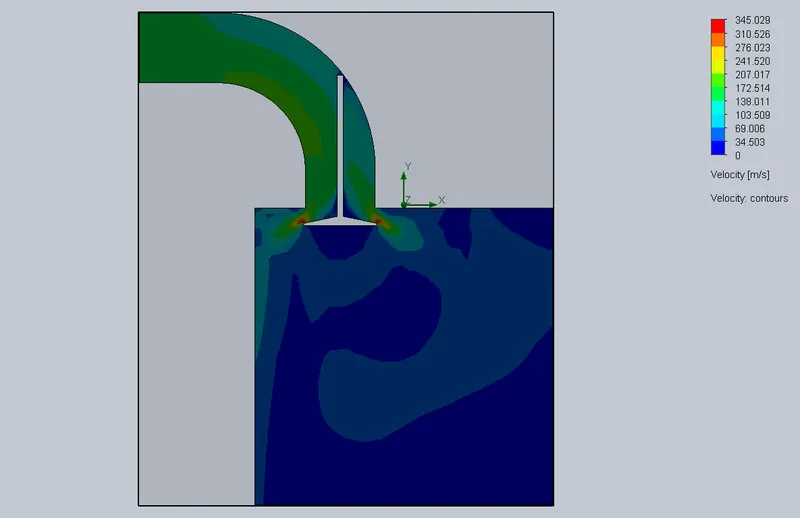
Pressure
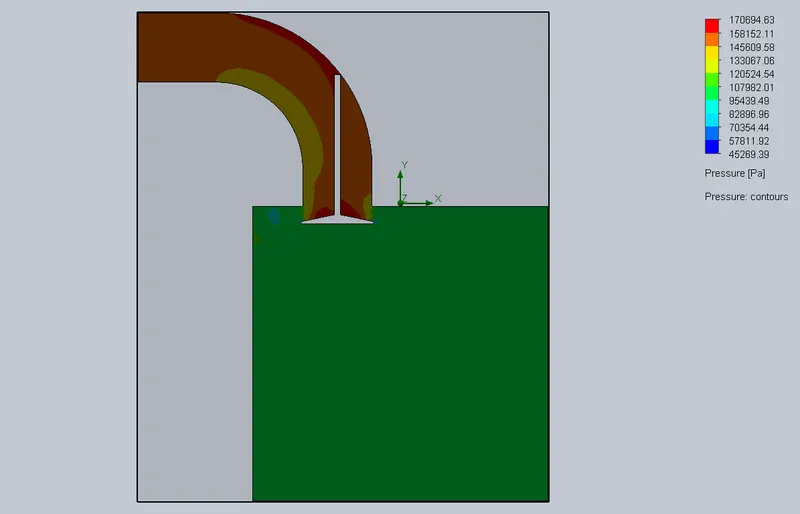
Mass Flow rate = 0.1093 Kg/s
Variation of Mass Flow rate with Valve Lift (Table)

Variation of Mass Flow rate with Valve Lift (Graph)
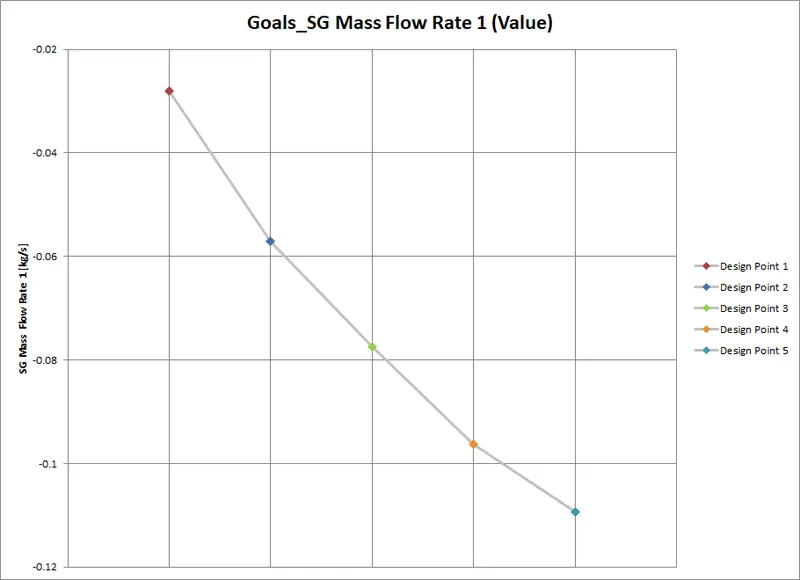
The above values are in negative because the Air is flowing out of the domain.
Conclusions :
1. As is clear from the plots and table, the mass flow rate increases with increase in valve lift. The larger opening allows for more air to enter into the cylinder volume. However, an interesting point to note is that as the valve lift increases, the rate of change of mass flow rate decreases gradually. This is due to the fact that as the valve lift increases, the presssure drop or pressure difference between inlet and outlet keeps reducing, till it reaches a point where there will be no more flow of air into the cylinder i.e when Inlet pressure = Outlet pressure.
2. As the valve lift increases, the peak velocity and peak pressure reduces of the air stream entering the cylinder reduces gradually.