Modelling and simulation of flow through a flowbench
Aim:
To create a 3D model of Flowbench in Solidworks.( In this project the helical intake port is modeled)
To perform Grid dependency test for three grids at a particular lift value.
To create a Parametric study of Flowbench simulation at different lift values and obtain a lift vs mass flow rate plot.
Theory:
FlowBench:
An air flow bench is a device used to test aerodynamic features of engine components similar to a wind tunnel. Primarily used for testing the intake and exhaust ports of cylinder heads of IC Engine.
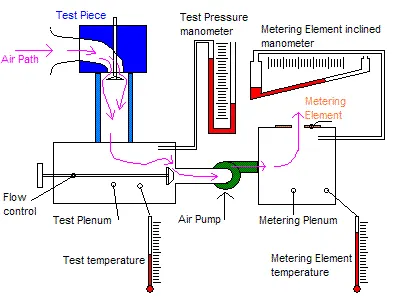
As in the above figure, it consists of an air pump,a metering element, pressure and temperature measuring instruments like manometers and other. Test piece (i.e intake port or other engine component) is attached in series with the pump and measuring elements. Air is pumped through the whole system. As volume flow rate is known through the metering element, it remains same through the intake port. The mass flow rate can be calculated using the known pressure and temperature data.
The mass flow rate can be analysed for different positions of lift valve . Flow bench tests are normally conducted at 10 to 28 inches of water equivalent to 2.5 to 7 kPa of pressure differences. However a real engine has 90 inches of water equivalent to 47kPa of pressure difference.
Similarly a CFD simulation of a Flowbench geometry can be performed to study more of flow characteristics of engine component here of intake port. This might save us the efforts of an actual flowbench. Simulation can help us study aerodynamic characteristics, flow data , dynamic properties like velocity ,pressure, mass flow rate , etc as well thermodynamic features of the component for different valve positions.
Swirl in Engine:
Swirl motion in engine is defined as the rotation of charge(Air) around the axis of the cylinder. The charge rotates concentrically around the cylinder axis. Swirl is used to increase efficiency, reduce noise and other pollutants and improve combustion stability. It not only affects the fuel-air mixing and combustion process but also significantly affects heat transfer and engine raw emissions.
Swirl is mostly used in Diesel Engine as Air is first taken in and later the fuel and mixing takes place in the cylinder itself so for a better mixing Swirl is important. Swirl action creates turbulence which helps in better mixing the Air and Fuel. This also reduces Engine knocking.
There are two ways to create Swirl by valve design and intake design. If the inlet flow enters the cylinder with initial angular momentum then it will create a swirl.
To set the air in rotation before entering the cylinder helical port is utilised. The helical intake port forces the air to flow around the valve stem so that the air enters the cylinder with initial angular momentum.
Methodology:
First we have to create a 3d model of Flowbench i.e Cylinder with a helical intake port.
Dimensions :
Cylinder bore diameter = 0.1 m =100 mm
Stroke = 0.1 m =100 mm
Helical Intake diameter = 0.015 m = 15mm
Intake Port diameter (cylinder housing inlet valve)=0.025m = 25mm
Thickness = 0.002m = 2mm
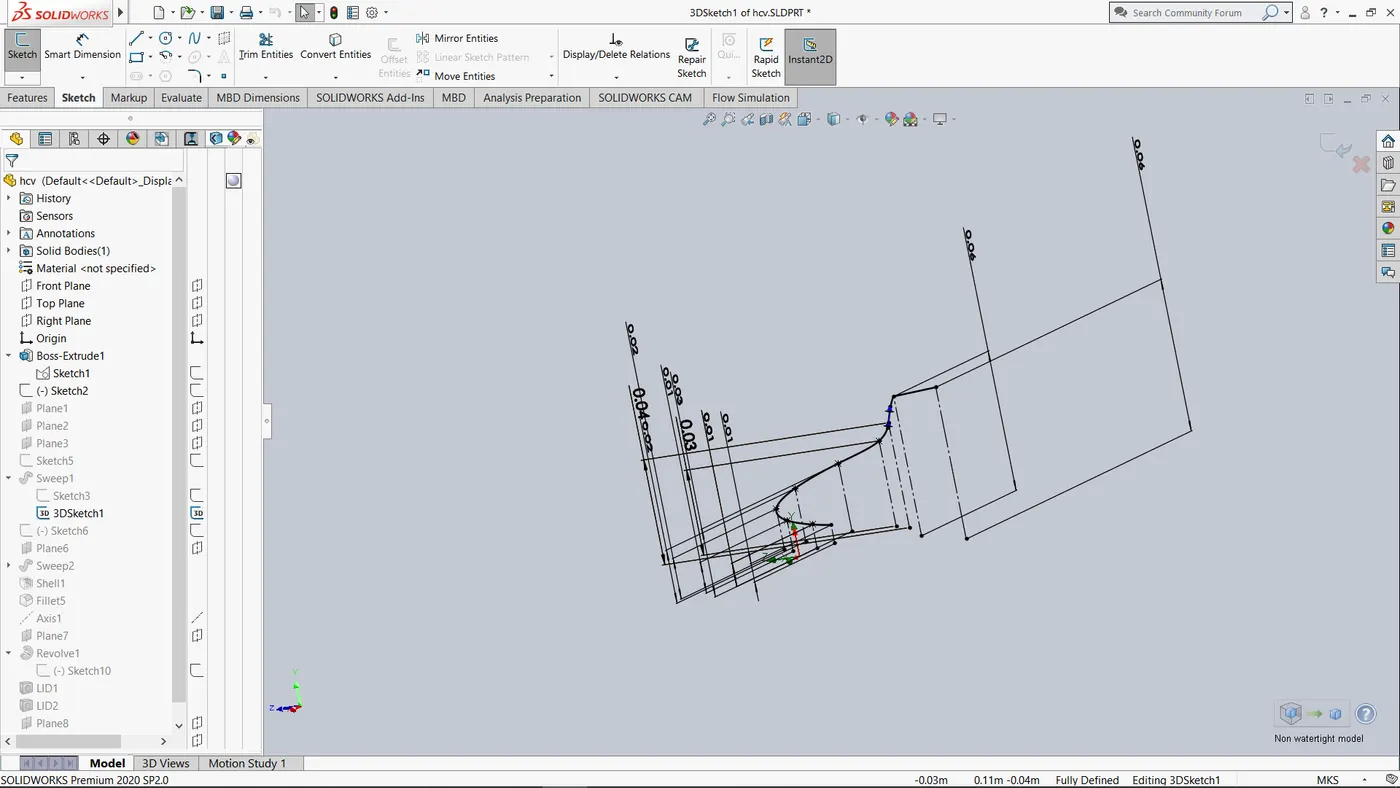
We will design the helical intake arbitrarily based on established design of Helical Intakes. Instead of a converging helical port the design is simple with uniform cross direction helical port to avoid complex designing. Sketches of Helical Port are provided.A 3d sketch is created of the helix. And then using the Sweep command Helical Port is created.
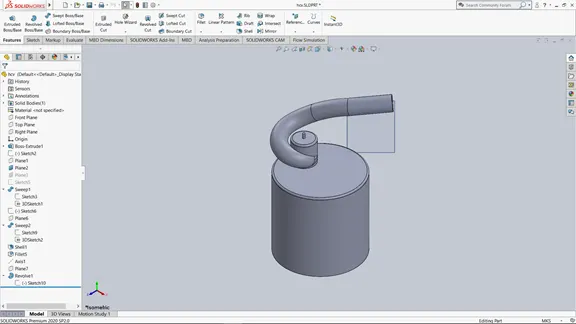
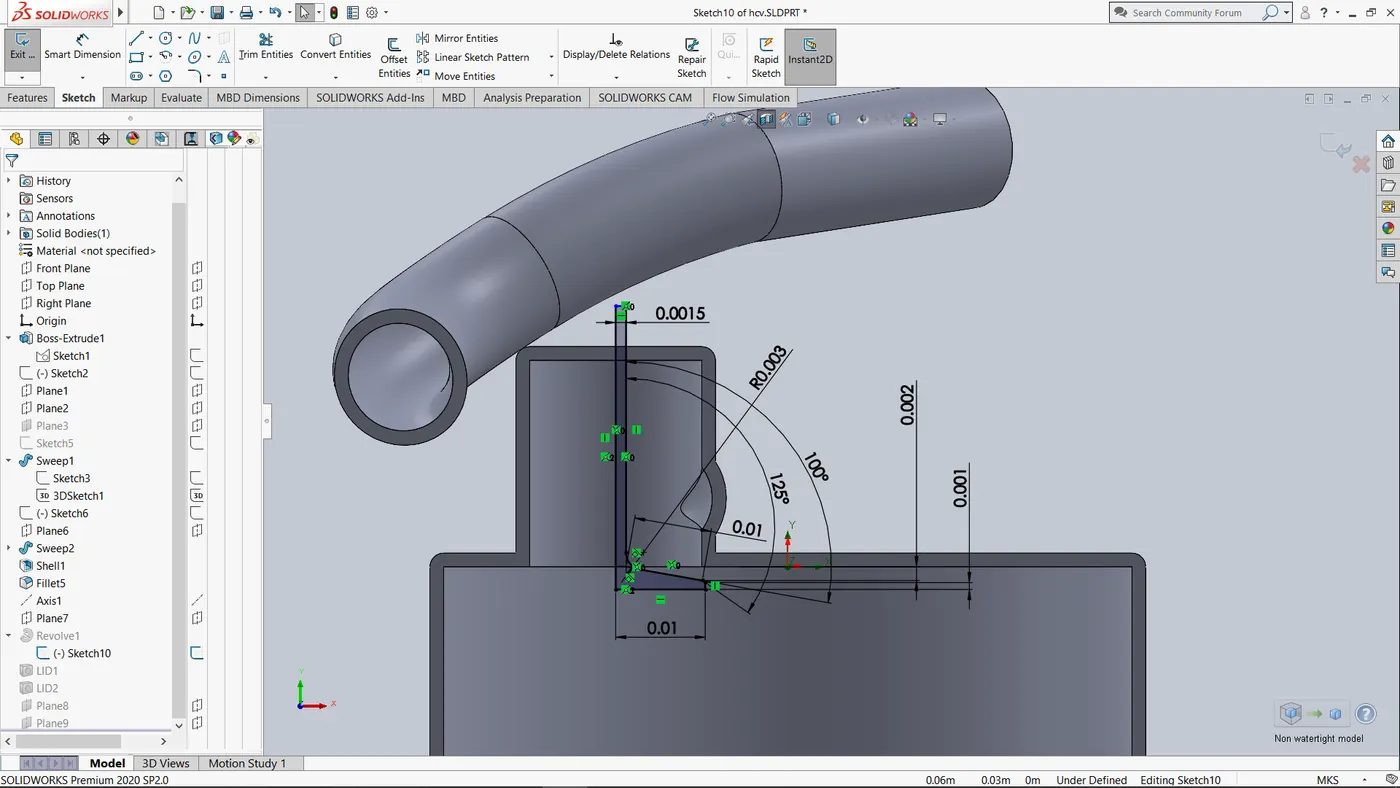
The inlet valve is designed such that the lift can be altered by changing a Dimension. The valve must close the intake port sufficiently.
Then in Flow Simulation toolbox the lids are created on inlet and exit of the model.
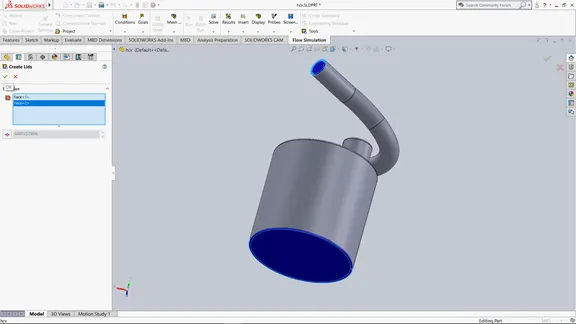
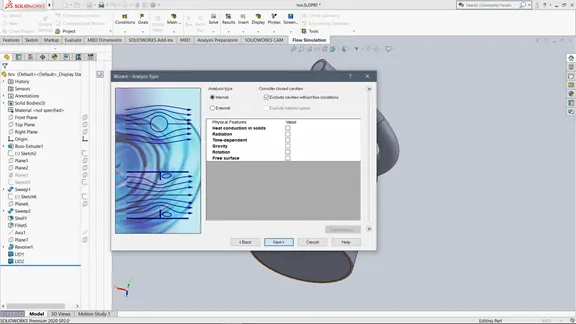
Then we will setup a baseline simulation for 2 mm lift of inlet valve. The analysis type is Internal Flow.
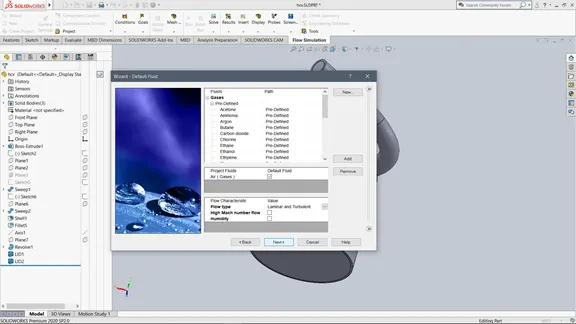
Default fluid is Air
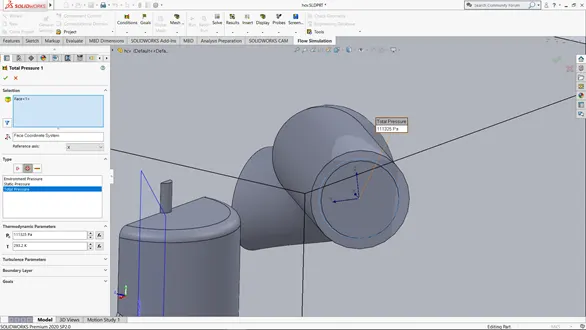
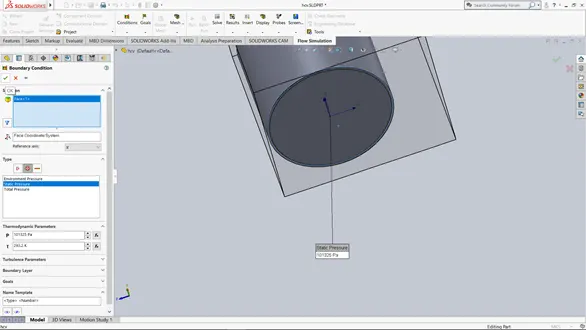
Then we will setup the intial boundary conditions as Total Inlet Pressure as 111325 Pa and Static Pressure at exit as 101325 Pa. The total pressure difference is of 10 KPa.
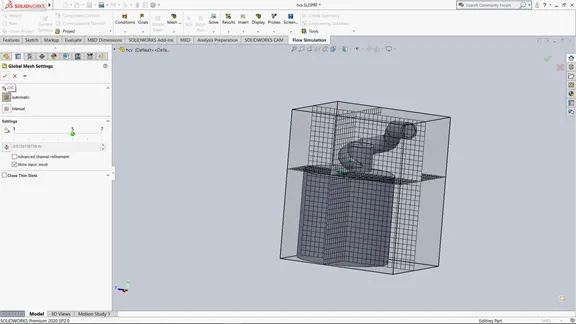
Then we will setup initial mesh as 5.
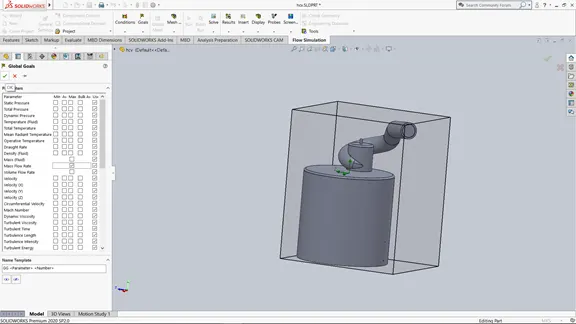
We will add Global Goal for Mass flow rate.
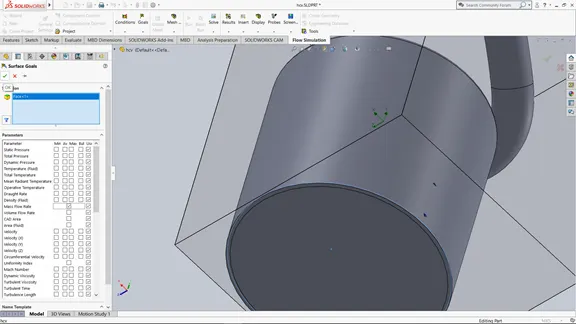
We will also add Surface Goal for Mass flow rate at exit.
Then we will setup Cut Plots for Pressure and Velocity.
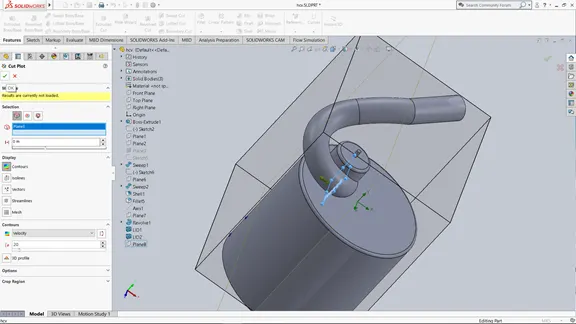
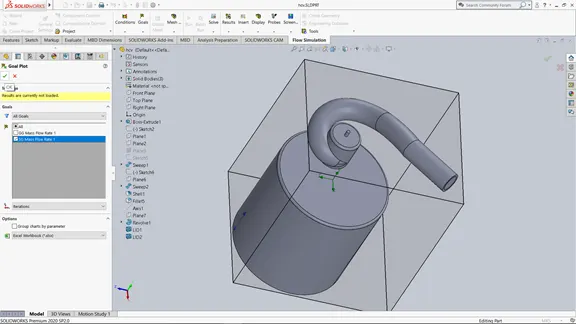
We will also add Goal Plot to plot Surface Mass flow rate.
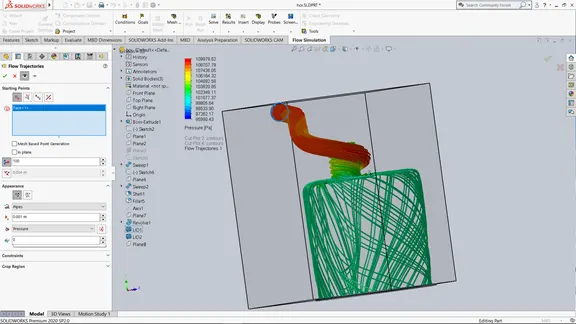
Then we will add Flow Trajectories by selecting the inner face on Lid at Inlet. We will adjust number of pipes accordingly.
Grid Dependency Test:
Now we will setup a Parametric study for the Grid Dependency Test at 2mm of Valve Lift.
Input Variable will be the Level of Initial mesh.
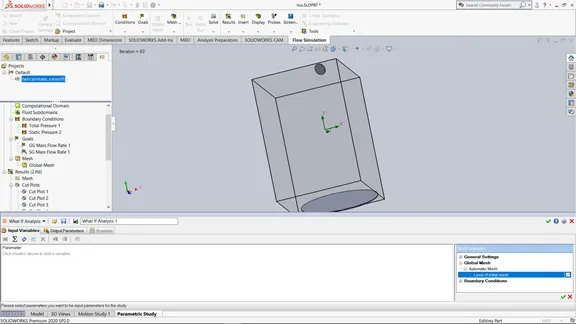
We will do Parametric study for 3 discrete values of Level of Initial mesh viz. 5,6 and 7.
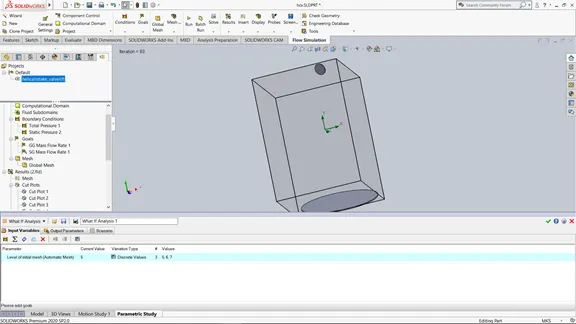
We will add all output Parameters to be observed especially the mass flow rate, velocities and pressure and run the simulation.
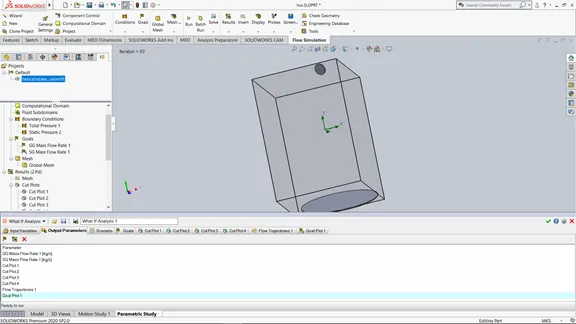
| Level of Initial Mesh | 5 | 6 | 7 |
| Max. Velocity m/s | 92.699 | 107.734 | 115.861 |
| Max. Pressure Pa | 109281.79 | 109186.13 | 109179.23 |
| Mass Flow Rate* kg/s | -0.0147 | -0.0152 | -0.0147 |
*Mass flow rate is negative as mass leaves the system .
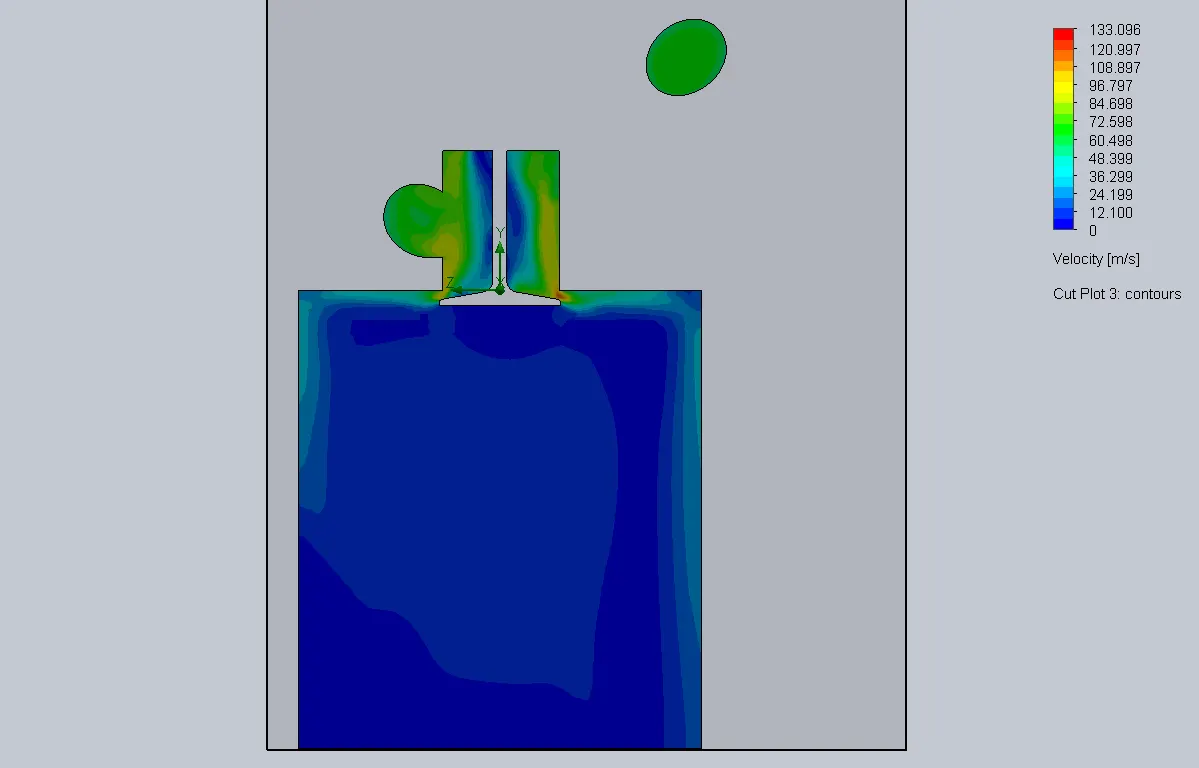
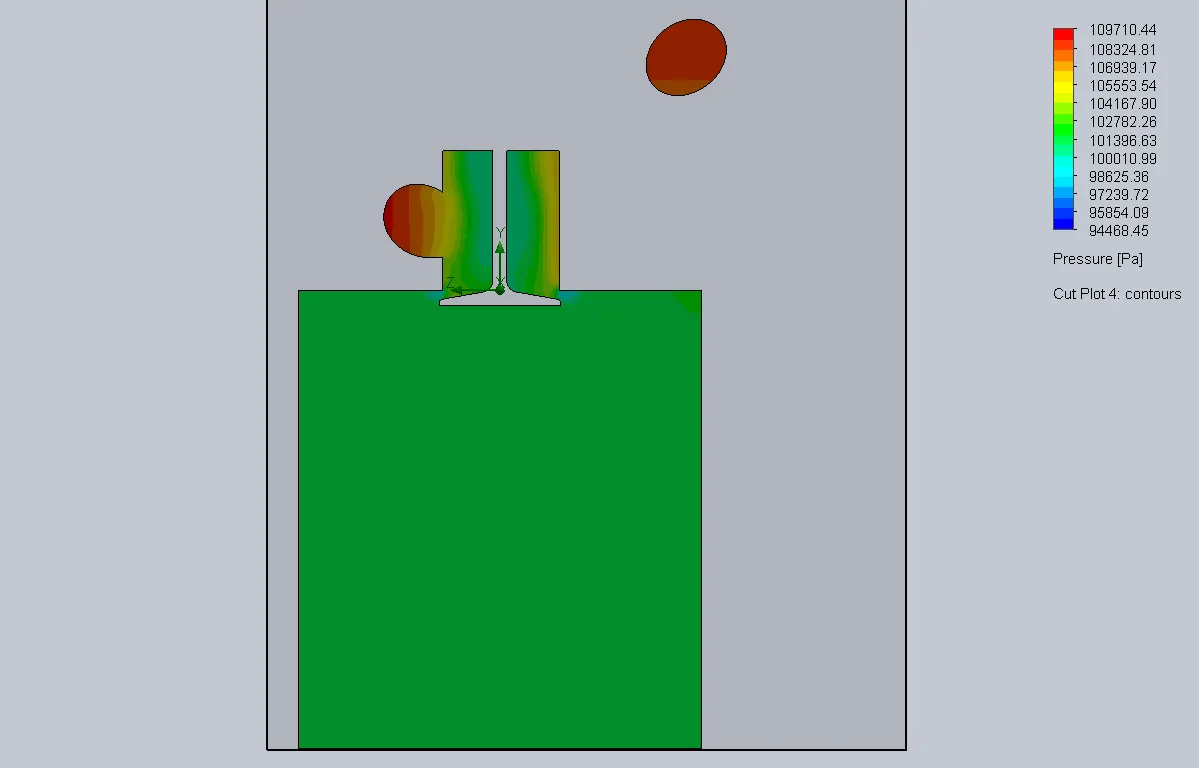
Observing the above table of values for different mesh levels we can see that the values are still changing and have not yet achieved a stable value. Also the mass flow rate decreased again at Design Point 3. So it's hard to select optimum mesh level from Mass flow rate values. However velocities show increasing trend as Level of Mesh is increased. Similarly the pressures show a decreasing trend. And the values differ less at Design point 3. As 7 is the highest level of initial mesh it can be selected as optimum Level of Mesh in this case.
So now the level of Initial mesh is to be set at 7 as per Grid Dependency Test.
Parametric Study for Valve Lift analysis:
Now we will perform a Parametric study for different values of Lift of Intake Valve.
In the Input Variable we will select the Dimension Parameter which controls the Lift of the intake valve.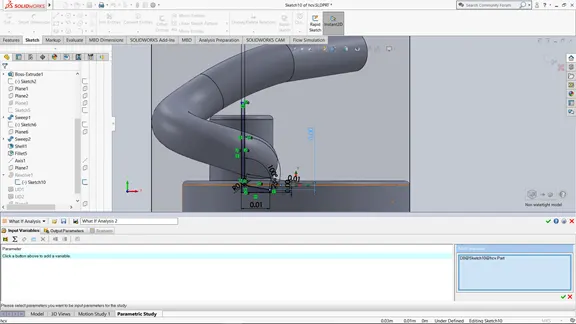
Then we will create values by Range with Number between 0 mm to 12 mm with 7 values. viz . 0, 0.002, 0.004 ,0.006 ,0.008, 0.01 and 0.012 in meters.
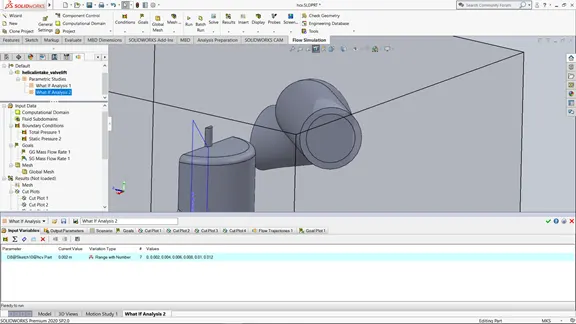
We will then set up output parameters and Run the simulation.
Results:
Grid Dependency Test:
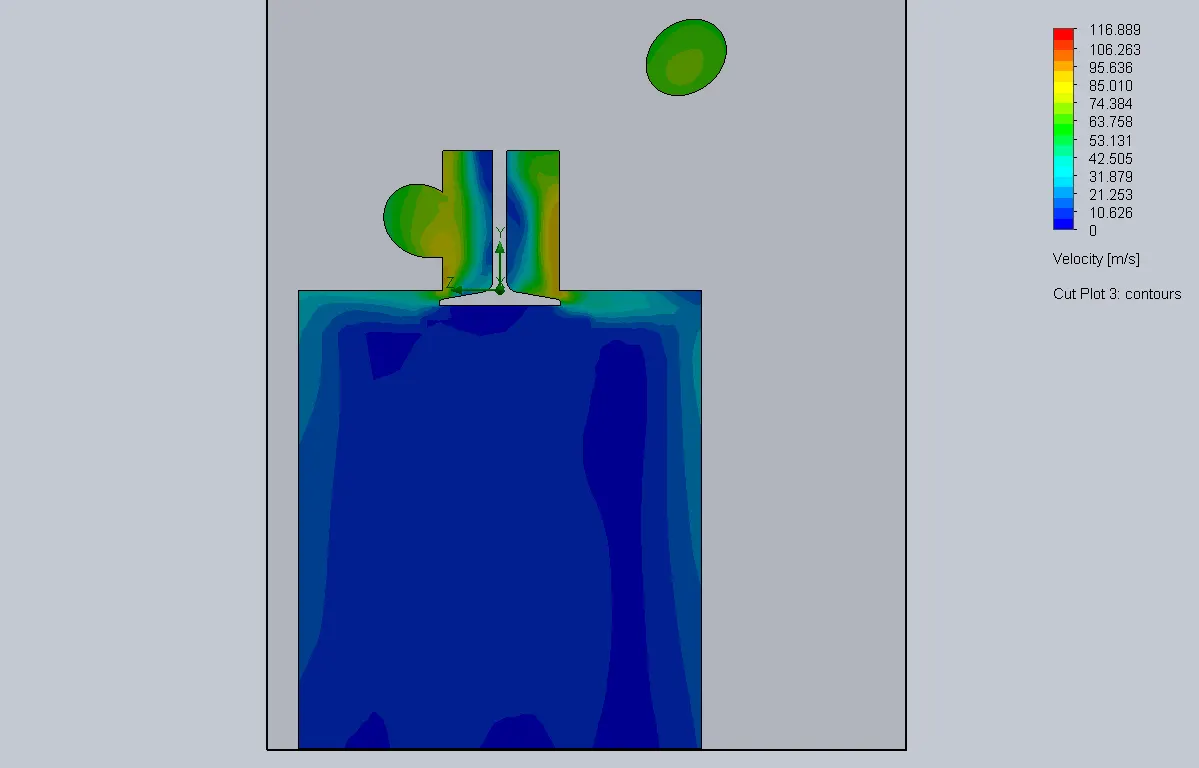
1)Level of Initial Mesh = 5
Velocity Cut Plot
Pressure Cut Plot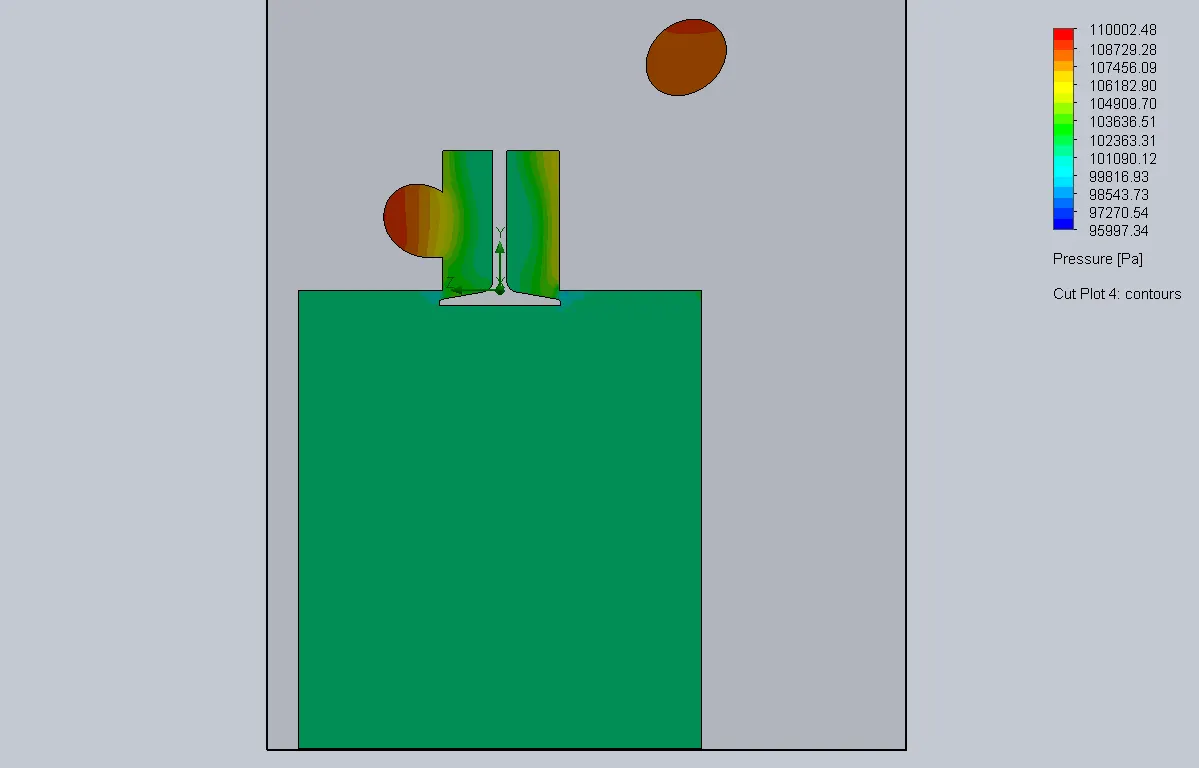
Flow Trajectories 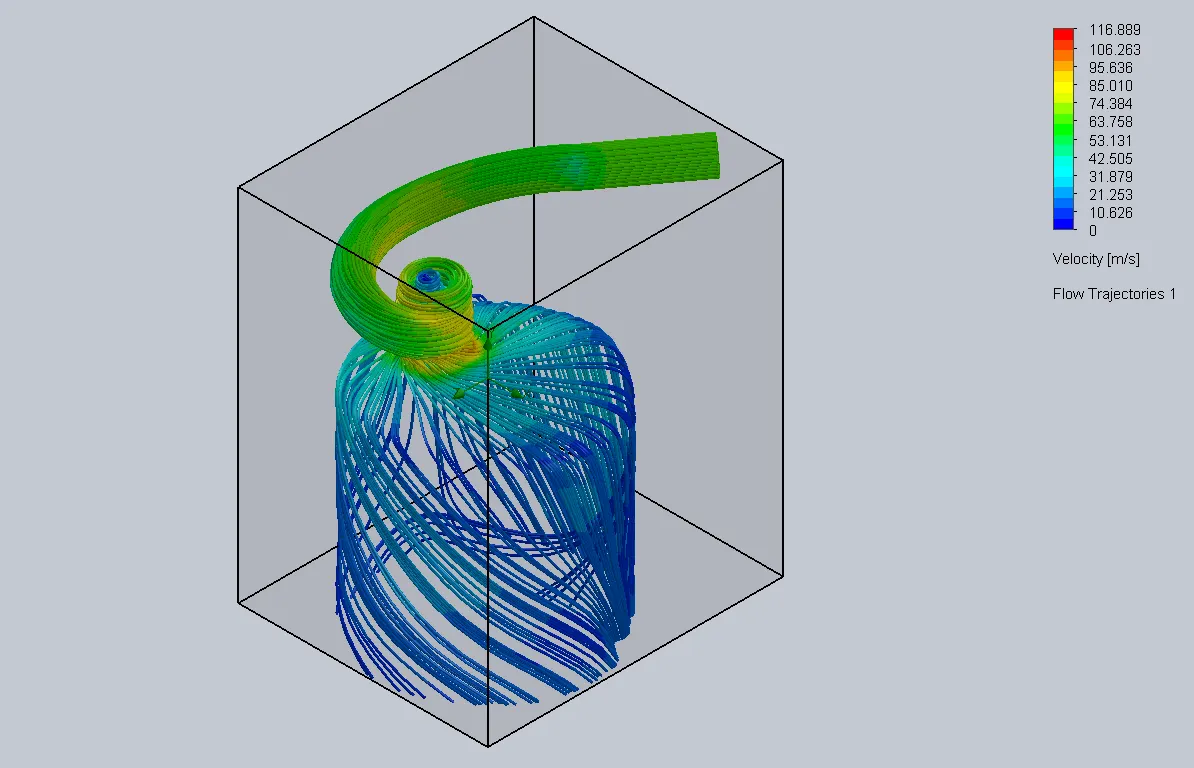
2)Level of Initial Mesh = 6
Velocity Cut Plot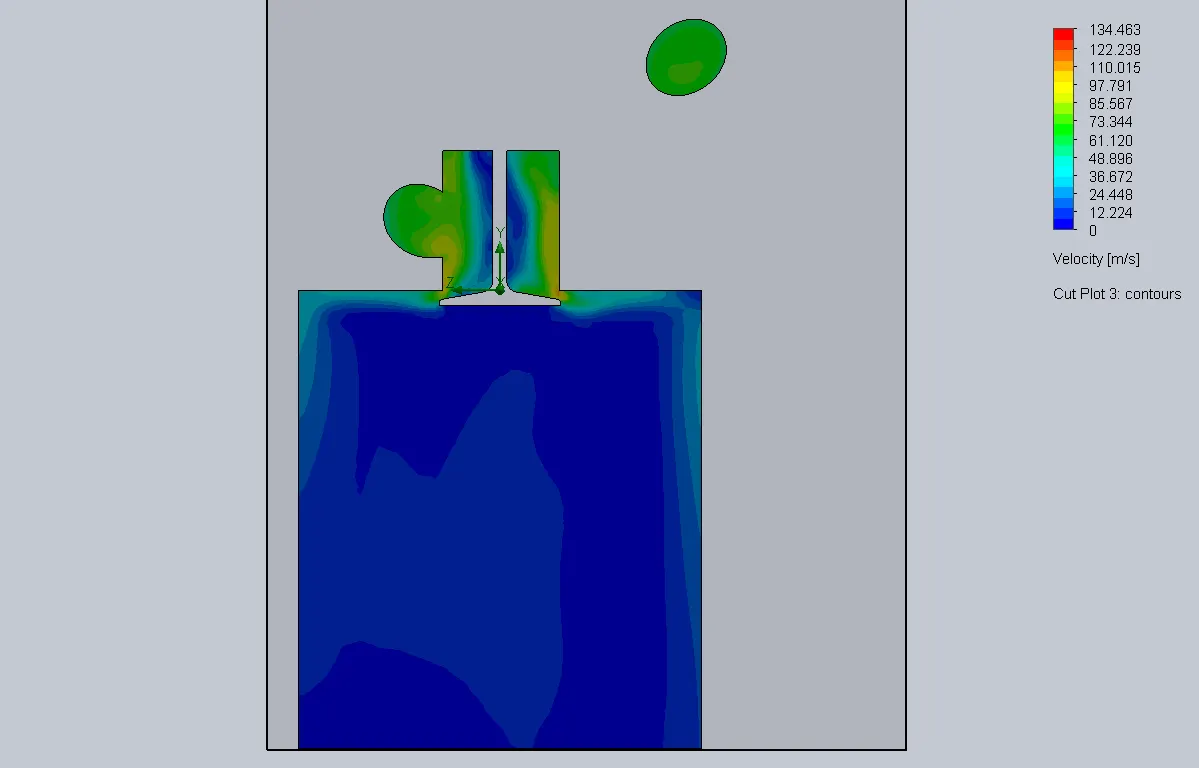
Pressure Cut Plot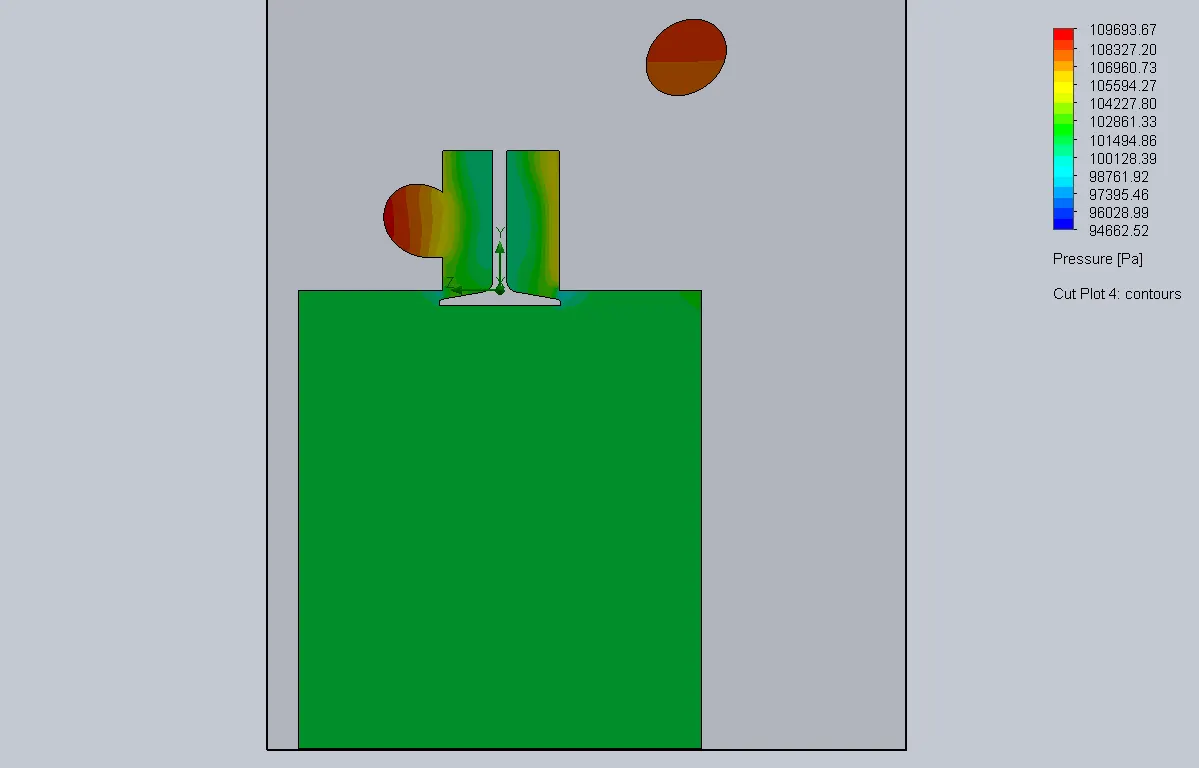
Flow Trajectories 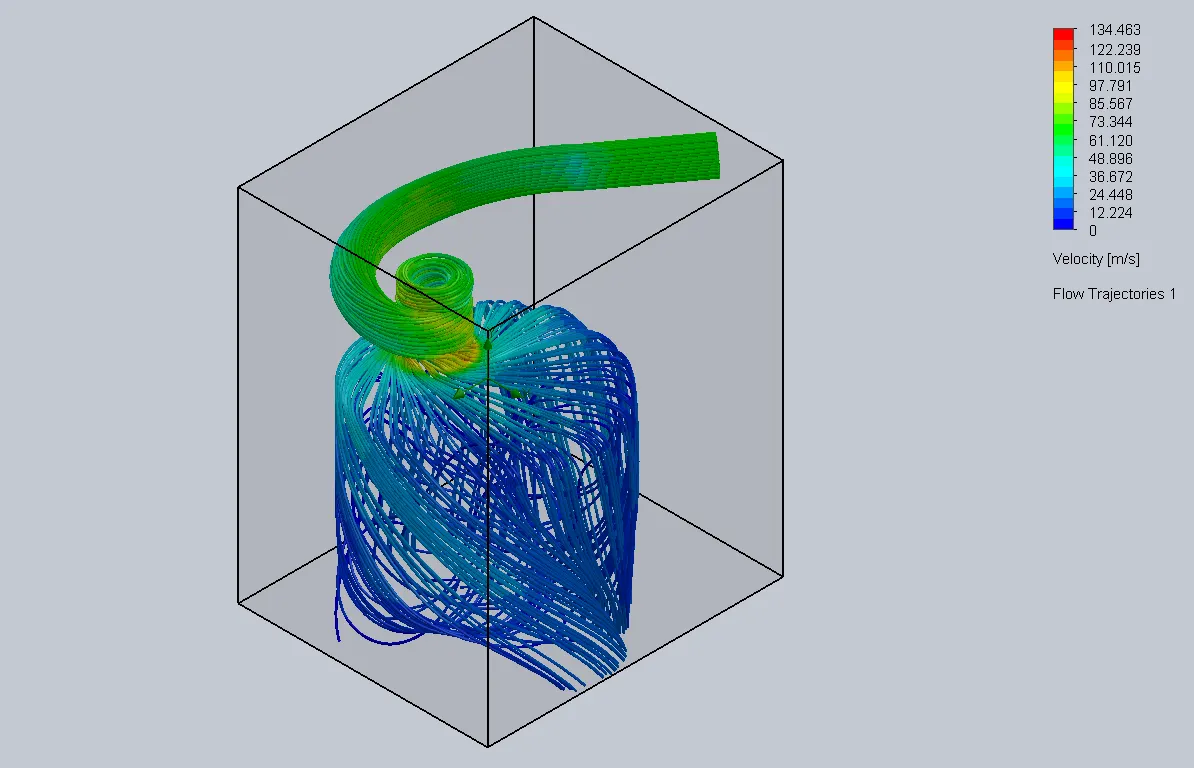
3)Level of Initial Mesh = 7
Velocity Cut Plot
Pressure Cut Plot
Flow Trajectories 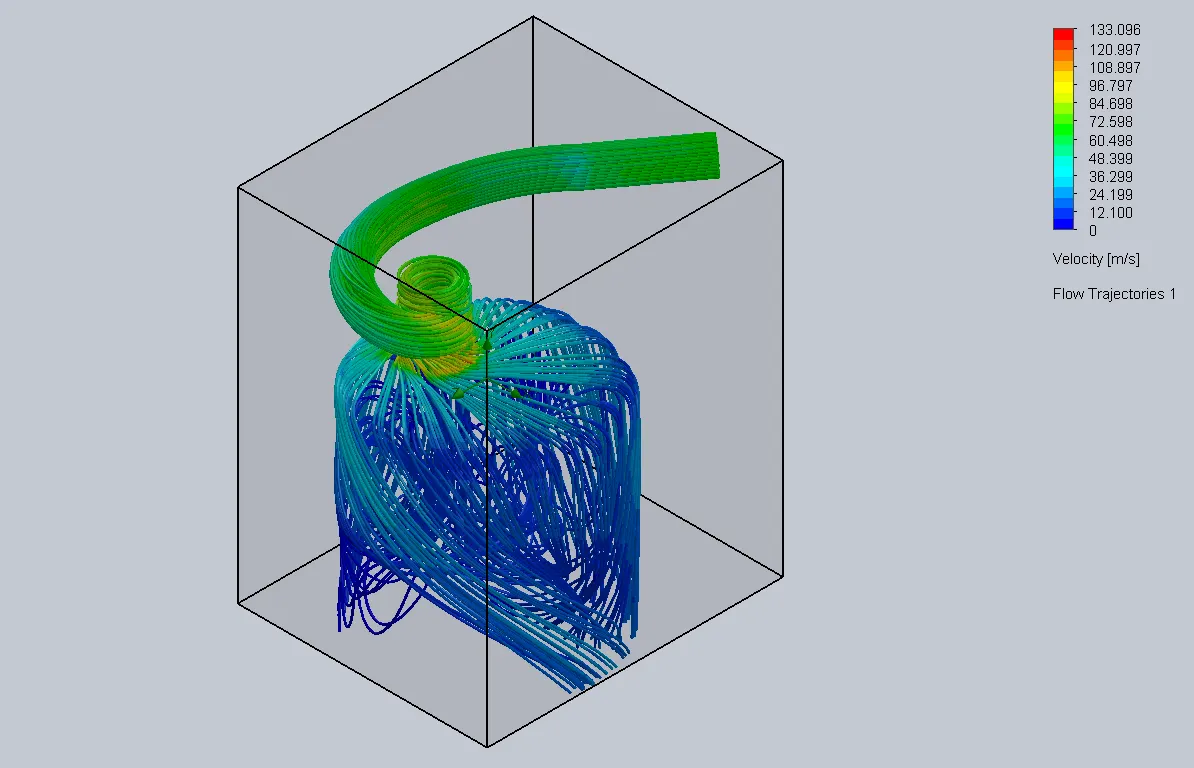
Valve Lift Parametric Study:
1) Valve Lift = 0 mm = 0 m
Velocity Cut Plot
Pressure Cut Plot
Flow Trajectories 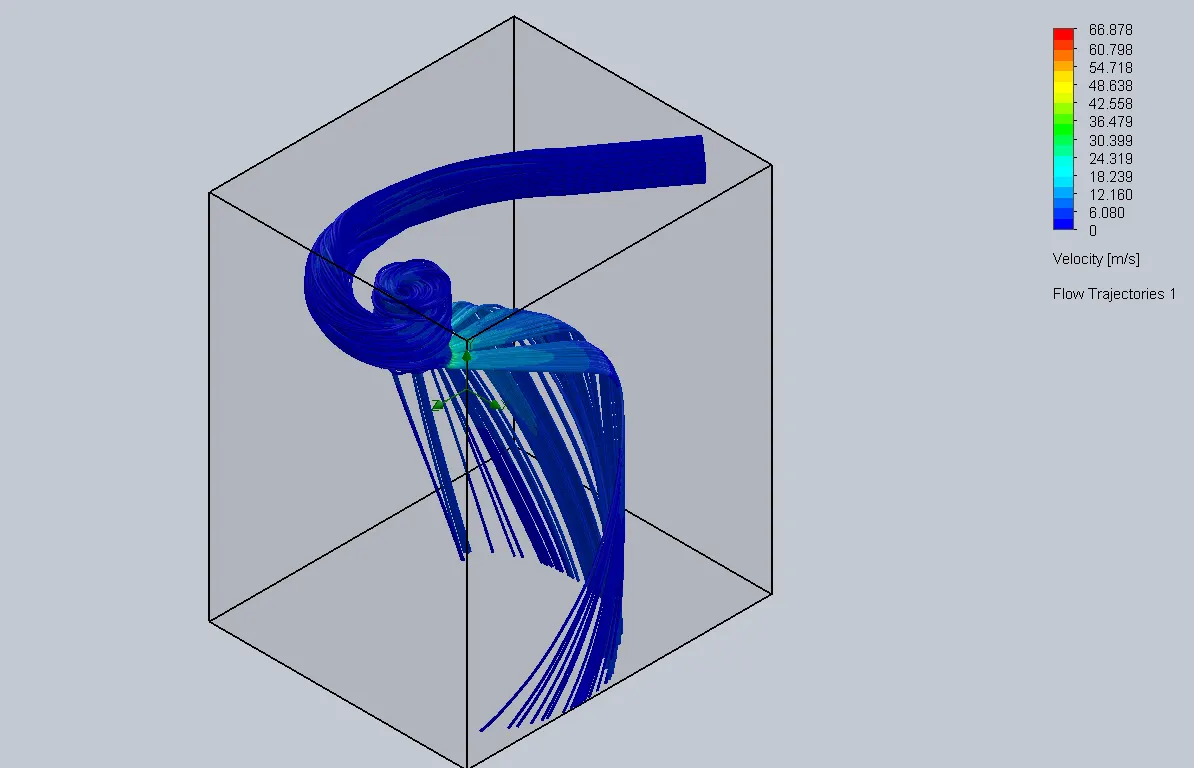
2) Valve Lift = 2 mm = 0.002 m
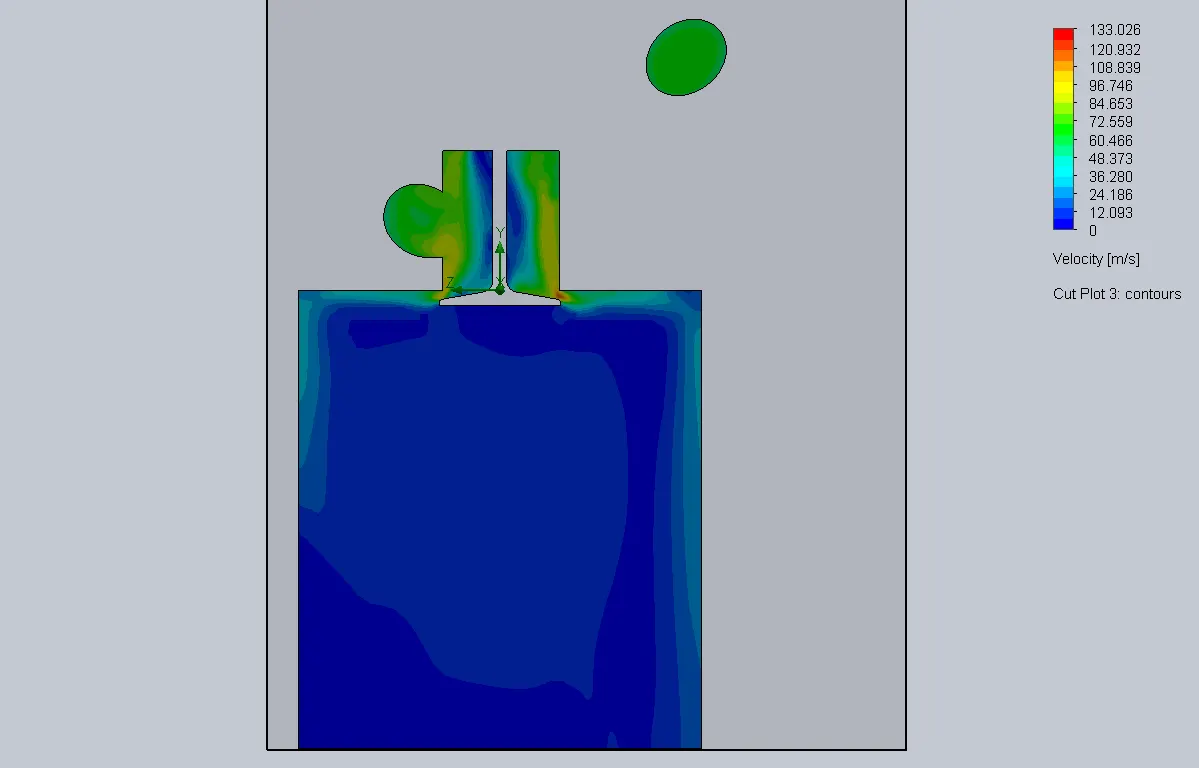
Velocity Cut Plot
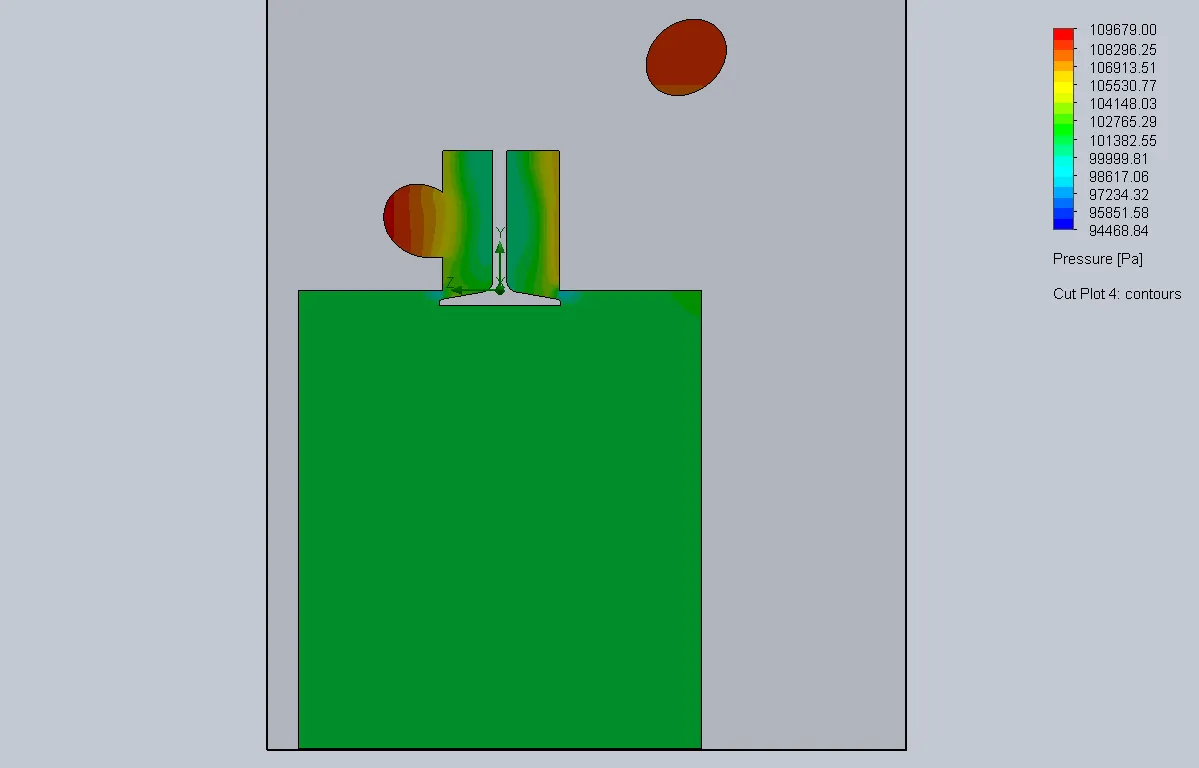
Pressure Cut Plot
Flow Trajectories 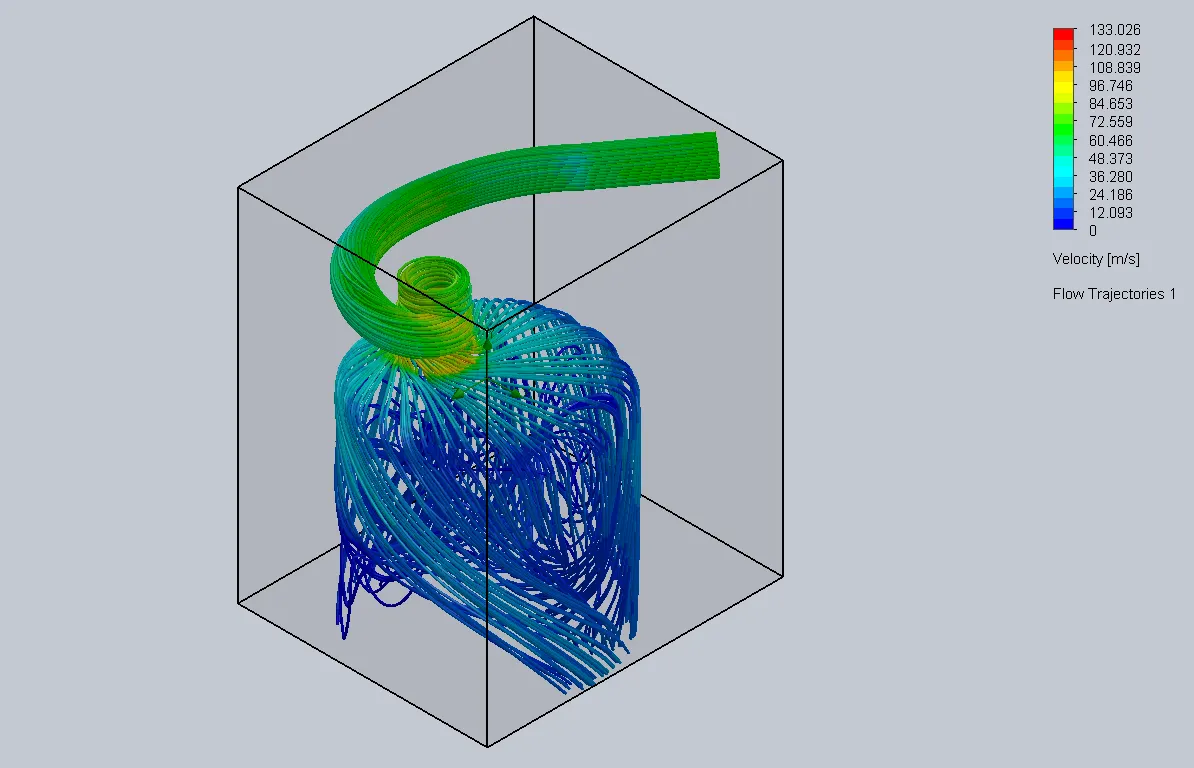
3) Valve Lift = 4 mm = 0.004 m
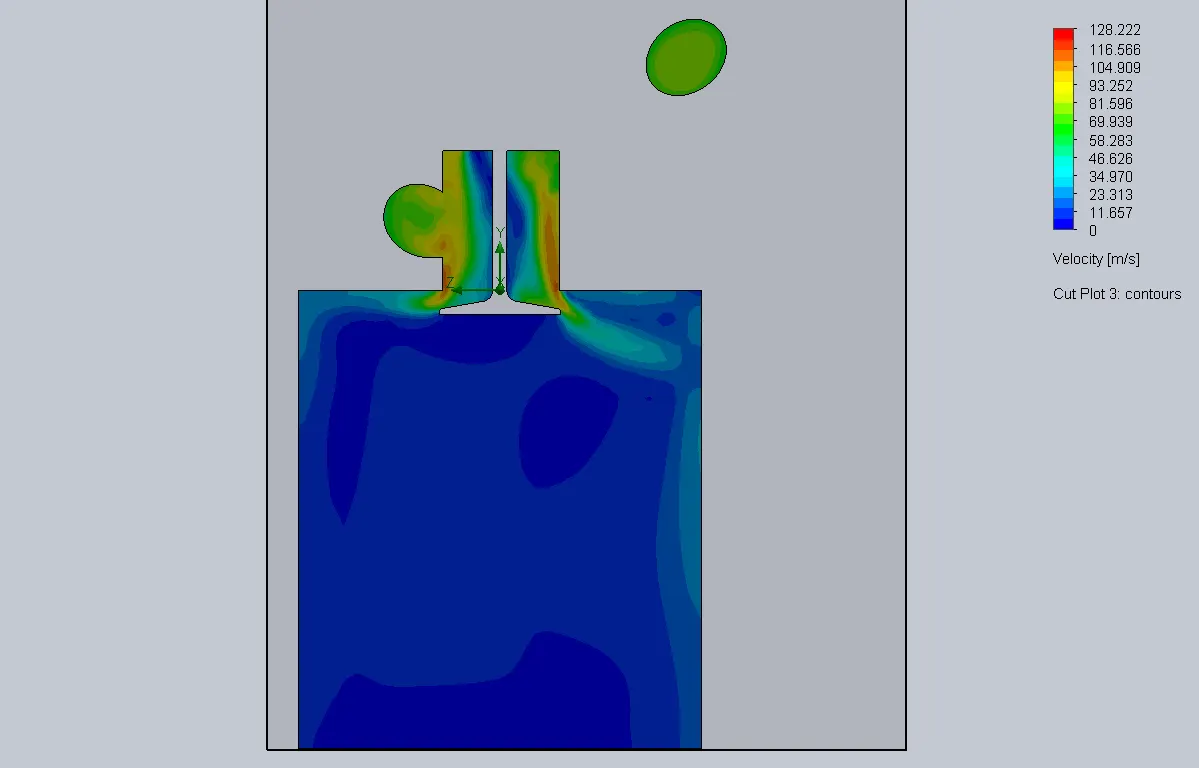
Velocity Cut Plot
Pressure Cut Plot
Flow Trajectories 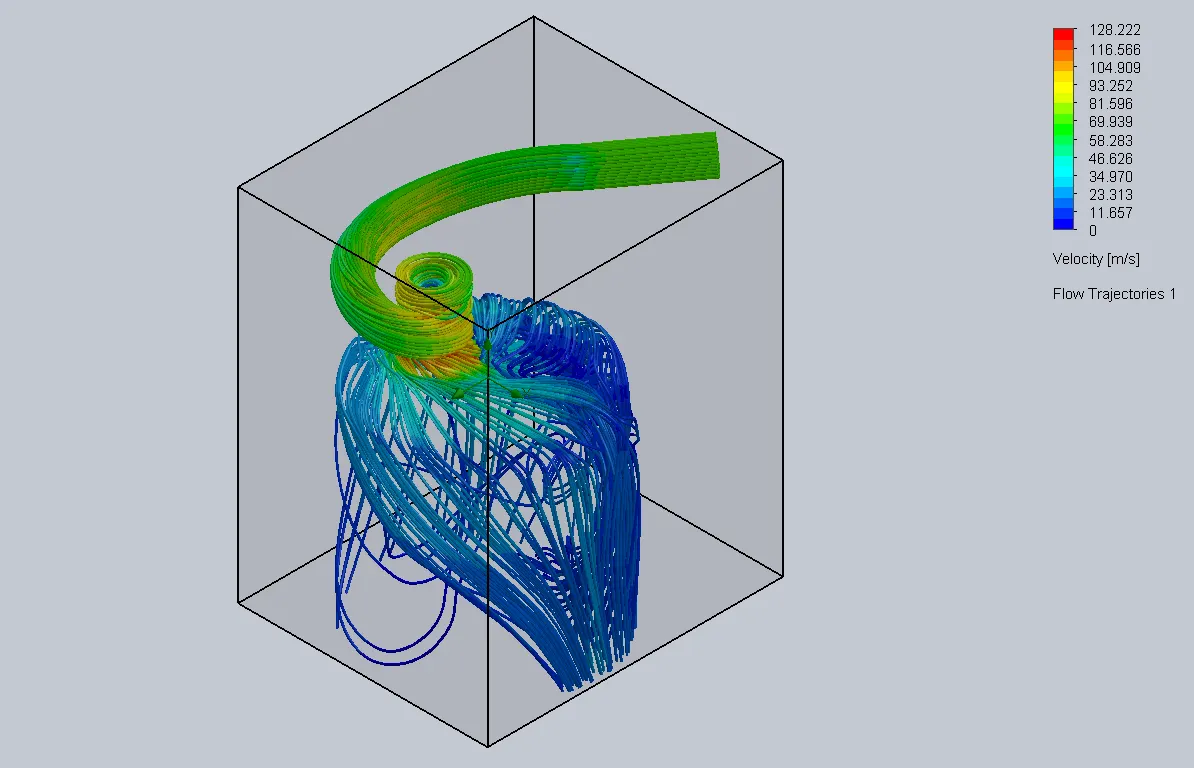
4) Valve Lift = 6 mm = 0.006 m
Velocity Cut Plot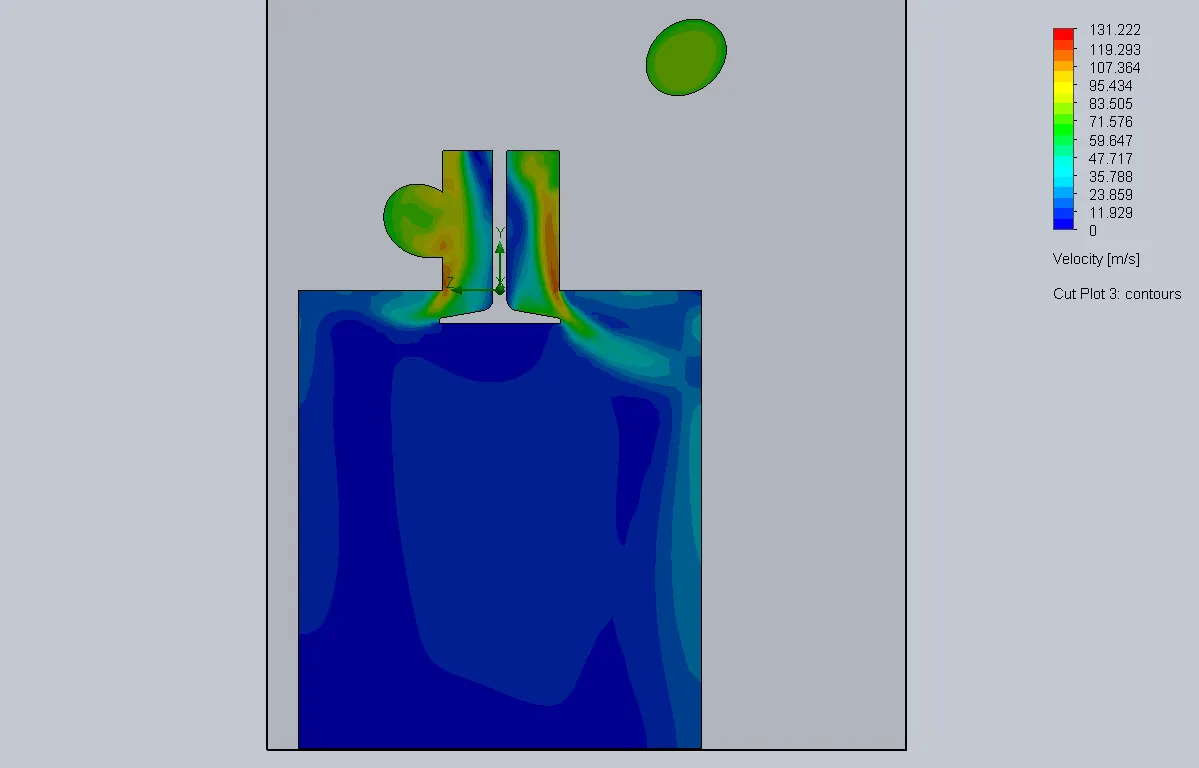
Pressure Cut Plot
Flow Trajectories 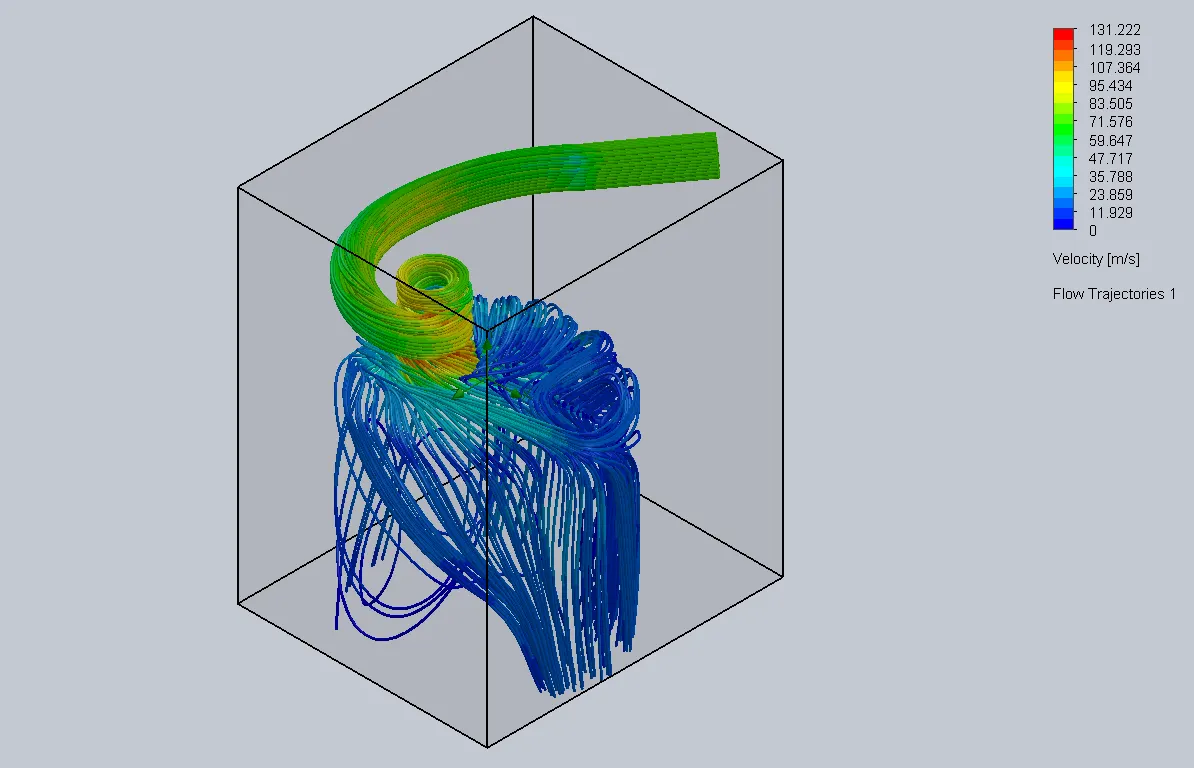
5) Valve Lift = 8 mm = 0.008 m
Velocity Cut Plot
Pressure Cut Plot
Flow Trajectories 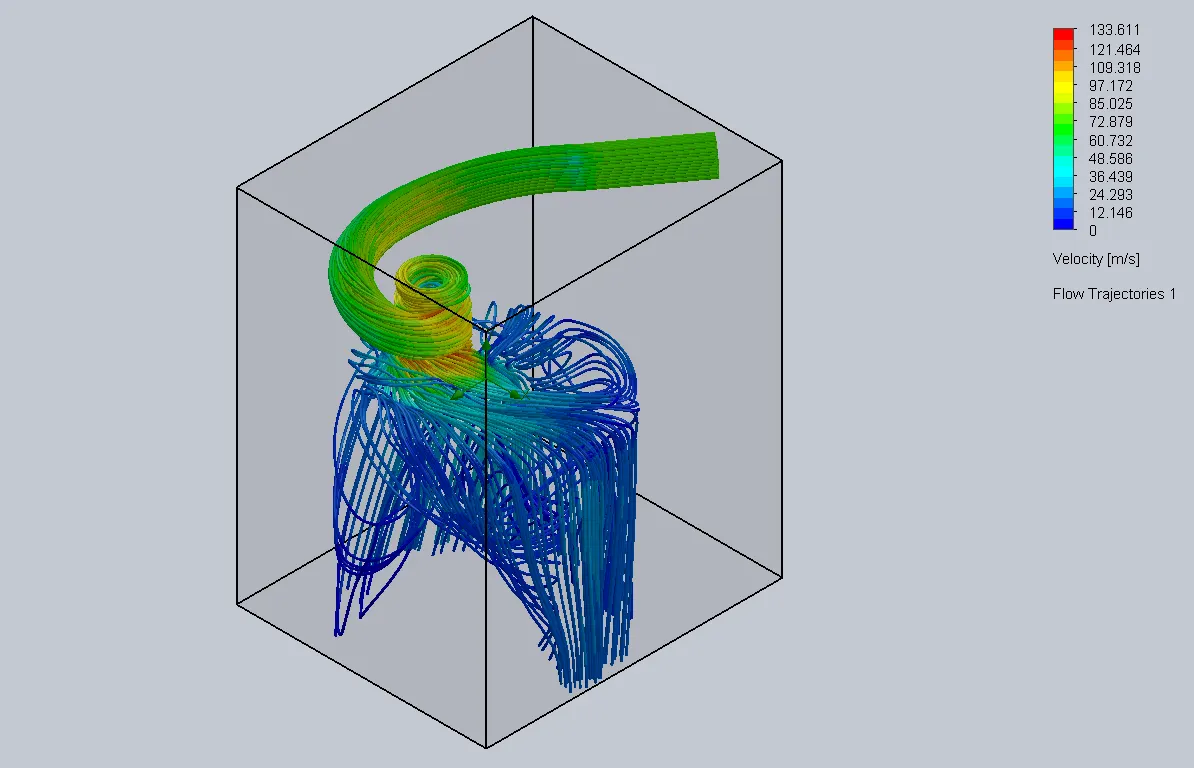
6) Valve Lift = 10 mm = 0.01 m
Velocity Cut Plot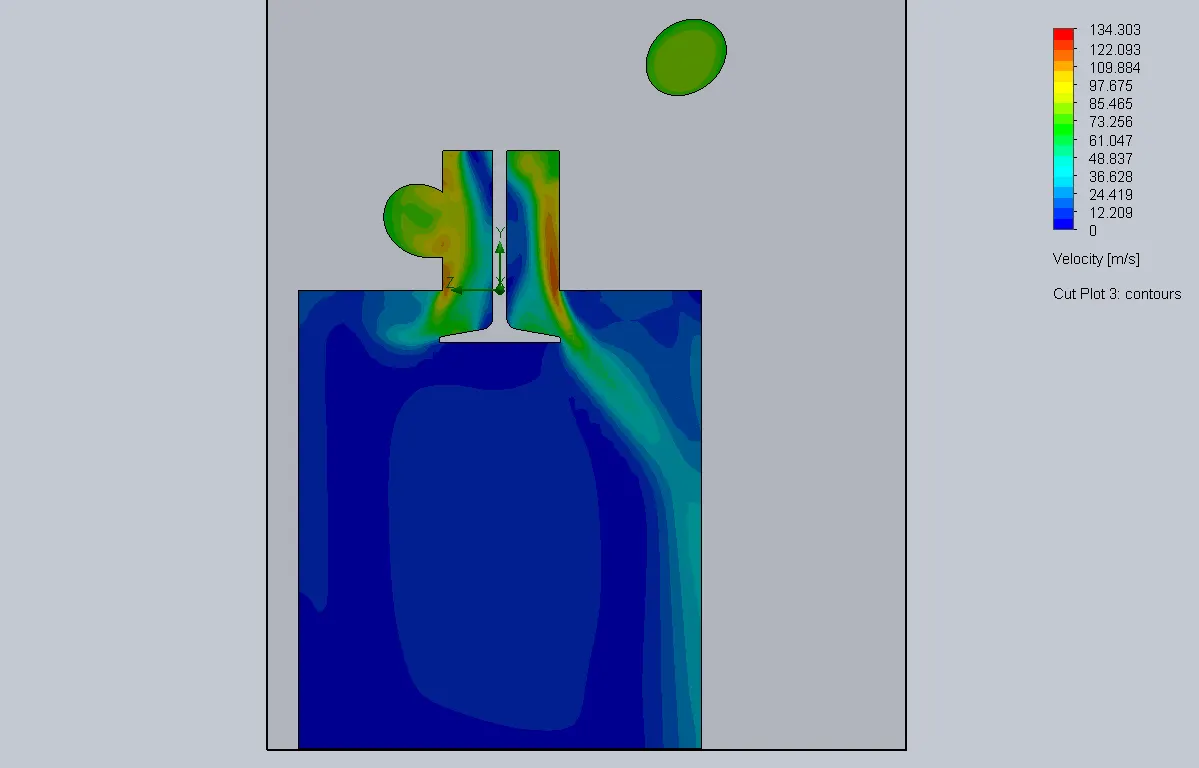
Pressure Cut Plot
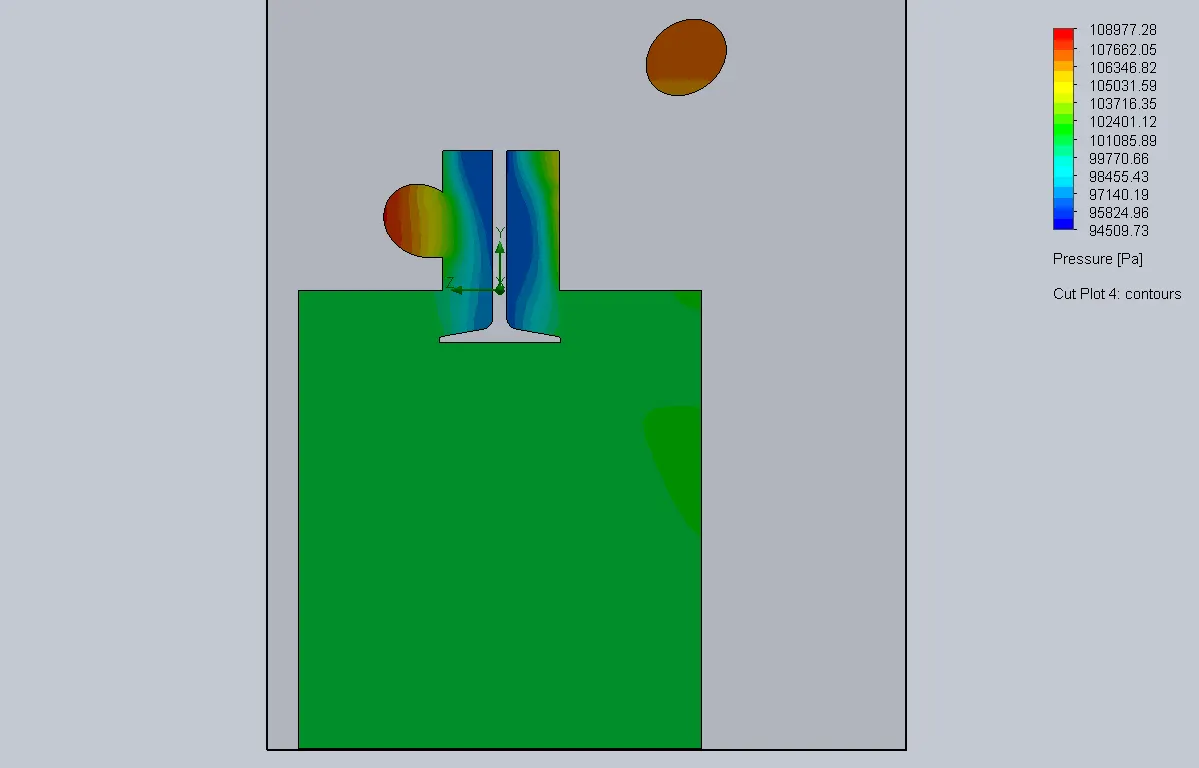
Flow Trajectories 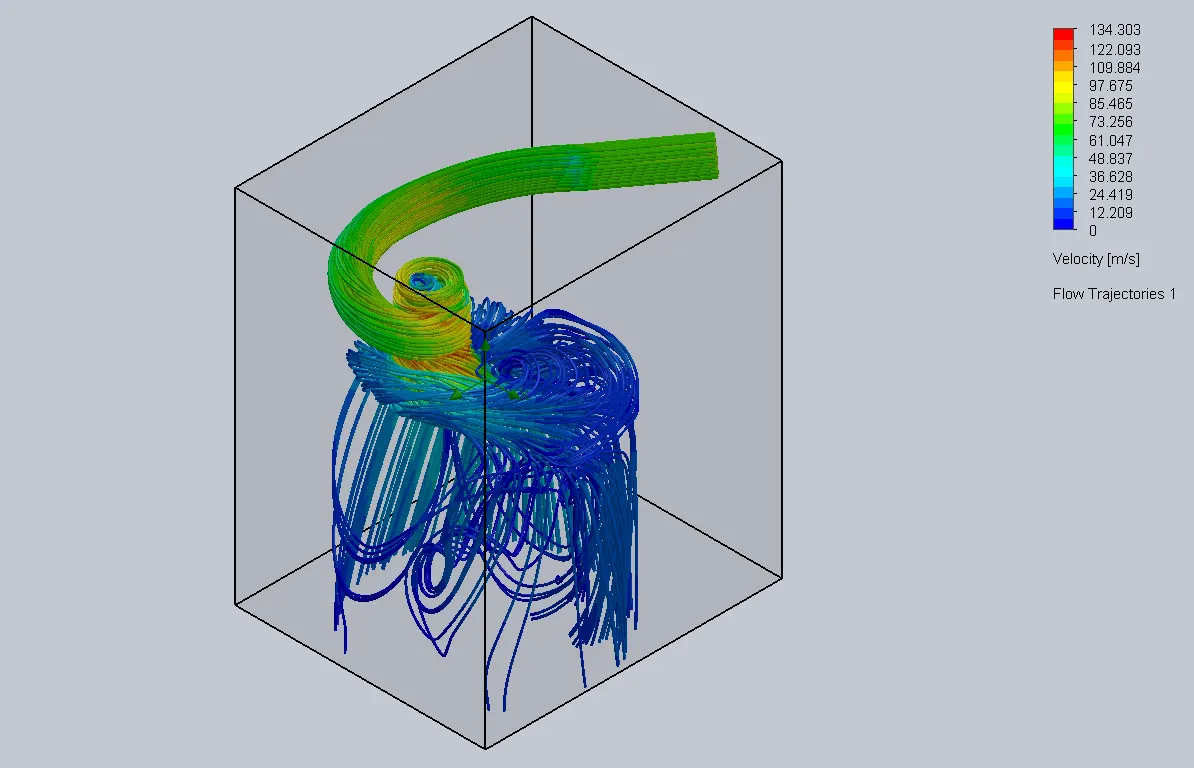
7) Valve Lift = 12 mm = 0.012 m
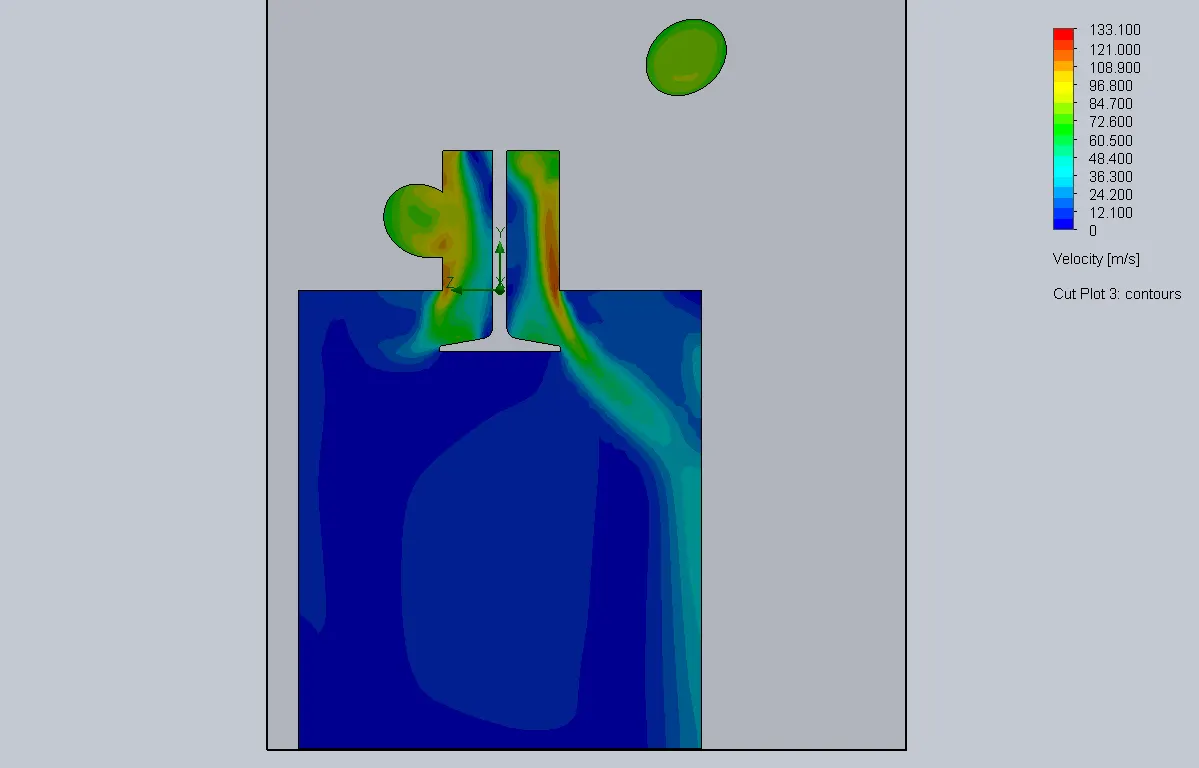
Velocity Cut Plot
Pressure Cut Plot
Flow Trajectories
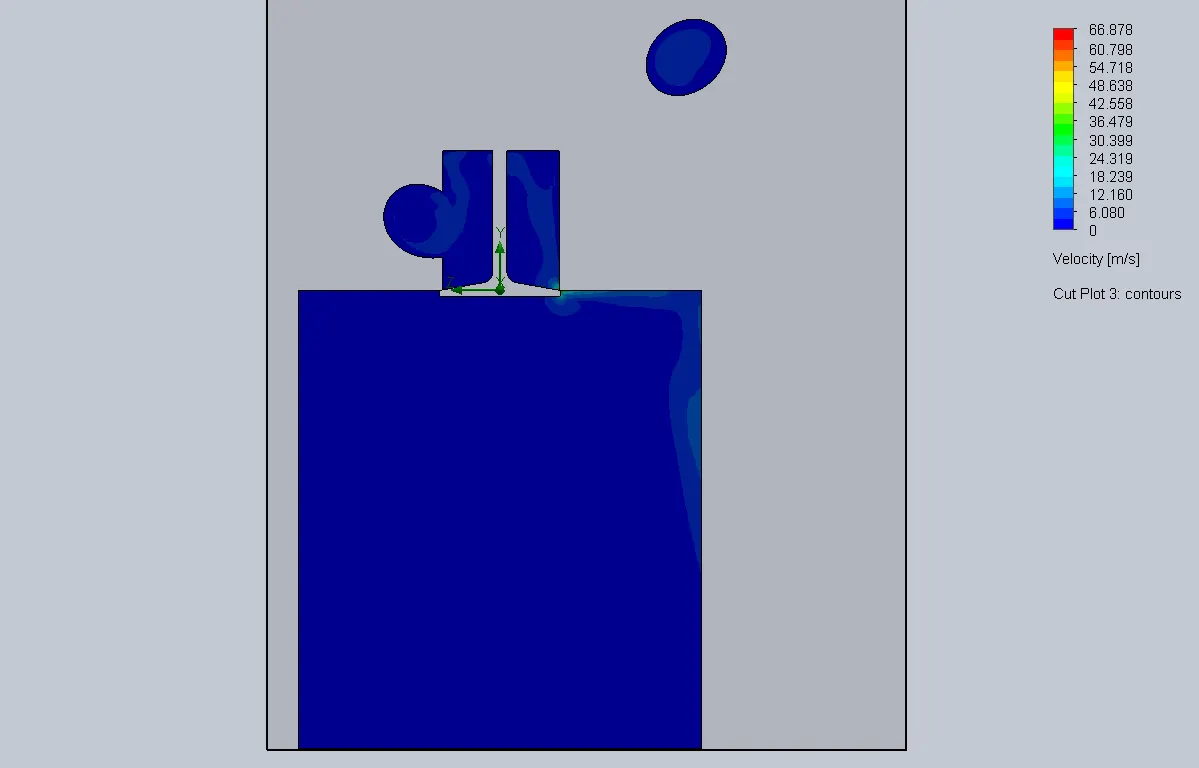
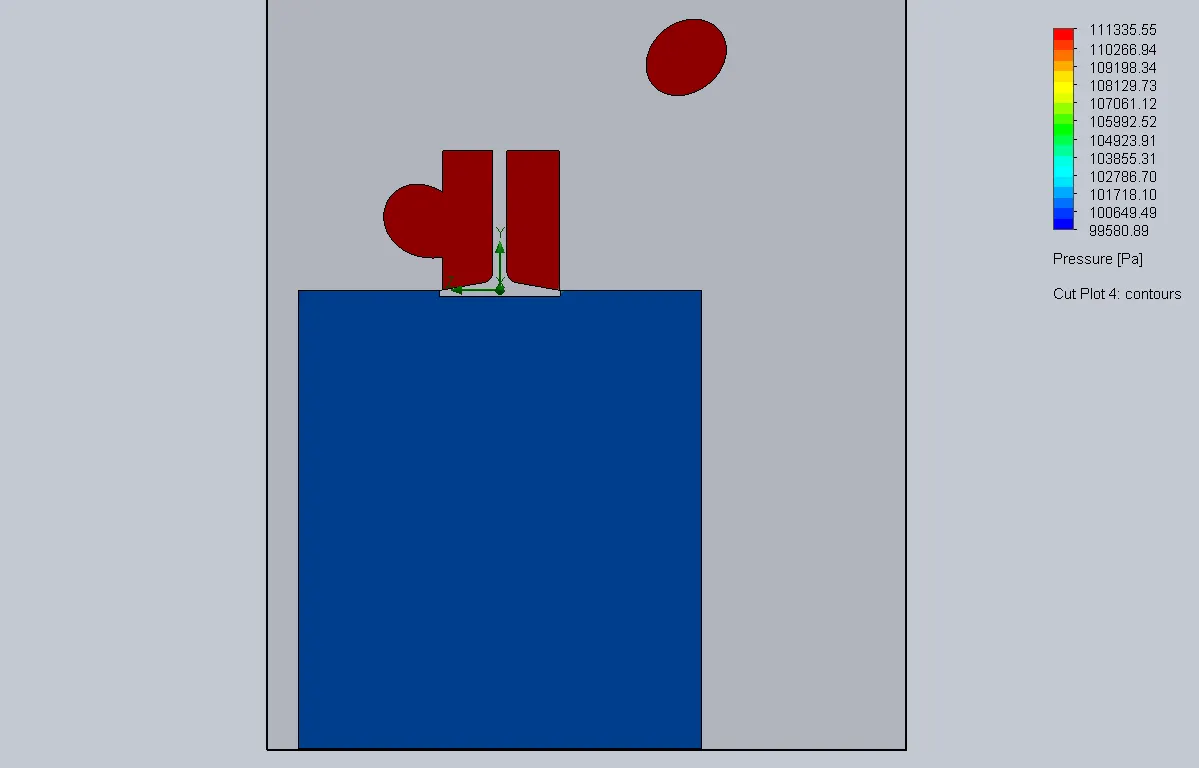
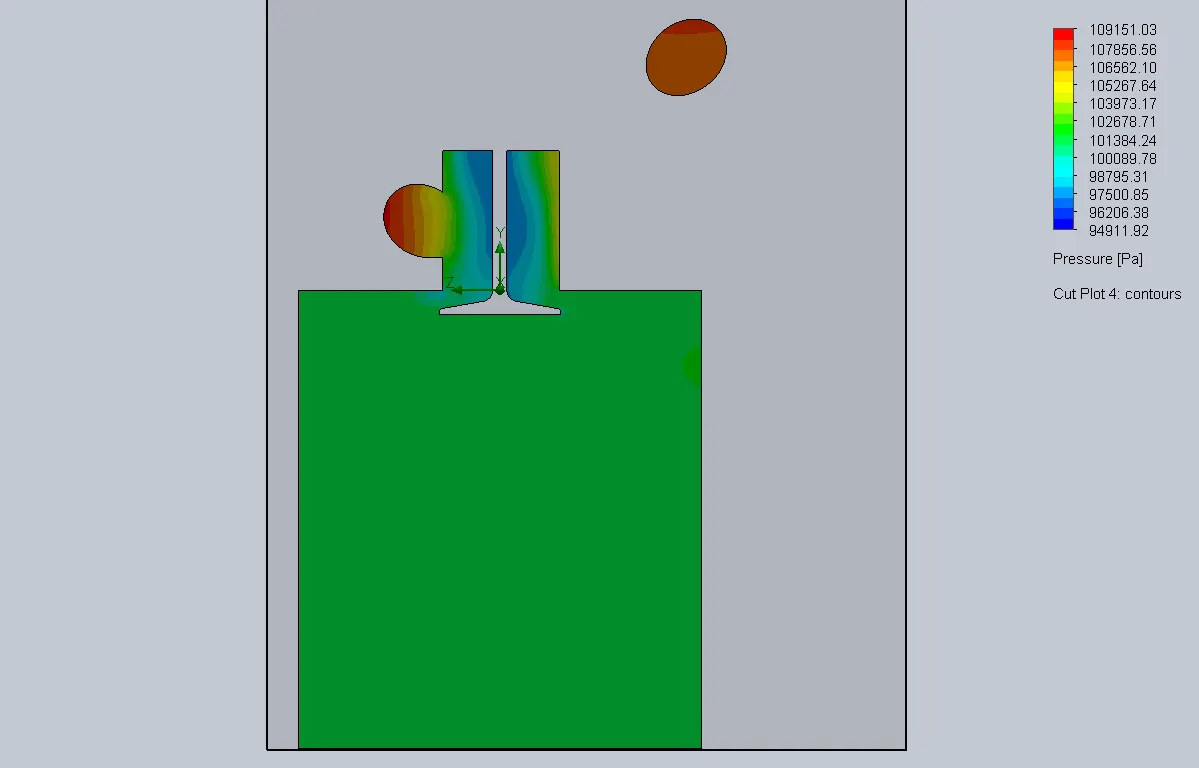
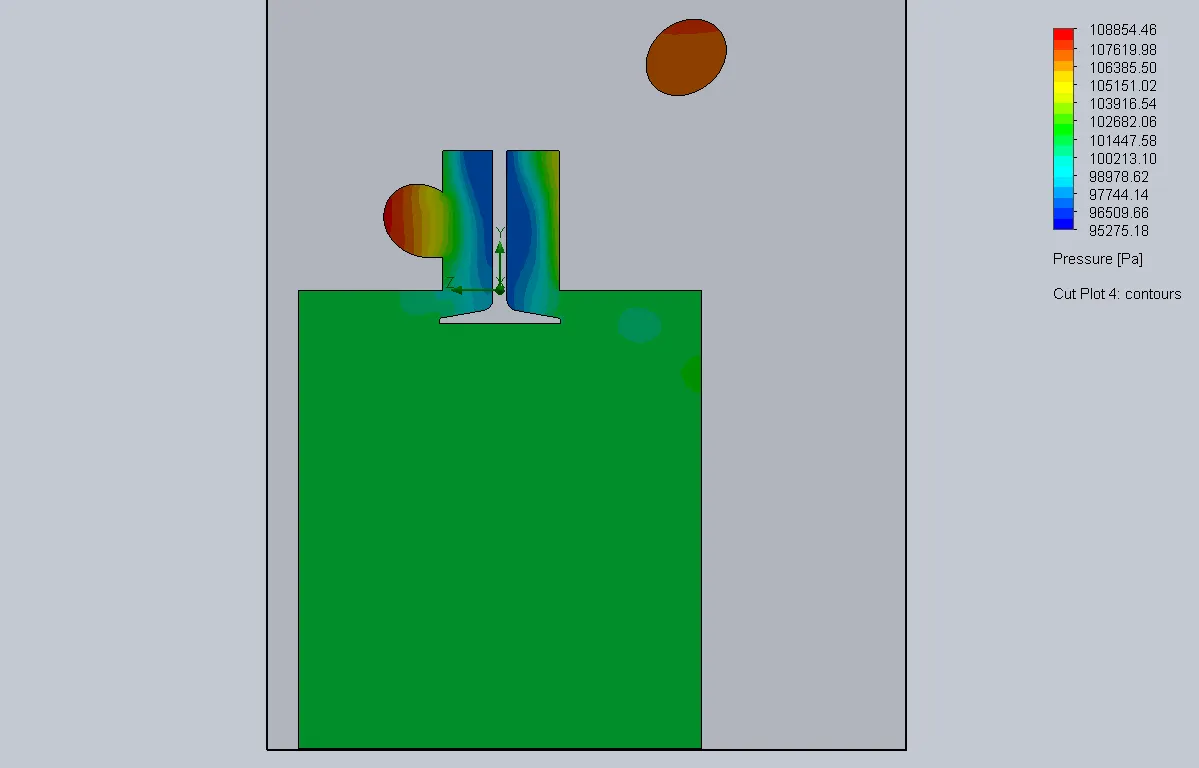
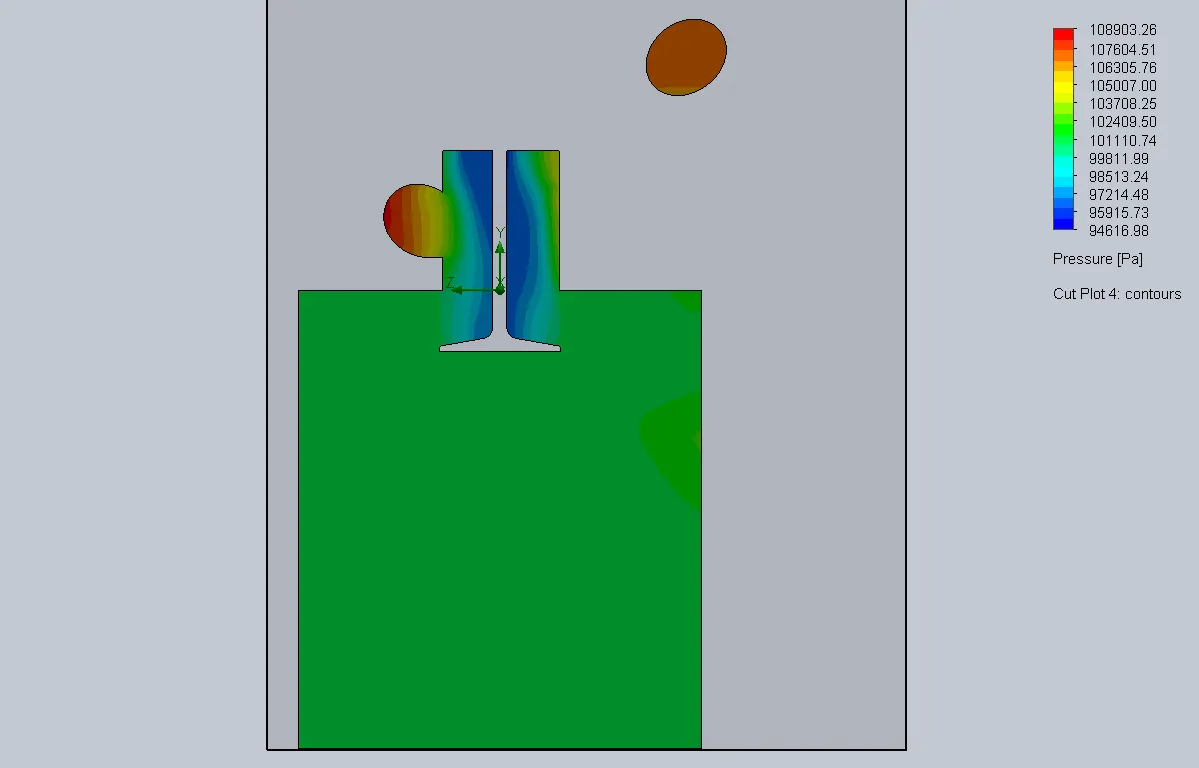
At Valve Lift=0mm that is valve closed, very little or no flow takes place as it is evident from the Velocity and Pressure plot. Velocity is low as fluid flow is restricted and Pressure is very high due to accumulation of charge.
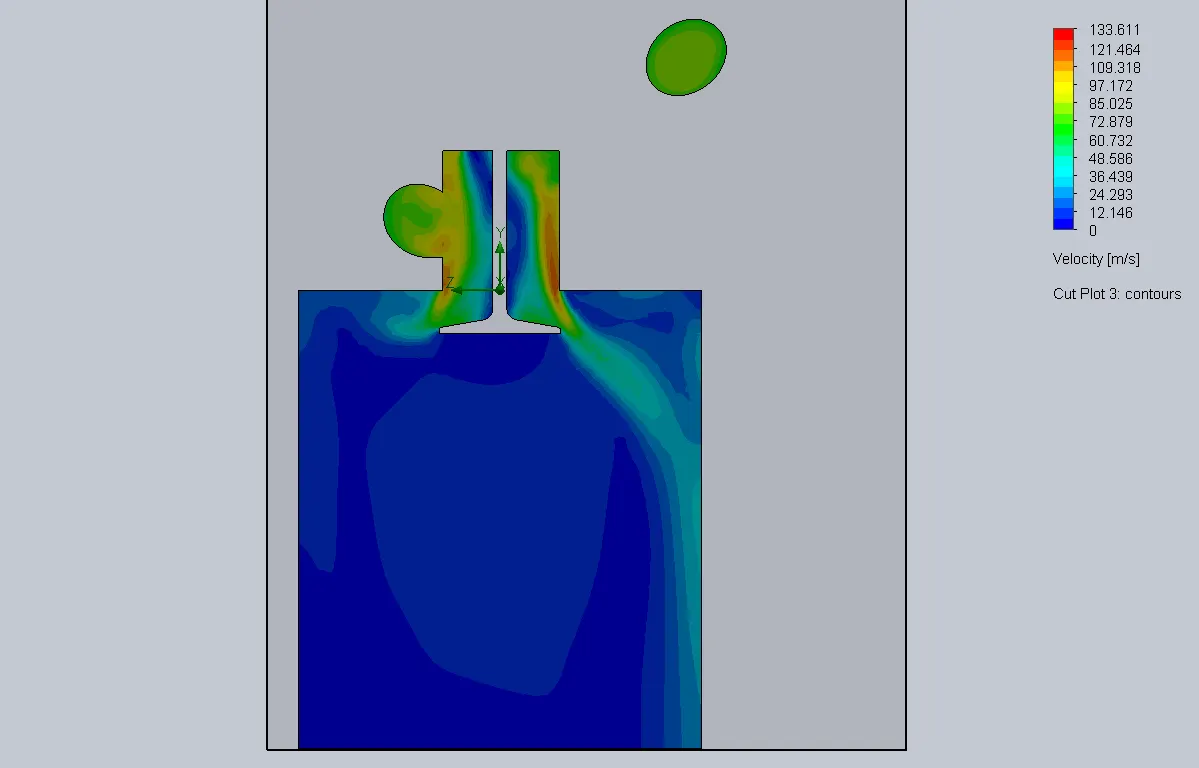
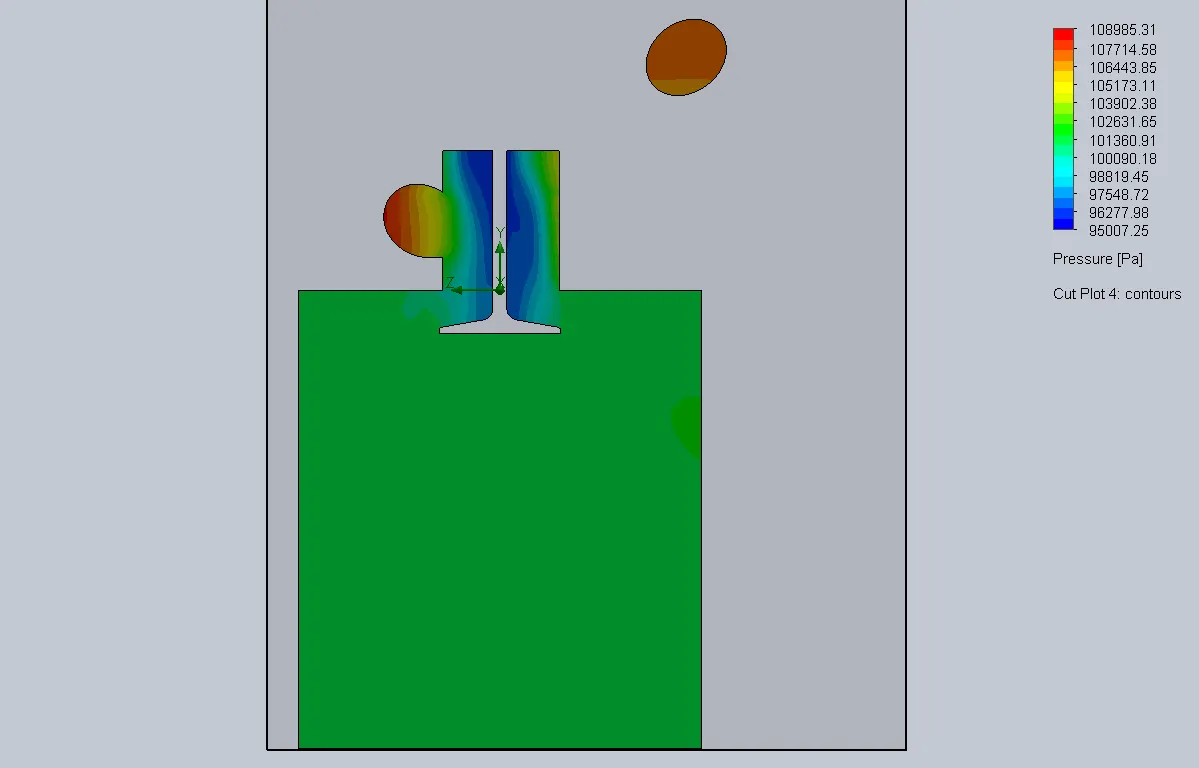
As the Valve is opened gradually with Valve lift increasing the flow starts developing and Velocity of the fluid increases. We can also see that Pressure goes on decreasing which satisfies the Brenoulli's Principle.
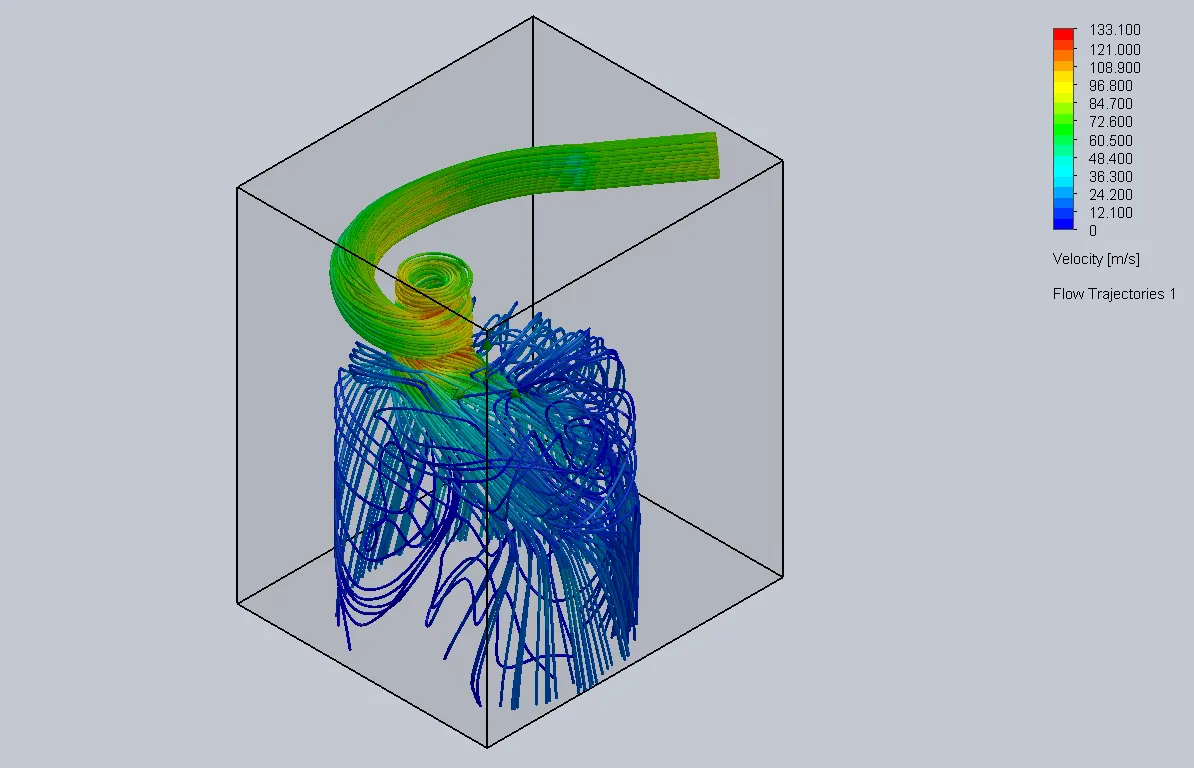
Observing the Flow Trajectories it is evident that as Valve is increased the flow lines get more chaotic with increasing velocity.
However after Valve Lift of 0.01 m the change in Velocity and Pressure is very liitle compared to previous trend.
We can also observe the swirl induced flow due to Helical Port intake frok the Flow Trajectories. The fluid enters the cylinder with increased velocity due to angular momentum forced on it.As a result there is more turbulent and better movement of Fluid in the Cylinder.
Mass Flow Rate :
| Goal (Value) | Design Point 1 | Design Point 2 | Design Point 3 | Design Point 4 | Design Point 5 | Design Point 6 | Design Point 7 |
| D8@[email protected] [m] Valve Lift | 0 | 0.002 | 0.004 | 0.006 | 0.008 | 0.01 | 0.012 |
| SG Mass Flow Rate* 1 [kg/s] | -0.000738028 | -0.014717796 | -0.016636971 | -0.017094622 | -0.017386667 | -0.017547846 | -0.017559323 |
*Mass flow rate is negative as mass leaves the system .
Plot of mass flow rate vs Valve Lift.
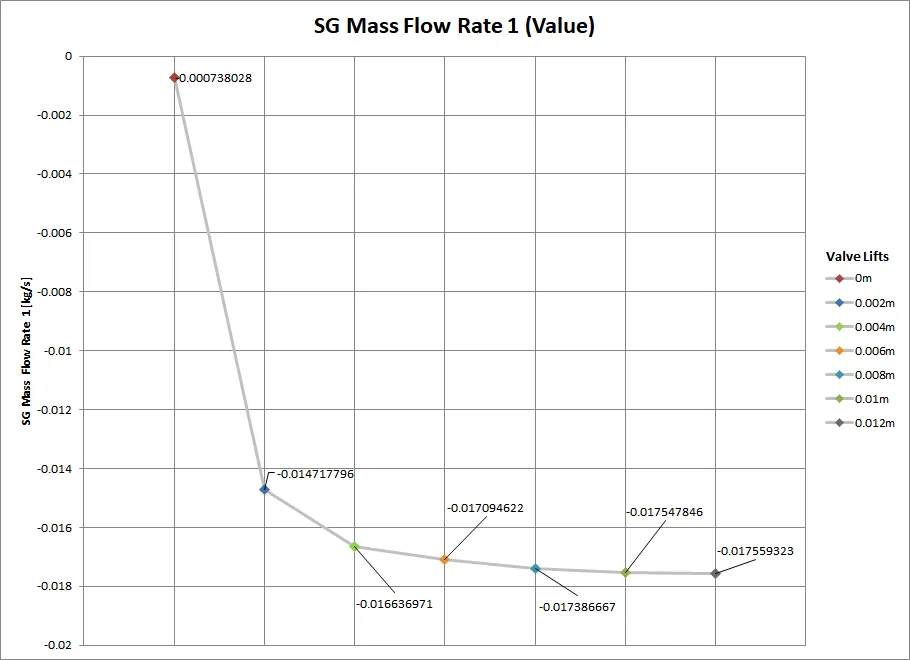
The mass flow rate goes on increasing with the increase in the Valve Lift due to increasing volume of fluid flow. But the difference in mass flow rates for values 0.01 m and 0.012m of valve lift is not much. From the plot Mass flow rate vs Valve Lift the trend in the mass flow rate can be observed. It rises drastically for 0.002 m of valve lift and is later on gradually after it.The change is then neglible after valve lift of 0.01m.
Thus after 0.01m valve lift the mass flow rate doesn't changes considerably. Thus we can say that 0.01m is optium value of Valve Lift for this setup.
Conclusion:
Thus we can say that as Valve Lift increases the mass flow rate increases for the Flowbench geometry . The Helical Intake Port causes Swirl motion in the cylinder of the fluid and helps in better mixing.