Flow over an airfoil
Flow over an airfoil
Aim:
1)Create a Model for Flow Simulation over a NACA0017 airfoil
2) Run simulation for different angles of attack 0°,2°,4°,6°,8°,10°.
3) Compare the lift and drag forces.
Theory:
Airfoil: An airfoil is term used to define the waterdrop shape of cross-section of an object like wings,blades,sails that when in flow created an aerodynamic force i.e lift or thrust.
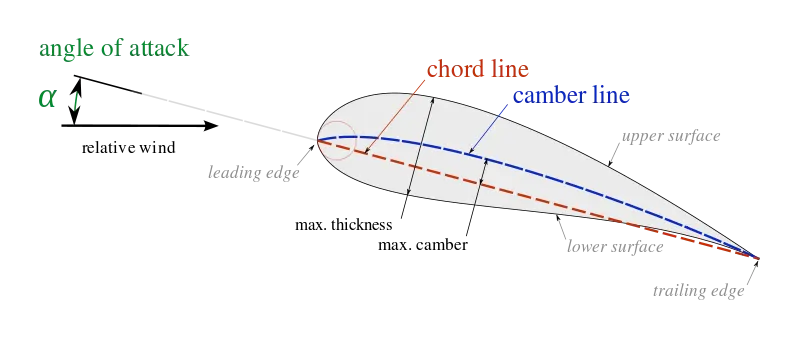
When fluid strikes the leading edge of the Airfoil ,th shape of Airfoil causes fluid to flow around the airfoil from leading edge to trailing edge on upper surface and from trailing edge to leading edge on lower surface. As a reult the top surface velocity is more than the lower surface which in turn causes higher pressure at lower than at top, which generates lift. This downwash of fluid depends shape of airfoil and angle of attack .

Angle of Attack: Angle of attack is the angle between a reference line on a body for an airfoil it is usually the chord line and flow direction of fluid.
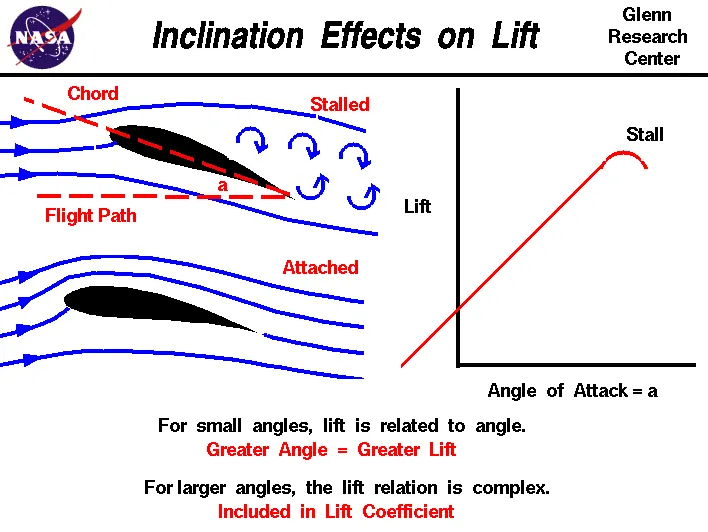
Critical angle of attack: The angle of attack which produces the maximum lift coefficient is called critical angle of attack. Also called as stall angle of attack.
Forces on airfoil :
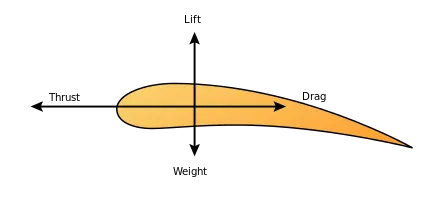
1) Lift Force: Lift force is the force component perpendicular to the direction of relative motion.
FL= (CL.ρ.A.v2)/2
where CL=Lift coefficient
ρ= density of fluid.
A= Area of body
v= fluid velocity
2) Drag force:Drag force is the force component parallel to the direction of relative motion.
FD= (CD.ρ.A.v2)/2
where CD= Drag Coefficient.
3) Thrust force:Thrust force is force created by propellers and jet engines .
4) Weight force: This a body force and not an aerodynamic force.
Stalling :
The lift increases as the angle of attack is increased. Lift is maximum at Critical angle of attack or stall angle. Beyond this angle the boundary layer seperates from the airfoil surface and it will abruptly lose lift . This condition is called stalling. Here drag force is greater than lift force.
Stall angle is mostly around 15°.
NACA 4digit Airfoil:
The Naca airfoils are airfoils shapes for aircraft wings developed by the National Advisory Committee for Aeronautics. The shape is described using a series of digit after the word NACA.
NACA 4 digit airfoil is controlled by 4 digits NACAMPXX , which designate the camber, position of the maximum camber and thickness.
M is maximum camber divided by 100.
P is the position of the maximum camber divided by 10.
XX is thickness divided by 100.
Thus for NACA0017, M=0 so camber is 0% of the chord.
P=0 position of max camber is at 0% of the chord.
XX=17 , so the thickness is 17% of the chord.
Methodology:
First we will generate dataset for NACA0017 in NACA 4 digit airfoil generator on airfoiltools.com.
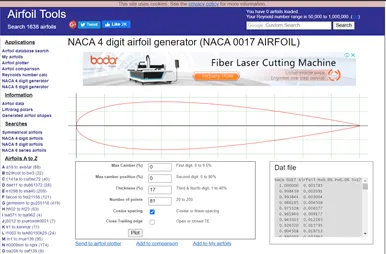
Then we will copy the points generated in a text file and as we can see there are only x and y coordinates we will add a column for z as 0 for each row and save the text file.
Now in Solidworks we will create a Curves through x,y and z points by browsing the text file.
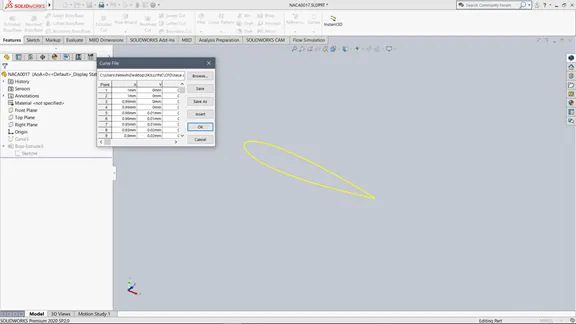
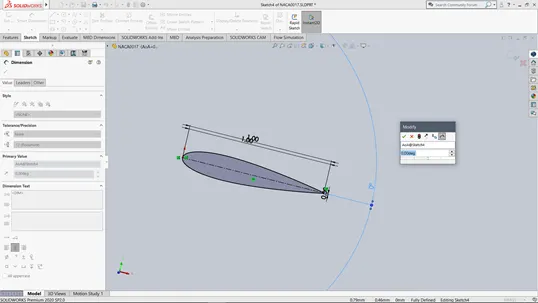
Then we will generate a sketch of curve in respective plane using Convert Entitities. Now we will give respective dimensions like Chord length C =1 mm and complete the sketch by creating a closed geometry.
Here Angle Of attack dimension is of importance as we will changing it values through 0,2,4,6,8 and 10. For thag we will name the angle dimension as AOA. For first simulation it will be zero.
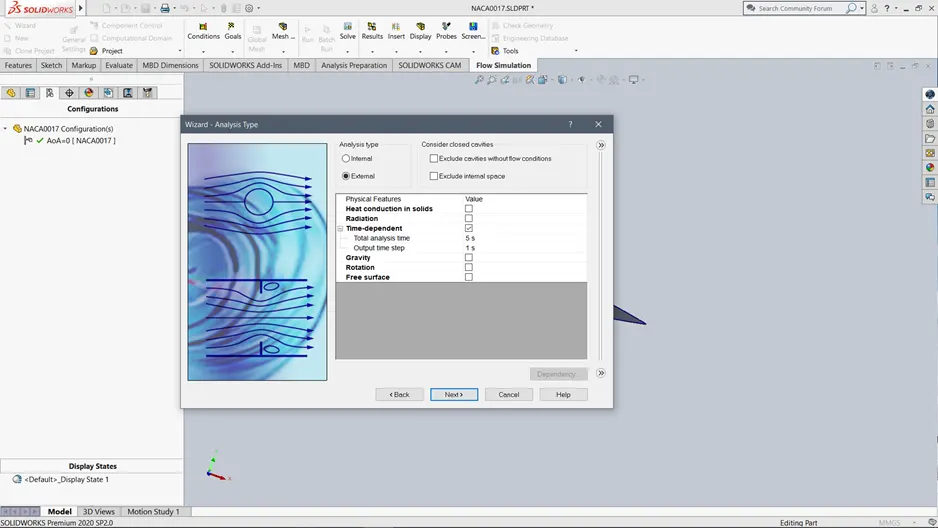
Now using the Wizard we will create a flow simulation for AOA analysis. We will keep Total analysis time as 5s and Output time step as 1s.
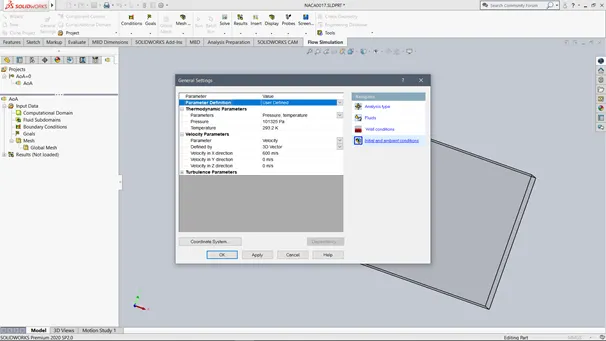
Then is Initial condtions we will set Velocity in x direction as 600 m/s.
Once a simulation is created we will change the dimension of Computational domain for 2d simulation for XY plane by values :
+x = 15 C =15mm
-x = -5C = -5mm
+y= 10C = 10mm
-y = -10C = -10mm
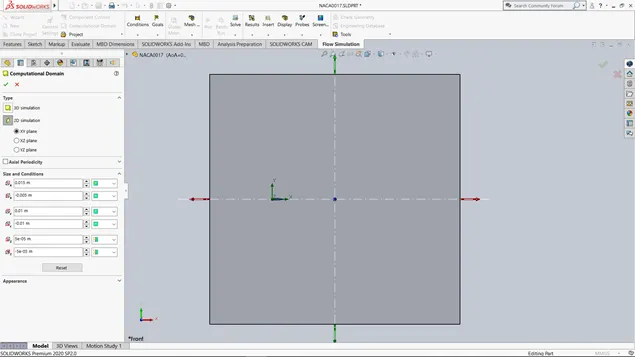
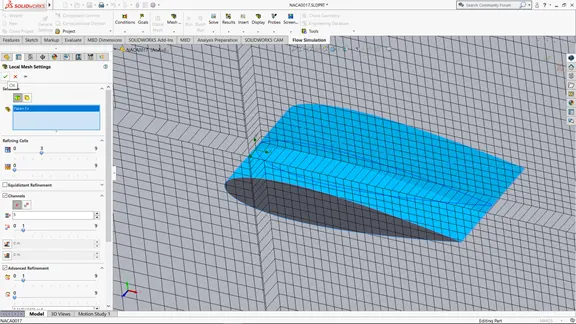
Then we will see if General mesh is created. And create a Local Mesh over the surface of airfoil by refining cells by 3.
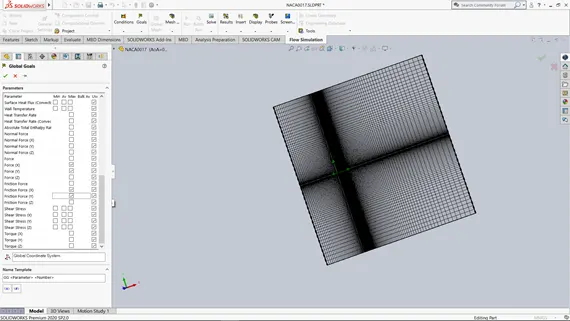
Then we will insert global goals Force and Friction force in X and Y directions.
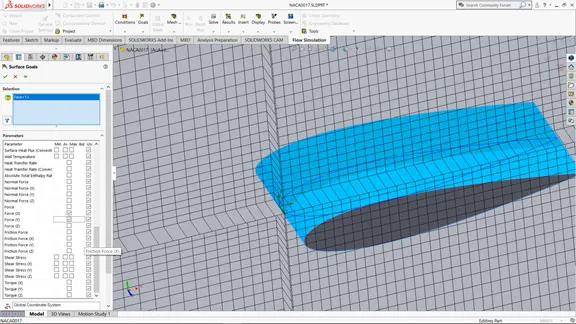
We will also create Surface Goals by clicking on curved surface of Airfoil and selecting Force in X and Y direction.
Then we will create Cut Plots for Pressure and Velocity.
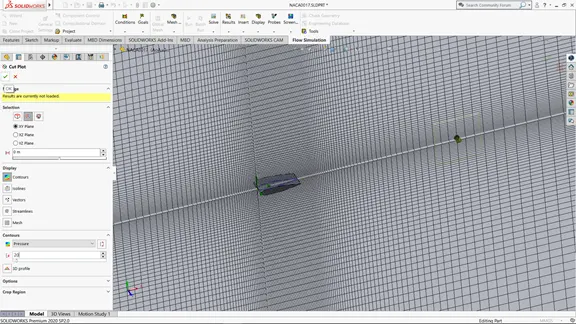
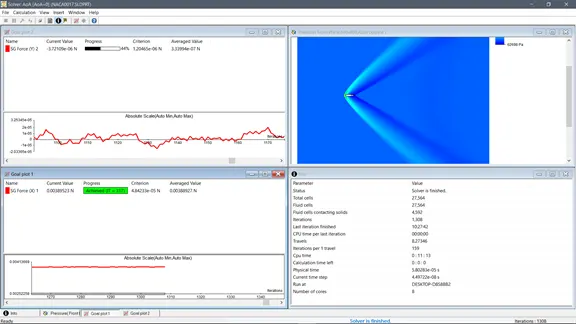
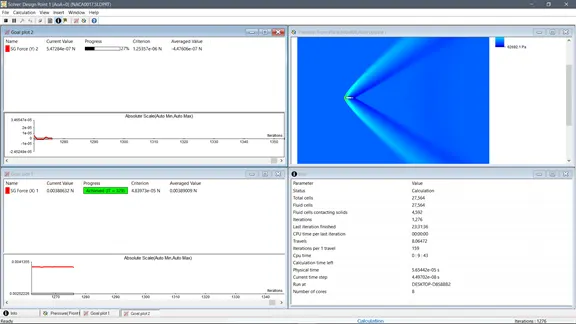
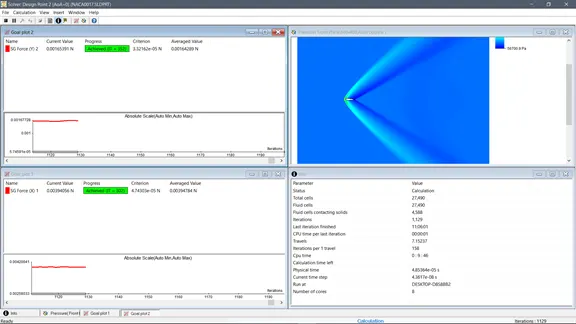
Then rum the simulation and in the Preview window we will insert Pressure Plot and Goal Plots for Surface forces in X and Y direction i.e drag force and lift force , and also Info. We will check that Plots converges over time and compare Current Value and Average Value. Once if you feel sufficient iterations are done and values have converged stop the simulation and save the results.
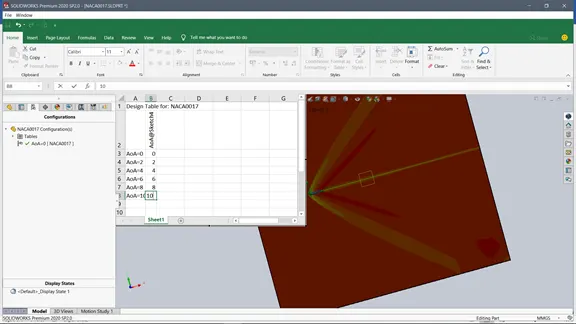
Now we have to run simulations for changing angle of attacks. It will be Parametric simulation with AoA parameter changing. For this we will insert a Design table and select AOA design parameters and create Configurations for all the angles of attack.
Then we will Create a Parametric Simulation and under input variables select Add Design Table Parameter and select AoA@Sketch4 parameter.
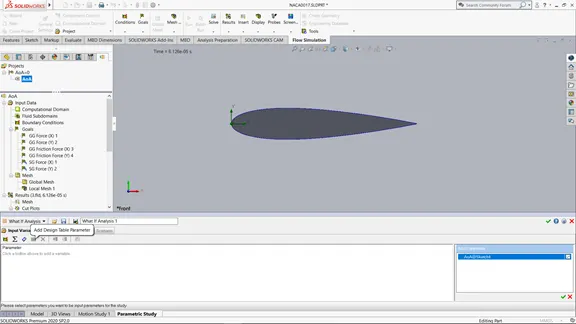
Then we will add discrete values of 0, 2, 4 ,6 ,8 and 10.
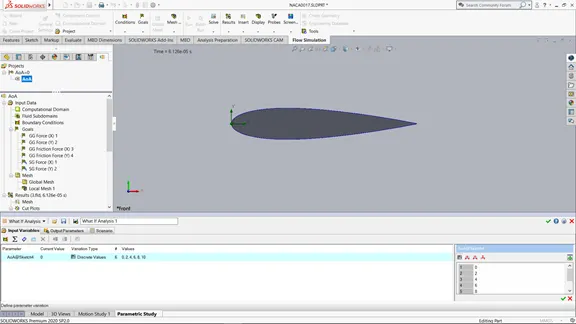
Then under out Parameters we will add all Goals and all Results .And then in Scenario run the simulation.
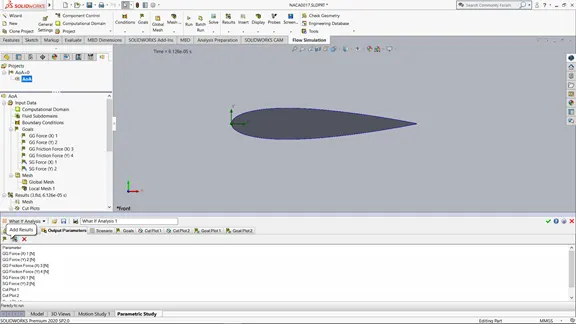
So now Preview window has to be monitored for every design point i.e for every Angle of Attack.
For Design point 1, AoA=0.
For Design point 2, AoA=2.
For Design point 3, AoA=4.
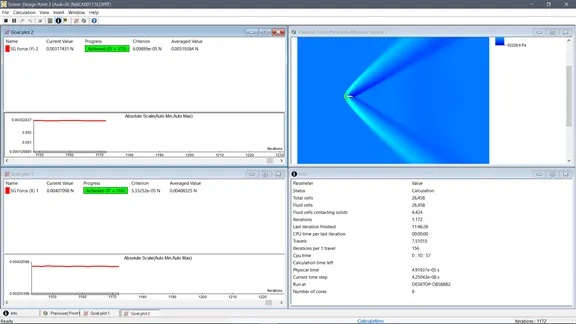
For Design point 4, AoA=6.
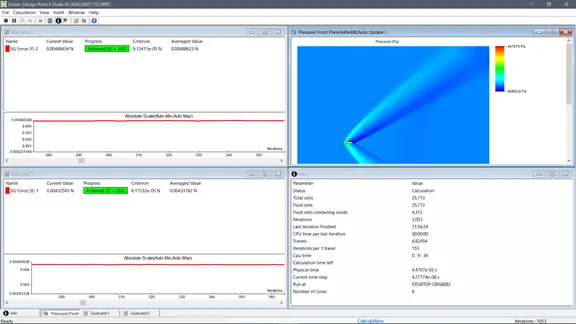
For Design point 5, AoA=8.
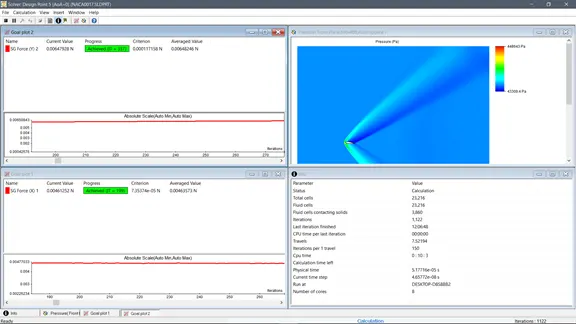
For Design point 6, AoA=10.
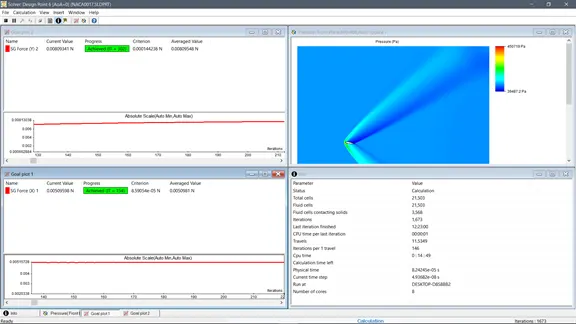
Then once everything is done we will check in Scenario window if all Design points have finished simulation.
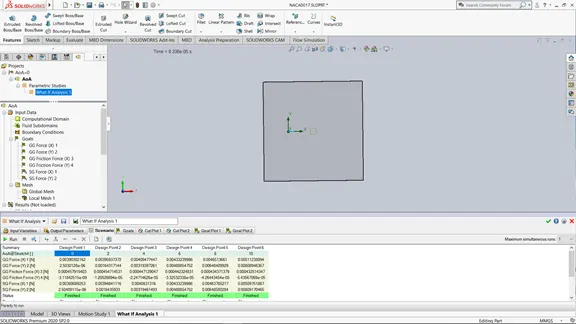
And Save the Goal Plots and Cut Plots.
Results:
Cut Plots:
1) AoA=0 ,Design Point 1
Pressure Plot
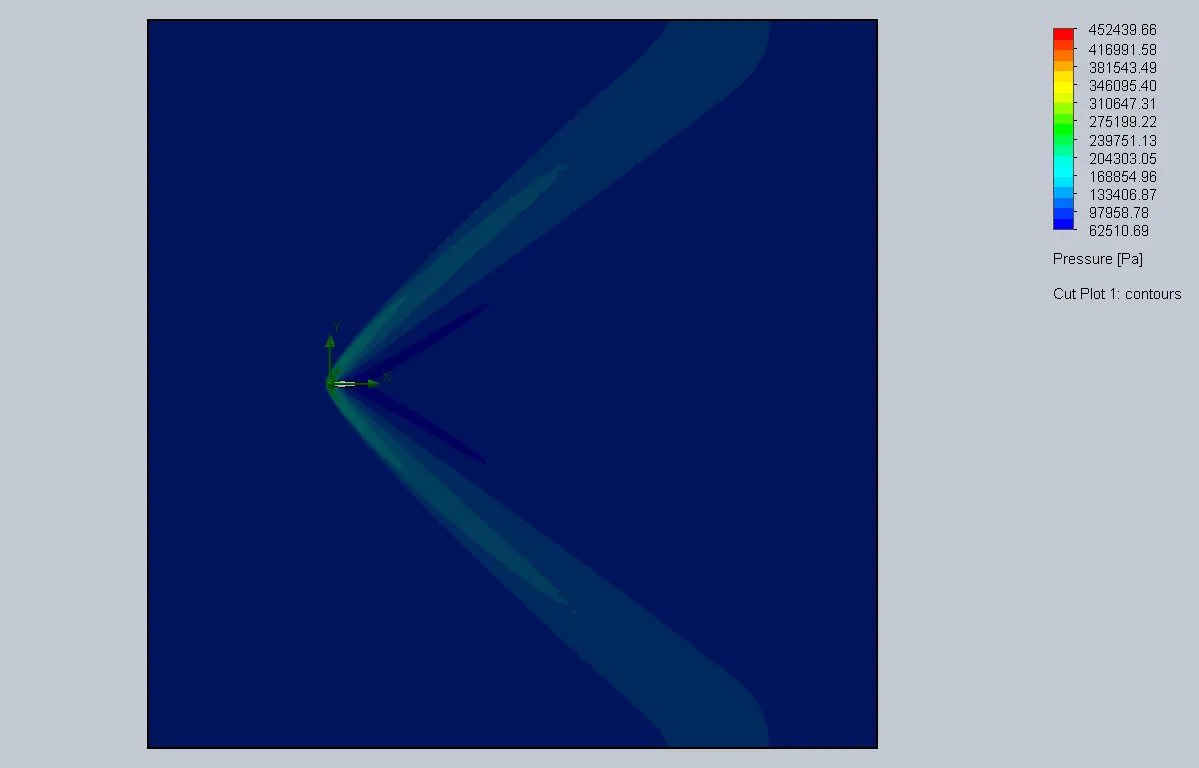
Here we can see equal pressure is generated on upper as well as lower side of airfoil thus lift is almost Zero. And lower pressure behind airfoil causes drag.
Velocity Plot
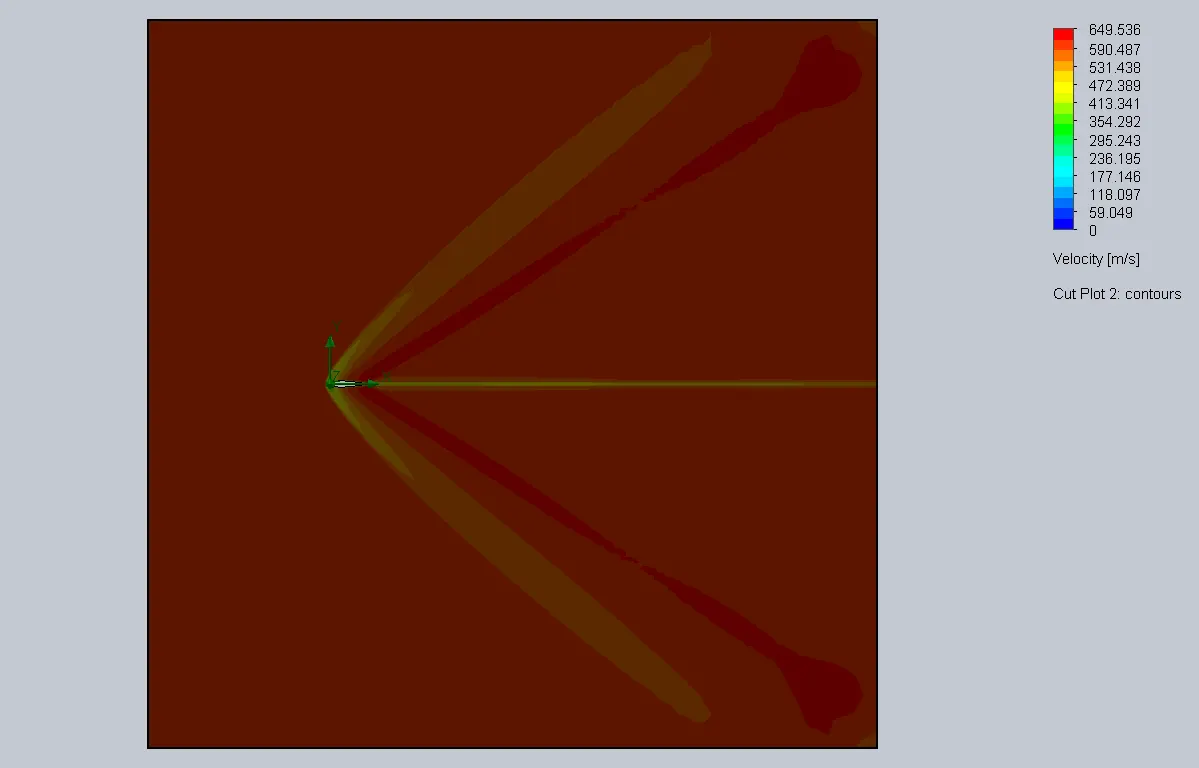
We can see even velocity distribution around the airfoil and thus no lift is produced.
2) AoA=2, Design Point 2.
Pressure Plot
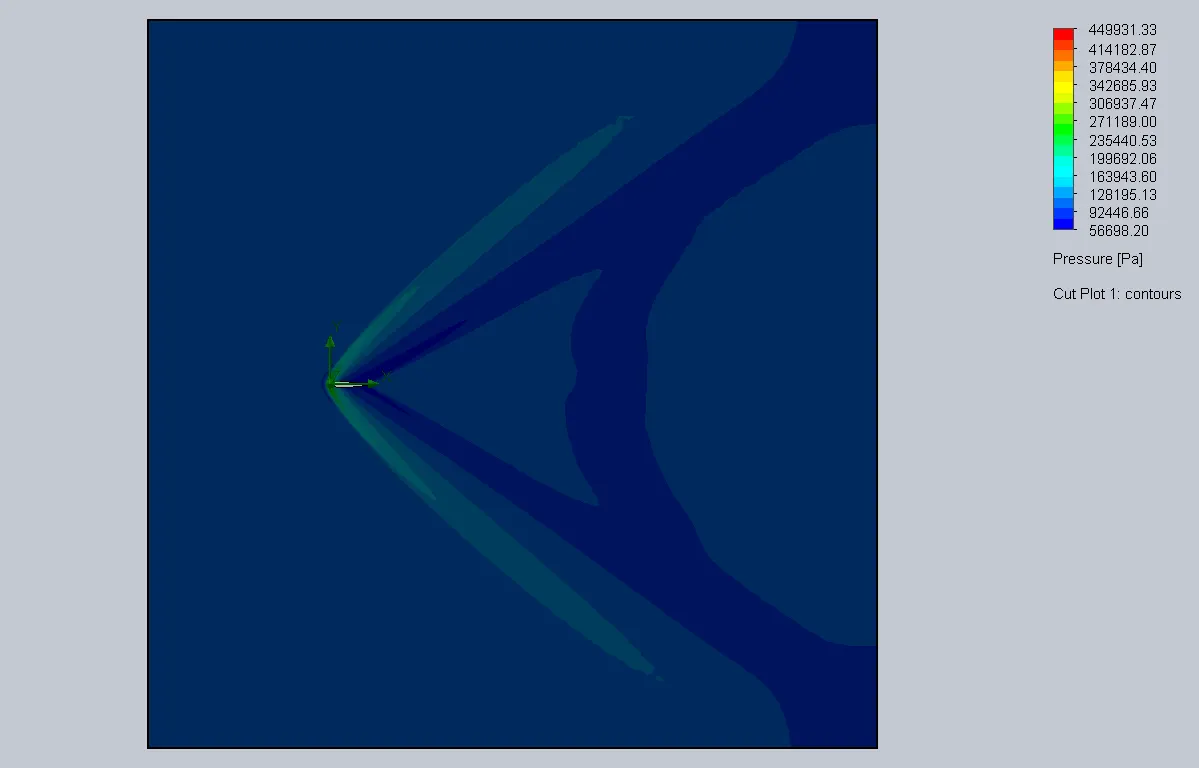
Here we can see pressure distribution is uneven. Pressure on lower surface of airfoil is comparatively higher than on the upper surface. This causes lift. For smaller angle of attack lesser lift is produced. Drag force is also increased but by smaller magnitude.
Velocity Plot
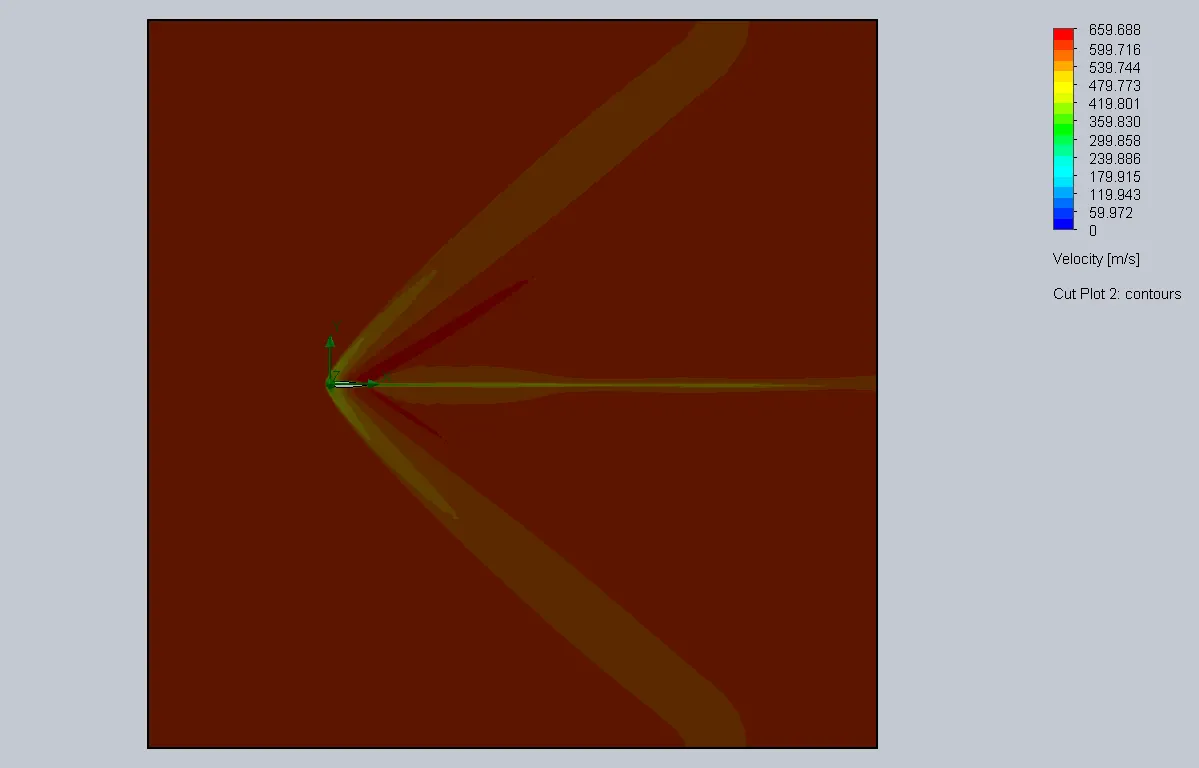
Here velocity on lower surface is lower than on higher surface which leads to pressure difference causing lift.
3) AoA=4 , Design Point 3.
Pressure Plot
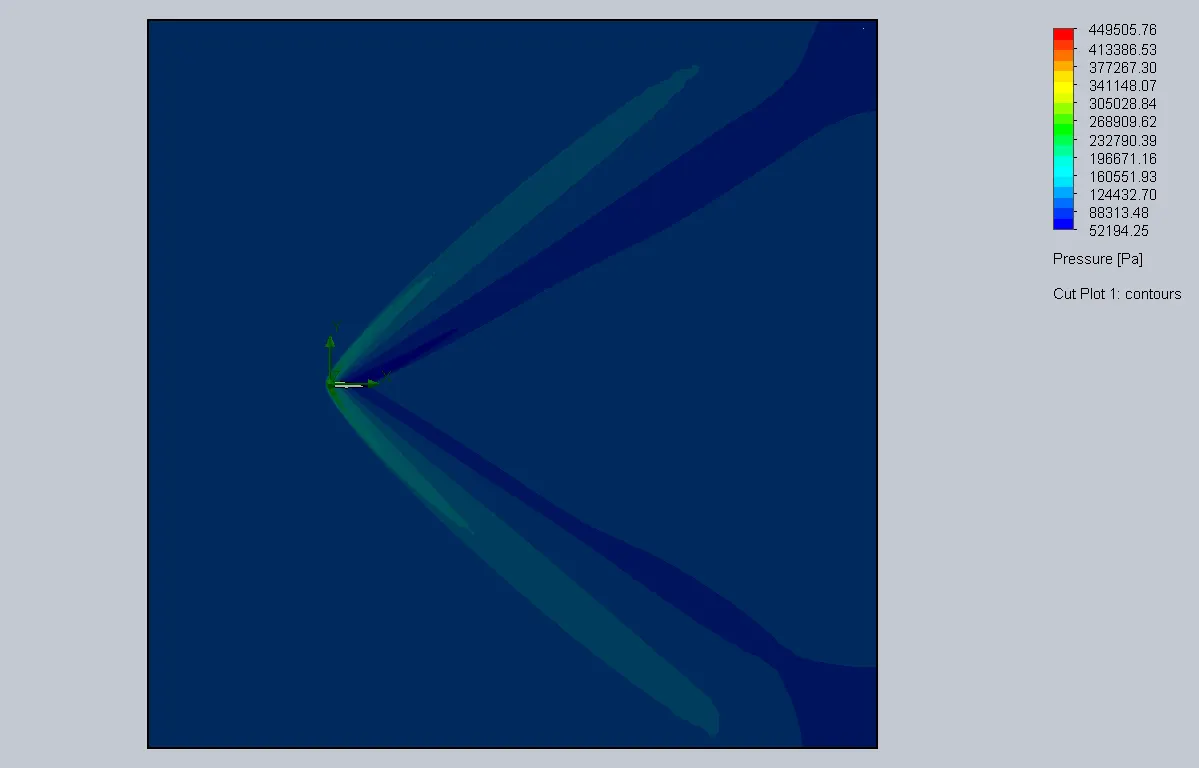
Here we can the difference further increases causing more lift force.
Velocity Plot
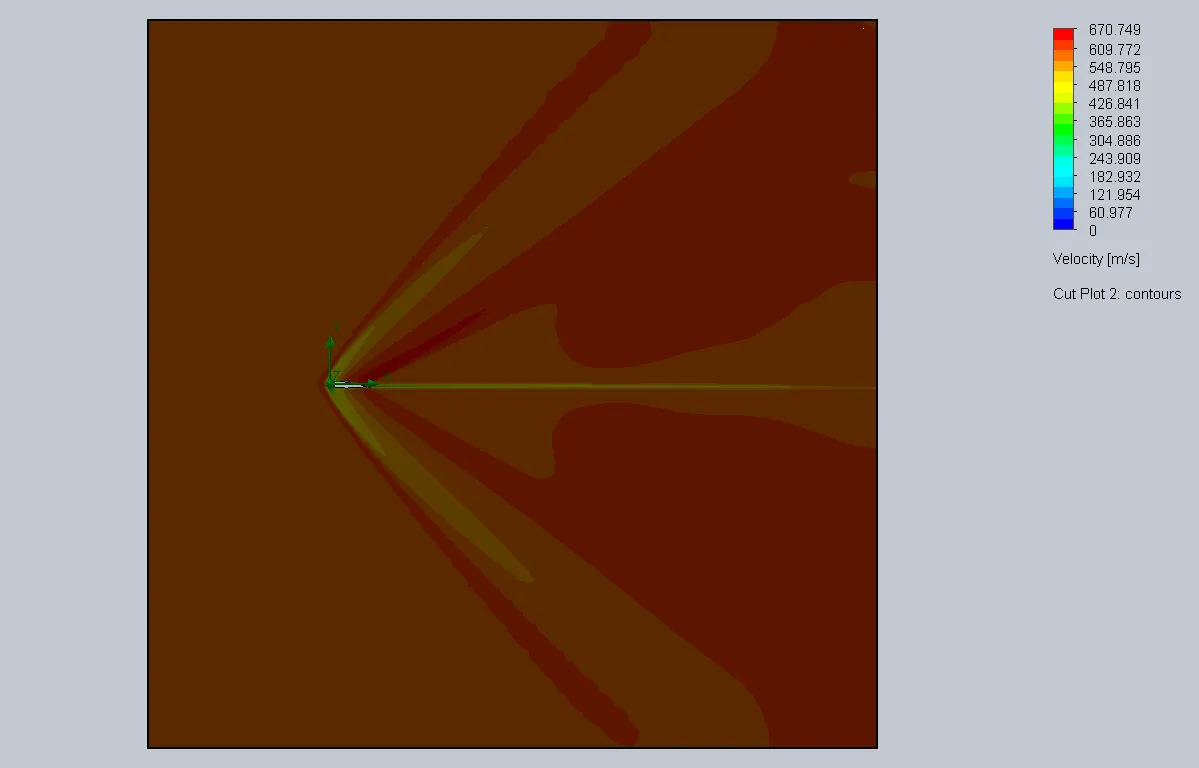
Similarly velocity difference increases causing increase in lift force.
4) AoA=6 , Design Point 4
Pressure Plot
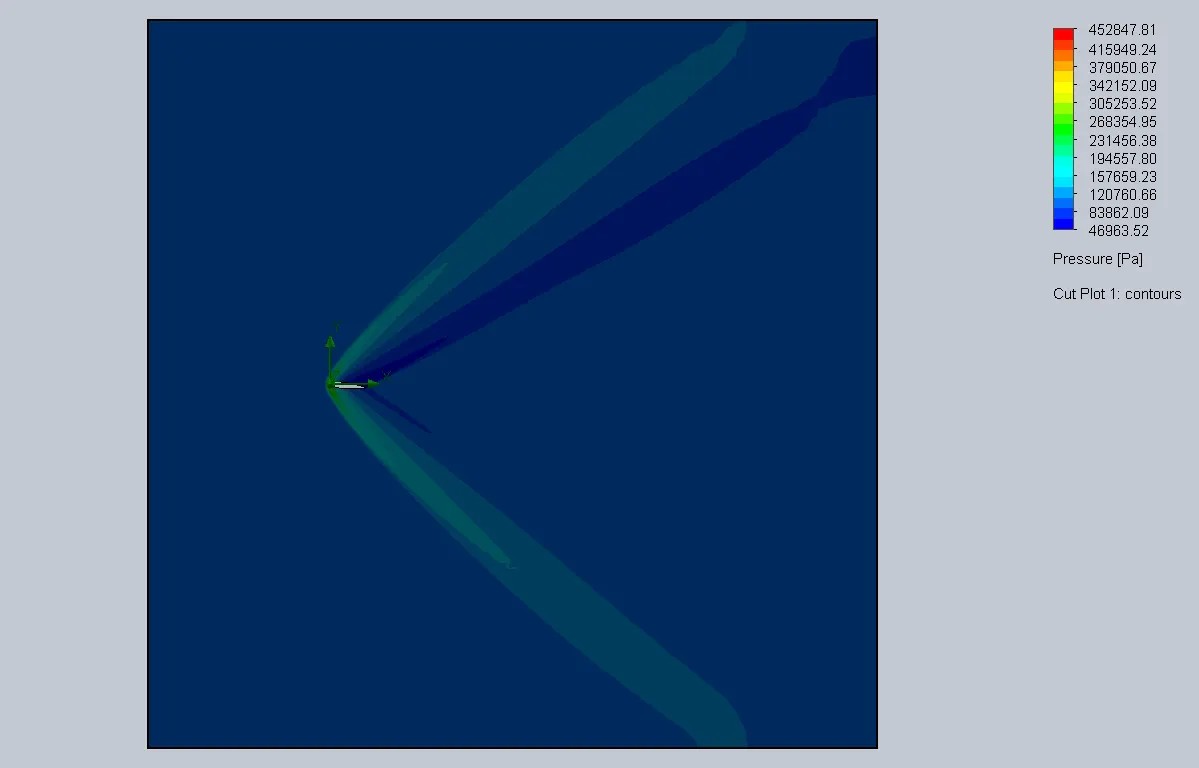
Velocity Plot
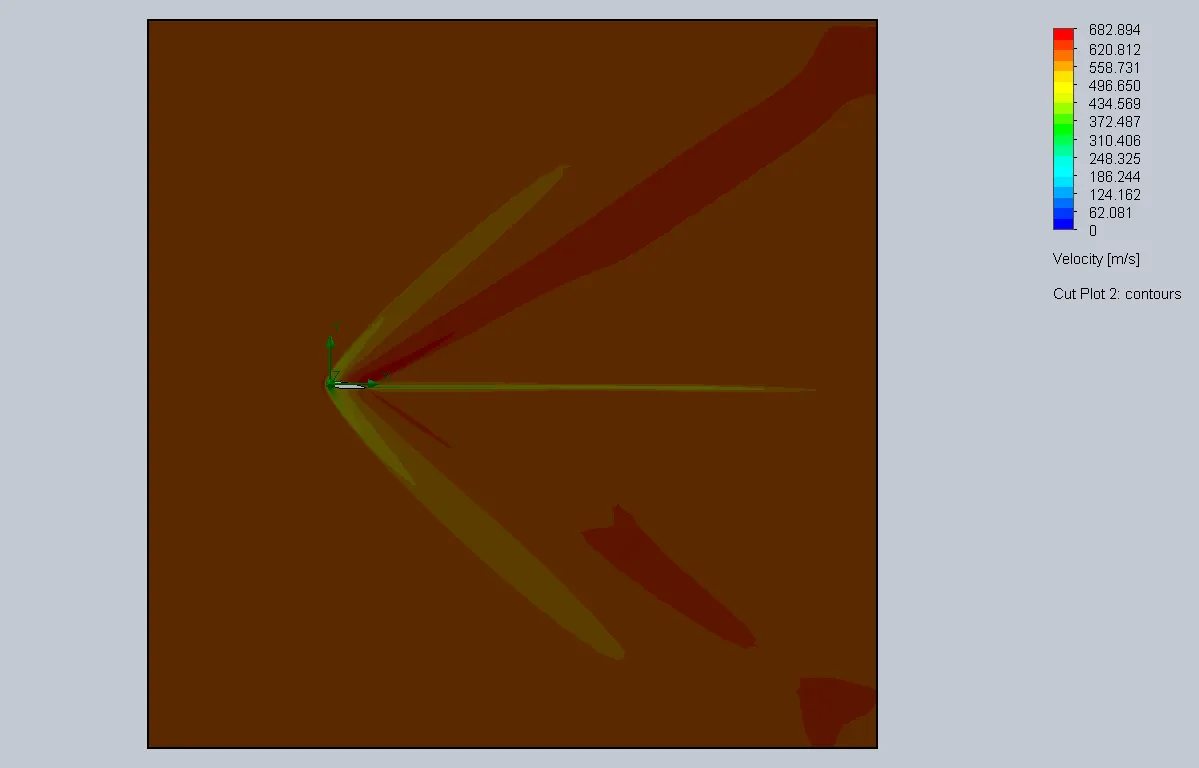
5) AoA=8 , Design Point 5.
Pressure Plot
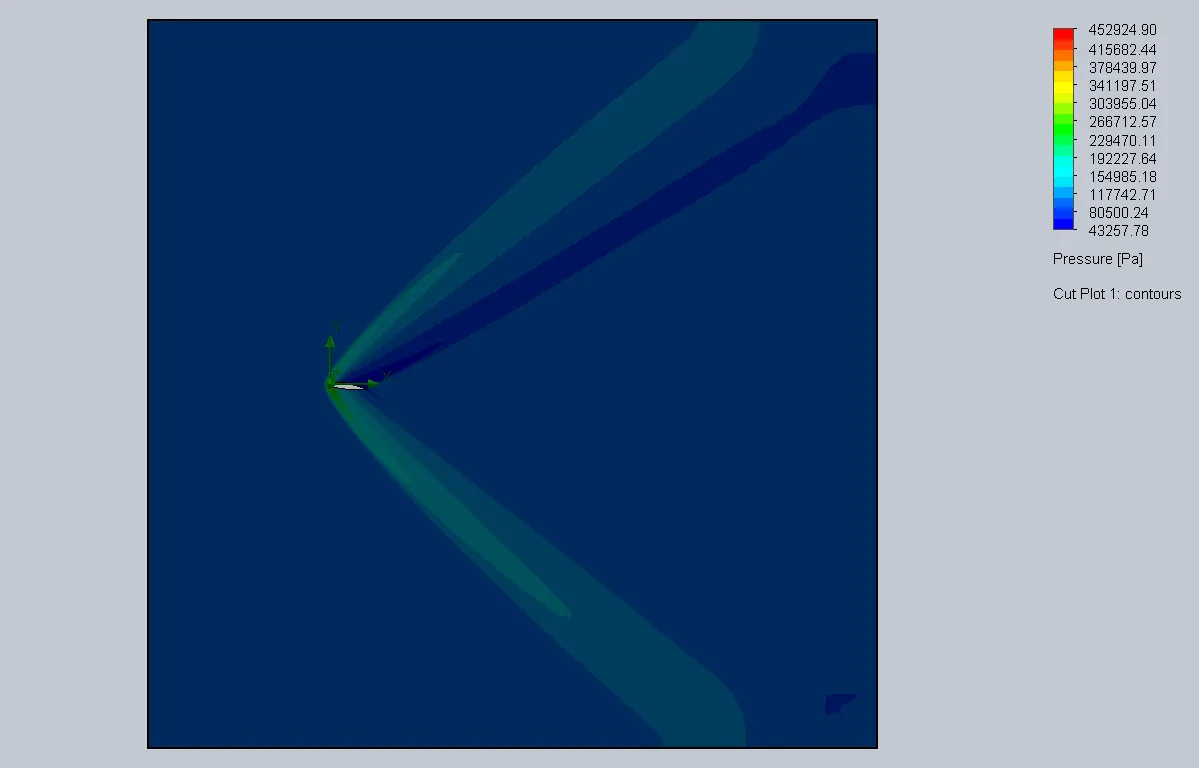
Velocity Plot
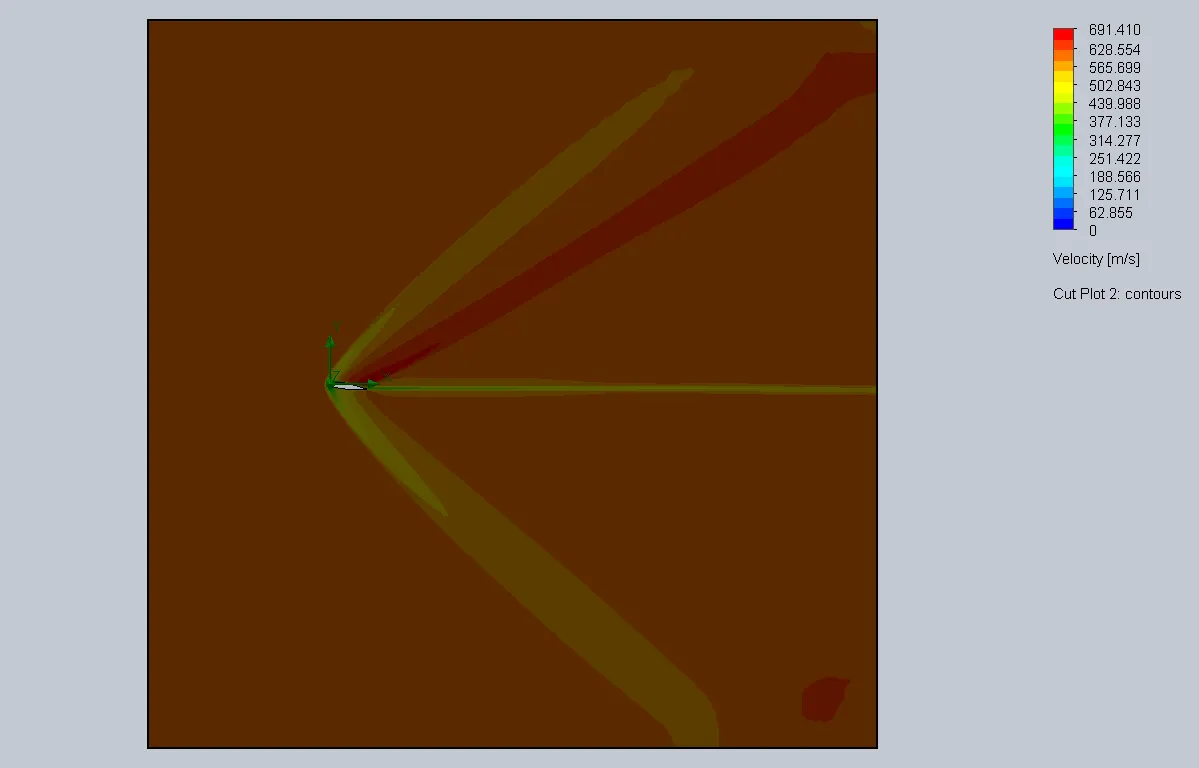
6) AoA=10 , Design Point 6.
Pressure Plot
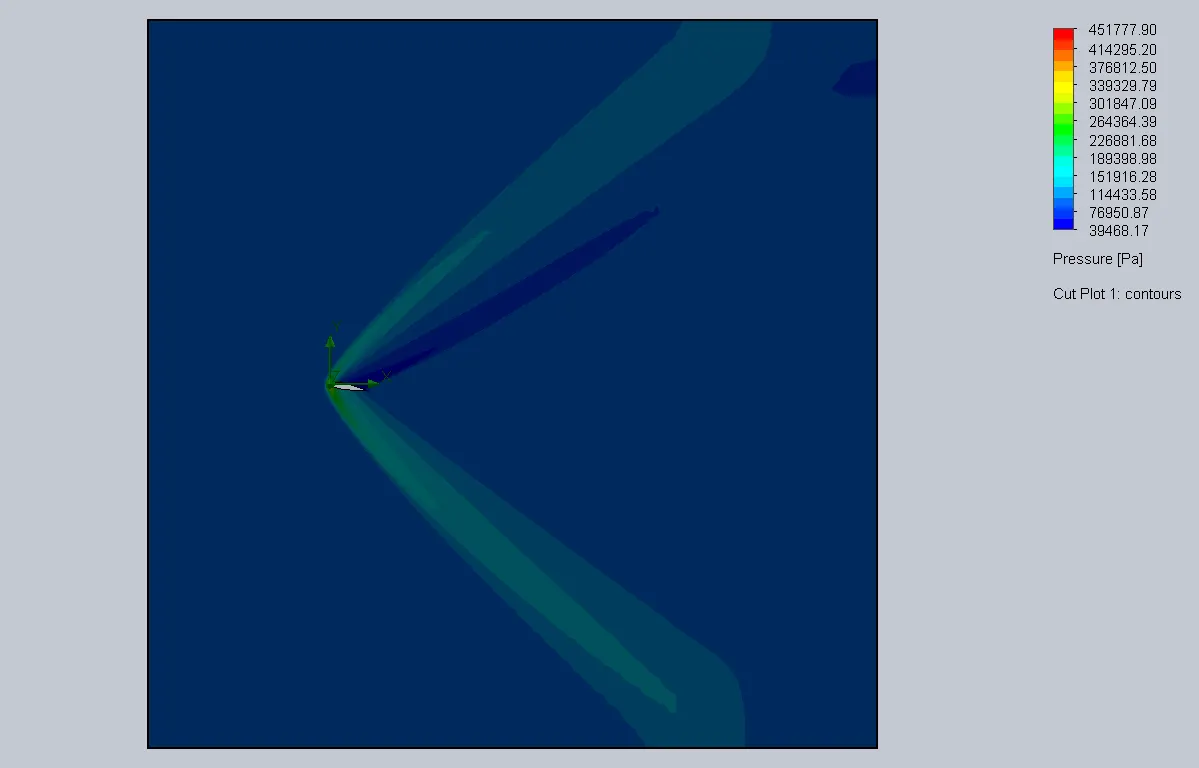
Velocity Plot
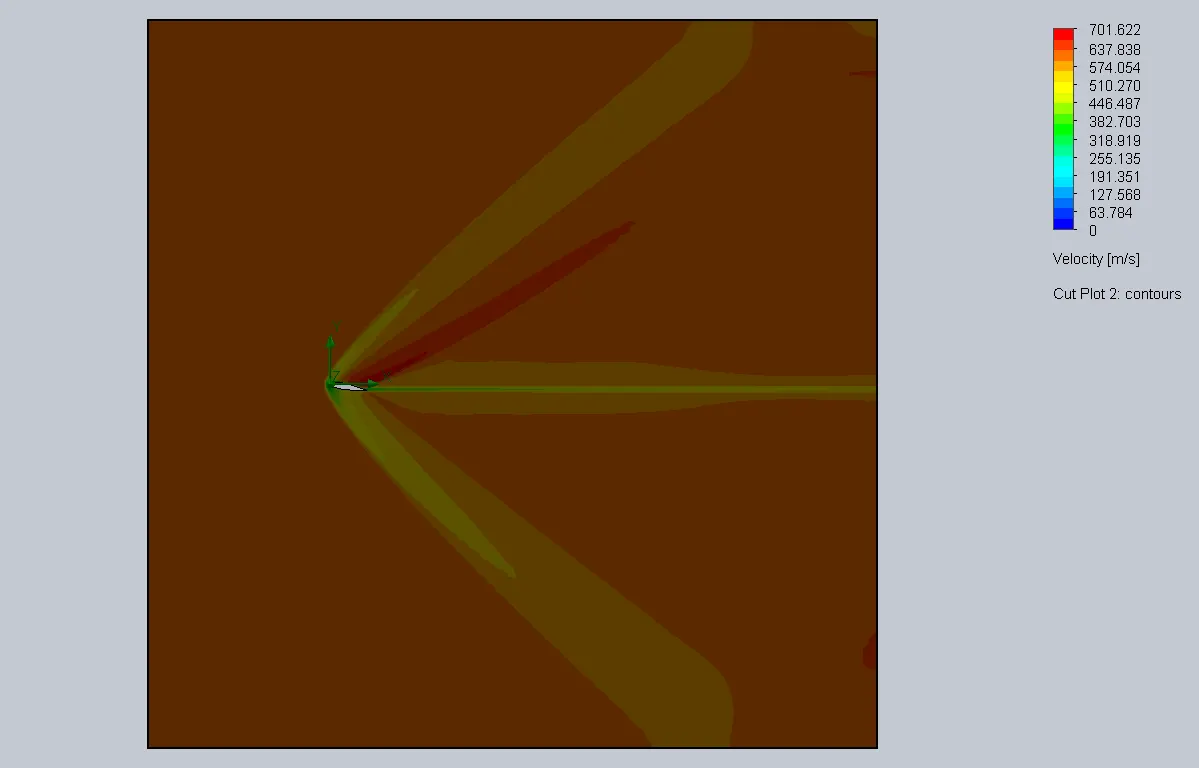
Here it is evident that as angle of attack increases the differences in pressure and velocity increase causing an increase in lift forces and drag forces.
Goal Plots:
To better understand trend in Goal Plots we will create a table of Values for Goal Plots for every design point.

Here we can see increase in forces as we increase Angle of Attack.
Here, SG Force (X) 1 is Drag force
And SG Force (Y) 2 is Lift Force in Newtons.
We can see lift and drag forces forces increasing with increase in Angle of Attack.
To better understand the trend we will Plot graph of Drag Forces and Lift Forces vs Angle of Attack.
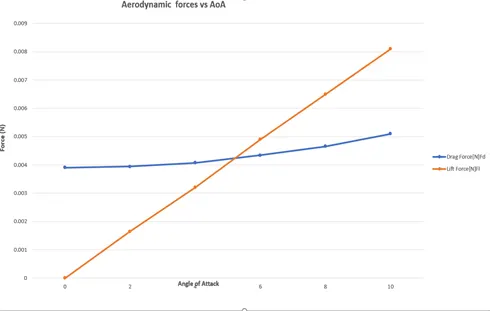
The rise in Forces can be seen with rise in Angle of Attack.
Now further we can calculate CL,CD and CL/CD to better understand the change.
CL=2 FL / ρ.A.v2
CD=2 FD / ρ.A.v2
CL/CD
CL = Lift coefficient
CD = Drag Coefficient
FL = Lift Force
FD = Drag Force
ρ = Density kg/m3
=1.225 for Air
A=Area of airfoil= 0.12 mm2
v=600 m/s
We can do these calculation in Excel and plot CL,CD And CL/CD vs Angle of attack.
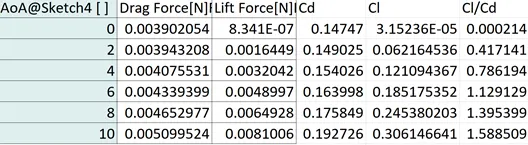
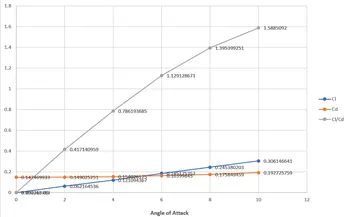
CL/CD = L/D i.e the Lift to Drag ratio.
We can see CL/CD increasing with Angle of Attack.
For max CL/CD the angle of attack is Stall angle and further the ratio decreses.
In this case Stall angle is not achieved.
Conclusion:
It can be seen that as Angle of Attack increases the Lift Forces and Drag Forces increases.
The increase in Drag force is gradual while increase in Lift Force is with much greater slope.
References:
wikipedia.org
grc.nasa.gov
airfoiltools.com
web.mit.edu