Linear Convection for varying number of nodes
AIM: Simulate linear convection by varying the nodes along the length.
Given Data:
Numerical solution to the One-dimensional Linear Convection equation.
1. Assume that the domain length is L = 1m
2. The initial velocity profile is a step function. It is equal to 2m/s between x= 0.1 and 0.3 and 1m/s everywhere else
3. Use first-order forward differencing for the time derivative
4. Use first-order backward/rearward differencing for the space term.
5. Constant convection coefficient, c = 1 m/s
6. Time step, it = 0.01
7. Simulation run time, t = 0.4 seconds.
The equation for the one-dimensional convection equation
`(delu)/(delt)=-c (delu)/(delx)`
MATLAB code
close all
clear all
clc

L = 1;
n = input ('Number of nodes =');
c = 1;
x = linspace(0,L,n);
dx = L/(n-1);
x_start = 0.1;
x_end = 0.3;
n_start = round((x_start/dx)+1);
n_end = round((x_end/dx)+1);
%calculation
%Creating an array of u as per the given values
u=1*ones(1,n);
u(1) = 1;
u(n_start:n_end)=2;
dt=0.01;
%boundary conditions
uold = u;
u_initial=u;
t=0.4;
ct=1;

%time marching solution
nt=t/dt;
%time loop
for k=1:nt
    %space loop
    for i =2:n
        %first order backward differencing for the space term and froward
        %differencing for the time term
        u(i)=uold(i)-(c*dt/dx)*(uold(i)-uold(i-1));
    end
    uold=u;

    %plotting
    plot(x,u,'color','b')
    hold on
    grid on
    plot(x,u_initial,'color','r');
    xlabel('Domain length')
    ylabel('velocity')
    legend('final velocity','initial velocity');
    axis([0 1 0 2])
    pause(0.03)
    M(ct)=getframe(gcf);
    ct = ct + 1;

end
movie(M)
videofile = VideoWriter('linear_convection.avi','Uncompressed AVI');
open(videofile)
writeVideo(videofile,M)
close(videofile)
Explanation
- The above program was written for the different nodes point [20, 40, 80, 160].
- First, we will declare all the necessary inputs for the linear convection including the number of grid points.
- Time step is consider the value of dt hence the time step (dt) = 0.01. The initial velocity profile is given as a step function which is equal to 2m/s between x=0.1 and x=0.3 and the rest is 1m/s, size of the domain is denoted by x where we use the linspace function to specify the interval.
- Grid size is equal to the distance between their adjacent modes. i.e. dx=L/(n(i)-1).
- Now we will define the x_start and x_end as 0.1 and 0.3 respectively and creating array at nodes for velocityis 1m/s as 'u = ones(1,n(i))' .
- Evaluating the noes at the start and end for the various value of i, i.e n_start(i) and n_end(i), function 'round (a)' and 'round(b)' are each element of a and b to the nearest integer value, same is used in the program.
- Similarly, we will define the nodes at the velocity 2m/s i.e u(n_start(i):n_end(i))=2.
- As we know that t = 0.4s and the time step is dt the number of steps is dt the number of steps is calculated are allocated to variable -'nt' i.e time loop - "nt = t/dt". There are nt- time steps a for loop is introduced to calculate the value it gives nt.
- Inside time loop space loop is created to calculate the velocity at each node for each time step i.e from 2nd node to end node by backward differencing.
- After calculating the space loop immediately update the old velocity term. Hence time step loop is then completely executed. Then a final velocity profile is plotted on the same plot where the initial velocity profile is plotted for better comparison.
At node =20
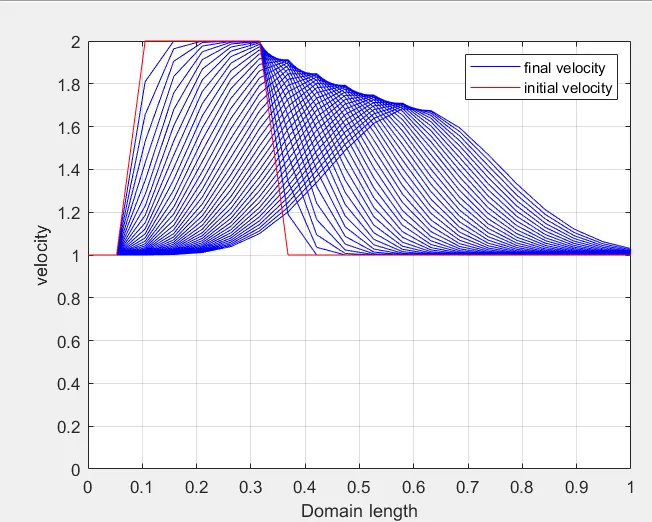
The above graph is generated at n=20. The velocity profile is moving from left to right. The red color profile represents the original velocity profile and the blue color profile is the final velocity profile. As the profile moves from left to right, it gets smoother and the peak value of velocity is continuously reducing.
At node = 40
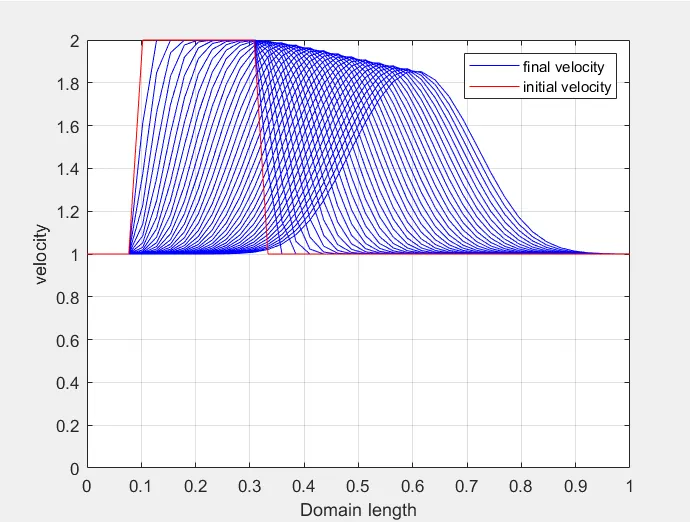
The above graph is generated at n=40. The velocity profile is moving from left to right. The red color profile represents the original velocity profile and the blue color profile is the final velocity profile. As compared to the first graph, this graph is less smooth and its peak velocity did not decrease drastically as it did in the first graph.
At node = 80
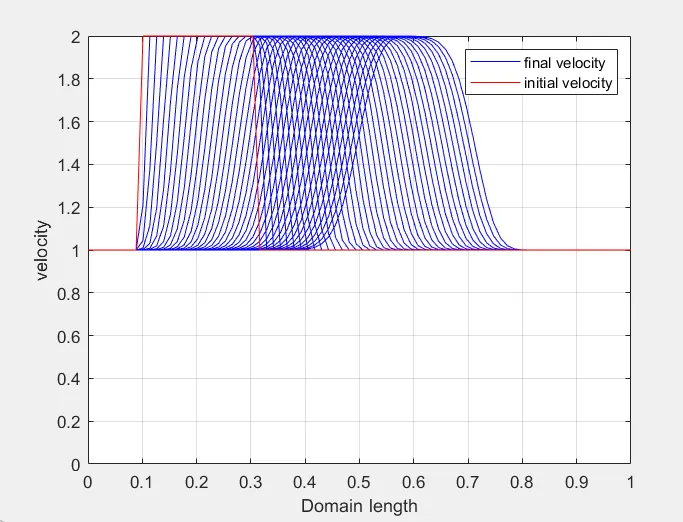
The above graph is generated at n=80. The velocity profile is moving from left to right. The red color profile represents the original velocity profile and the blue color profile is the final velocity profile. In this graph, we observe that the sharpness of the square wave is maintained for a longer time as compared to the first two graphs. The peak value of the velocity is almost maintained till the final profile.
At node = 160
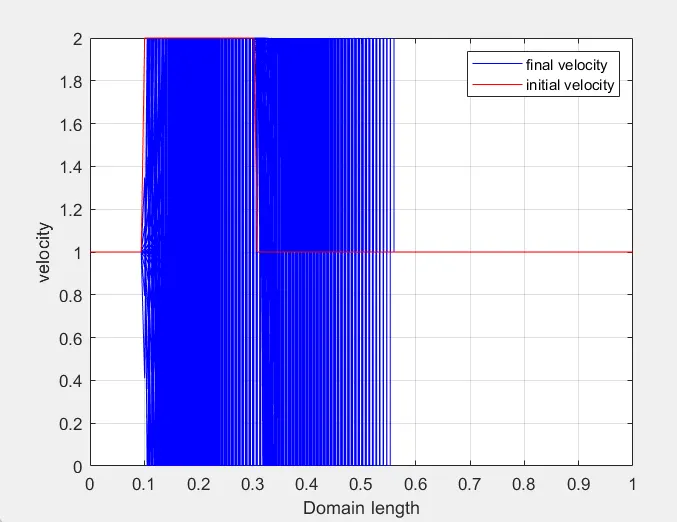
The above graph is generated at n=160. The velocity profile is moving from left to right. No square wave is generated in this graph. Here, we see a lot of wiggles and oscillations. The solution is unstable.
CONCLUSION
- Four graphs were plotted by using four grid points. At first, the velocity profile is a sable and more square waves from increasing the number of grid points from 20 to 80.
- For 160 grid points, the solution becomes unstable, the square profile is completely lost and the graph starts oscillating.
- This shows that there is a limit that how much fine gride we can use to get the solutions. The finer the grid the better the solution will be but there is a limit to the finer grid size, the solution will become unstable if made fine above a certain limit.