Fuel Cell Model (Built-in Simulink Model) Simulation & Explanation
OBJECTIVES:
For the 6 kW 45 V D.C. Fuel Cell Stack built-in model in MATLAB:
- Explain the working principle of the model in detail.
- Simulate the model and explain the results.
- Explain the voltage and current characteristics in your resultant graph.
SOLUTIONS:
Solution to Objective 1:
Working Principle of a basic Fuel Cell: Like a Battery, a Fuel Cell is also an electrochemical device that generates electrical energy/power by converting the chemical energy of the fuel into electrical energy. This conversion of chemical energy to electrical energy also, like a Battery, takes place through electrochemical processes. The electrical energy output is generally in the form of DC power. However unlike the Battery, the fuel and the oxidant (integral part of any electrochemical process) are stored outside the cell. This fuel and oxidant are continuously and separately supplied to the positive electrode and the negative electrode of the cell. The highlighting difference between batteries and fuel cells is that batteries produce electrical energy from stored chemical energy which require frequent recharging, while Fuel cells keep supplying electrical energy as long as the fuel is supplied.
The basic working principle of Fuel Cell is opposite to that of electrolysis of water. In electrolysis of water, water decomposes to form hydrogen and oxygen while in fuel cells, hydrogen and oxygen combine to form water and electricity.
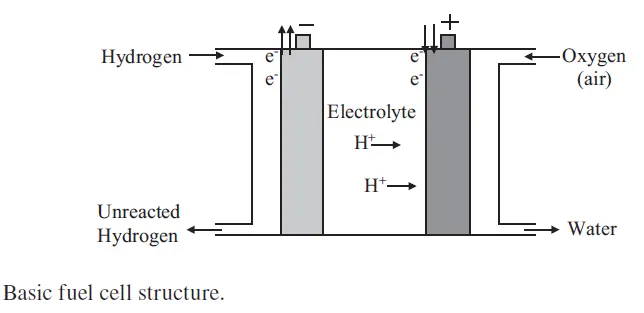
Basic Fuel Cell Structure
Working of the 6 kW 45 Volts DC Fuel Cell Stack Simulink Example/Demo Model: In this Demo Example Model in Simulink, there is an attempt to supply current to an RL Load using the Fuel Cell Stack as the Voltage Source and controlling the Fuel Cell Stack operation to efficiently deliver the required amount of current by controlling the Flow Rate of Fuel into the Fuel Cell Stack.
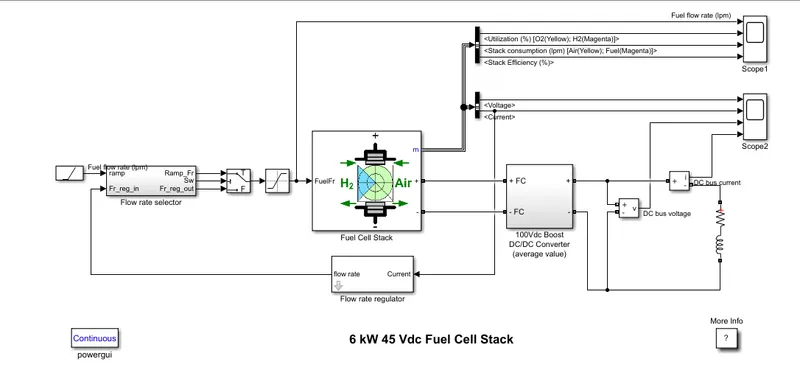
Simulink Demo Model for demonstration of applicability of a Fuel Cell Stack (6 kW,45 V DC)
As per the Parameters set in the Fuel Cell Stack Block, the Fuel Cell Stack is rated at 6 kW Power and 45 V DC and the type of Fuel Cell used as a model to represent the required properties and characteristics is a PEM Type Fuel Cell. The parameters whose output data will be generated from Fuel Cell Stack Block are: Voltage (Potential difference across the Fuel Cell Stack), Current (Current flowing in the Fuel Cell Stack once connected to the load via the DC-DC Boost Converter),Fuel Cell Stack Efficiency, the Utilization of H2(Hydrogen) and O2(Oxygen) by the Fuel Cell Stack in percentage and the Consumption of H2(Hydrogen) and O2(Oxygen) by the Fuel Cell Stack to generate the required electrochemical potential difference. The electrochemical potential difference between the positive and negative terminal of the Fuel Cell Stack is generated using transfer and exchange ions involving the elements Hydrogen and Oxygen. Sometimes Platinum is also used in the Fuel Cell to enhance/accelerate the electrochemical reactions taking place within the Fuel Cell.
This particular Fuel Cell Stack has been modelled to take the Feedback of output current flowing in the RL Load and accordingly the Flow rate of the Fuel fed to the Fuel Cell Stack is controlled on basis of this output Load Current. The only exception when the operation of the Fuel Cell Stack doesn’t depend on the Load Current is at the very initial stage of operation when there is no current passing through the RL Load and the electrochemical potential difference between the negative and the positive terminal of the Fuel Cell Stack is on the basis of the behavioural characteristics of the PEM Based Fuel Cell Stack Model in Simulink. The Feedback Control of the Flow Rate of Fuel into the Fuel Cell Stack ensures efficient operation of the model and optimum utilisation of the Fuel as per the Load demands and the conditions.
The Fuel Cell Stack Block takes into input the Flow Rate of the Fuel and returns the data for Terminal Voltage across the Stack, Current flowing through the Stack, Stack Efficiency, Consumption (Air Consumption & Fuel Consumption) by the Stack, Utilisation of O2 (Oxygen) and H2 (Hydrogen) by the Fuel Cell Stack at various time instants.
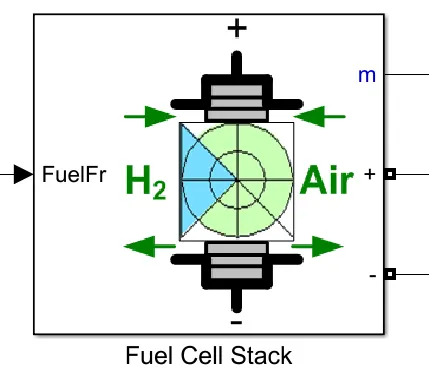
Fuel Cell Stack Simulink Block
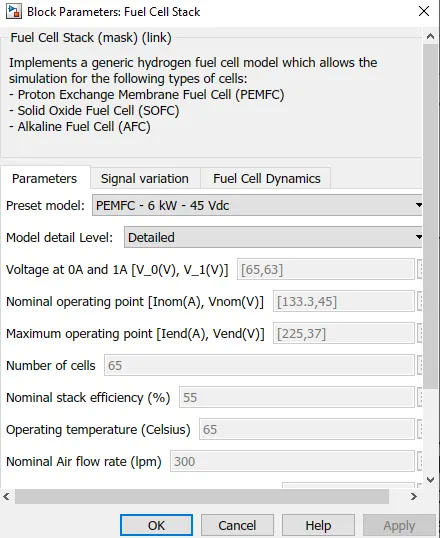
Fuel Cell Stack Block Parameters(1)
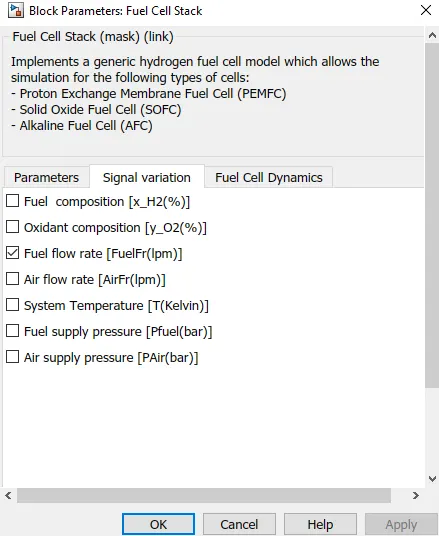
Fuel Cell Stack Parameters(2)
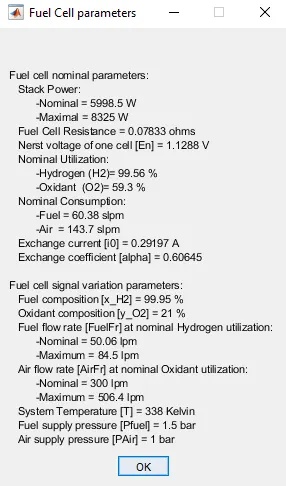
Fuel Cell Stack Paramters generated as per User Inputs in Other Parameters
Since the Output Voltage of the Fuel Cell Stack is quite low (rated at 45 V DC) for the given RL Load, therefore a 100 V DC-DC Boost Converter is used to convert the 45 V Rated input DC Voltage from Fuel Cell Stack into 100 V (average) rated DC output Voltage. A DC-DC Boost Converter sub-system is shown below:
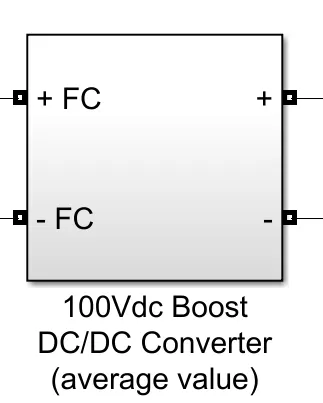
100 V DC-DC Boost Converter Sub-System/Sub-Model
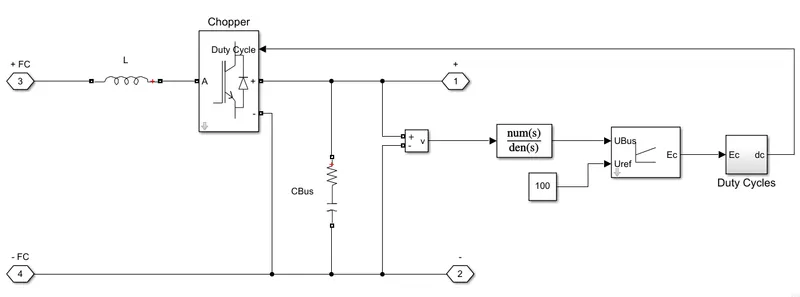
Modelling of the 100 V DC-DC Boost Converter used as a Sub-System/Sub-Model in the main Model
Now the RL Load (load having certain Resistance and Impedance) is now connected to the Voltage Source (combination of Fuel Cell Stack and DC-DC Boost Converter) and now the Current flows through the Load. The Voltage across the Load and the current being consumed by the Load is also measured by connecting a Voltage Measurement Block (Voltmeter) in parallel to the load and a Current Measurement Block (Ammeter) in series with the Load.
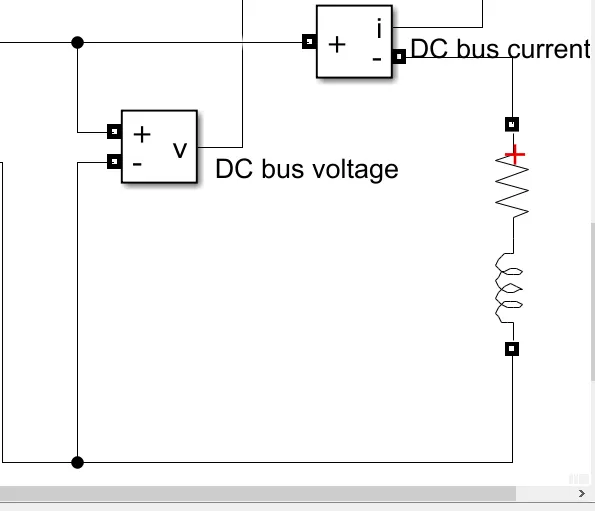
RL Load Arrangement(Load will have Resistance and Impedance) using the Series RLC Block along with Voltmeter and Ammeter connected to it.
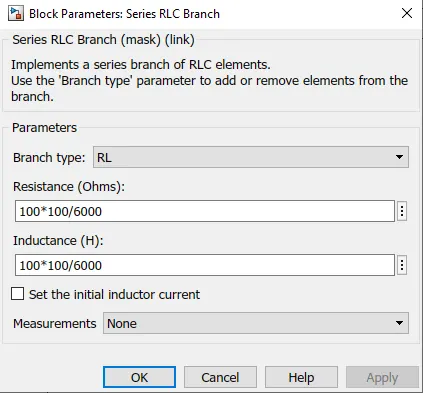
RL Load Parameters given to the Series RLC Block
For the given Simulation time, the Current and Voltage across the Load and the Fuel Cell Stack is connected to a common ‘Scope Block’ to differentiate between the Voltage and Current flowing in the Fuel Cell Stack and the Voltage and Current flowing in the RL Load.
Similarly the data for Fuel Cell Stack Efficiency, the Utilization of H2(Hydrogen) and O2(Oxygen) by the Fuel Cell Stack in percentage and the Consumption of Air & Fuel by the Fuel Cell Stack to generate the required electrochemical potential difference can be seen after simulation as they are connected to a common ‘Scope Block’.
At the very initial stage, when the RL Load has just been connected to the Fuel Cell stack via the DC-DC Boost Converter, the Fuel Cell Stack’s independent operation (not dependent on Current since it is not there at the first instance->time t=0) generates the Electrochemical Potential Difference based on the behavioural characteristics as of an independent PEM Fuel Cell Stack Block in Simulink and the Voltage across the RL Load is 100 V which is supplied by the 100 V DC-DC Boost Converter.
However, once the first wave of current has been passed through the RL load, the Electrochemical potential Difference in the Fuel Cell Stack, which developed independently when there was no current passing through the RL Load, now starts depending on the Load Current. The Output Current passing through the RL Load is now taken as the data for Feedback Control to the Fuel Cell Stack.
A Voltmeter and an ammeter is connected to the RL Load to find out the Voltage and the current across the RL Load. Similarly the Voltage and the Current of the Fuel Cell Stack can also be measured as per the Fuel Cell Stack Model Block Design in Simulink. The Voltage and Current across the Load and the Fuel Cell Stack is connected to a Common Scope Block and compared for various instances of time.
A Sub-system (Mask) Block named ‘Flow Rate Regulator’ has been created which takes input of the RL Load Current as Feedback and on basis of some values fed to relevant parameters to this Block, the corresponding Flow Rate of the Fuel is generated in the output which is then fed to a sub-system named ‘Flow Rate Selector’ into its input port 2.
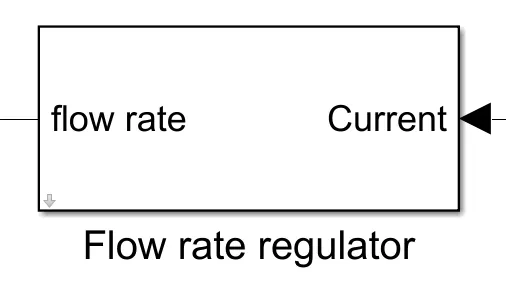
Flow Rate Regulator System set up using the Subsystem(Mask) Block
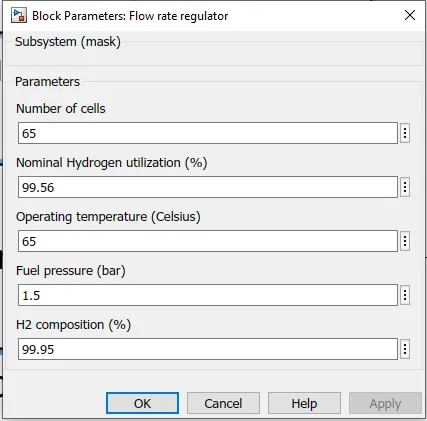
Parameters given to the Flow Rate Regulator Sub-System
Now a Ramp Block has also been initiated into this Model. The parameter values set into the Ramp Block are as follows:
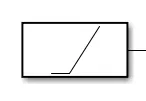
Ramp Block to be used for Flow Rate Control
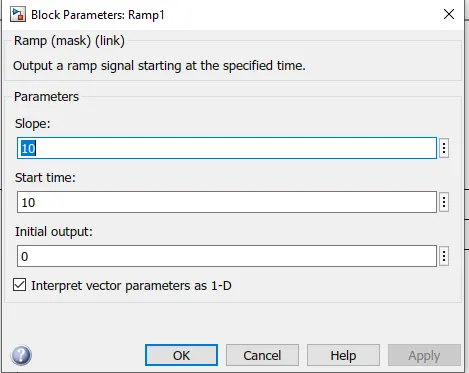
Parameters given to the Ramp Block for Flow Rate Control to Fuel Cell Stack
According to the values given to the parameters in this Ramp Block, the Flow Rate of Fuel into the Fuel Cell Stack will vary according to the following relationship:
Flow Rate at a particular Time Instant= 10 X (Time Instant) – 100.
The output of this Ramp Block which represents the Flow Rate of the fuel at a given time instant is now fed as an input to the sub-system named ‘Flow Rate Selector’ into its input port 1.
A sub-system has been created in the model which is named as ‘Flow Rate Selector’. The picture of the sub-system and its internal modelling is shown below:
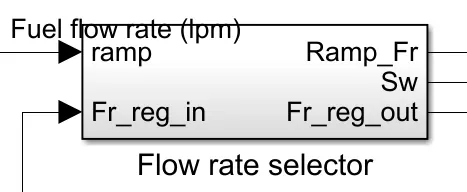
Flow Rate Selector Sub-System implemented in the model
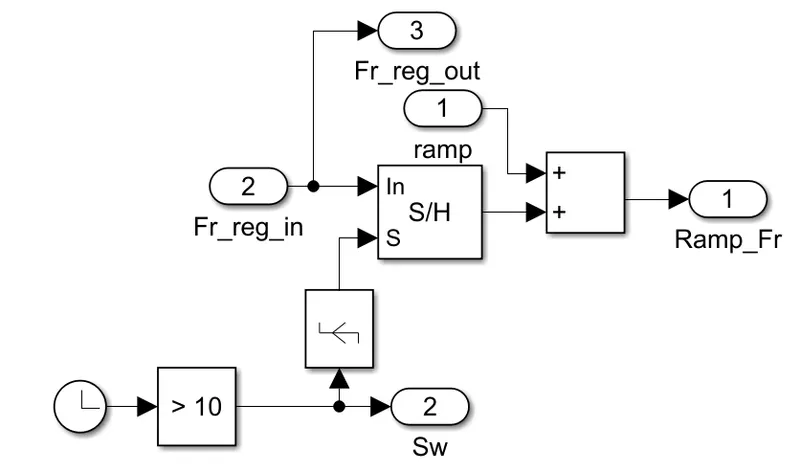
Flow Rate Selector Modelling inside the Flow Rate Selector Sub-System
The internal modelling of the ‘Flow Rate Selector’ sub-system has been done in such a way that if the Simulation Time or Time of Running the model exceeds the 10 time units, then the Flow Rate of the Fuel fed to the Fuel Cell Stack Block will depends on the parameters set in the Ramp Block connected as input to the ‘Flow Rate Selector’ sub-system AND on the other Flow Rate Relationship defined by the value of Current Flowing in the RL Load.
Within the ‘Flow Rate Selector’ sub-system, there has been 2 conditions set according to which the Flow Rate of the Fuel into the Fuel Cell Stack will be decided:
Condition 1-> If the Simulation Time/Time Units exceeds 10 Time Units, then the Flow Rate will depend both on the relationship set by the parameters in the Ramp Block and the Feedback Current which corresponds to the Load (RL) Current.
Flow Rate(@ Time Unit > 10) = [10 X (Time Instant)-100] + f(Load Current)
Condition 2-> If the Simulation Time/Time Units is lesser than or equal to 10 Time Units, then the Flow Rate will depend only on its relationship with the Feedback Current which corresponds to the Load (RL) Current.
Flow Rate(@ Time Unit ≤ 10) = f(Load Current)
Now this ‘Flow Rate Selector’ sub-system is now connected to a ‘Saturation’ Block where the Upper Limit (Maximum Limit) and the Lower (Minimum Limit) for the Flow Rate emanating from the ‘Flow Rate Selector’ Block is set. The Maximum and Minimum Flow Rate Limits are set as follows:
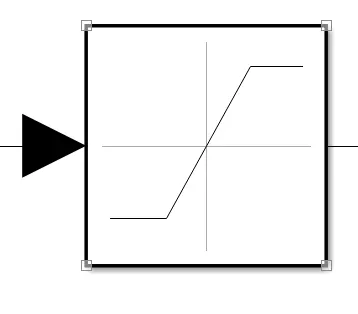
Saturation Block used to set the Maximum and the Minimum Limit for Flow Rate
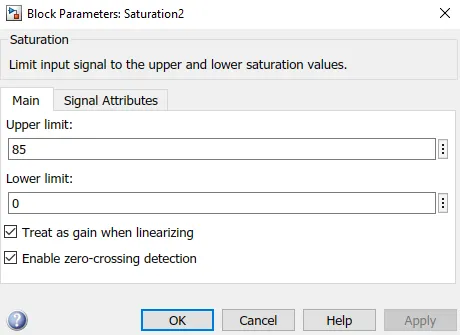
Maximum Limit and Minimum Limit set for Fuel Flow Rate to the Fuel Cell Stack
These are the limits set for the Flow Rate of Fuel that is fed to the Fuel Cell Stack. The Fuel Cell Stack will take this input of Flow Rate (within the Limits set by the Staruration2 Block) and the condition depending on the Simulation time and Load (RL) Current.
After taking input of the Flow Rate based on its maximum and minimum limits, Simulation Time and Load (RL) Current, the Fuel Cell Stack generates the required potential difference across its positive and negative terminal and feeds current to the RL Load via the DC-DC Boost Converter.
Solution to Objective 2:
This 6 kW 45 V D.C. Fuel Cell Stack built-in Simulink Model is now simulated for the time already set as default->20 time units and the results from the Scope Blocks are as follows:
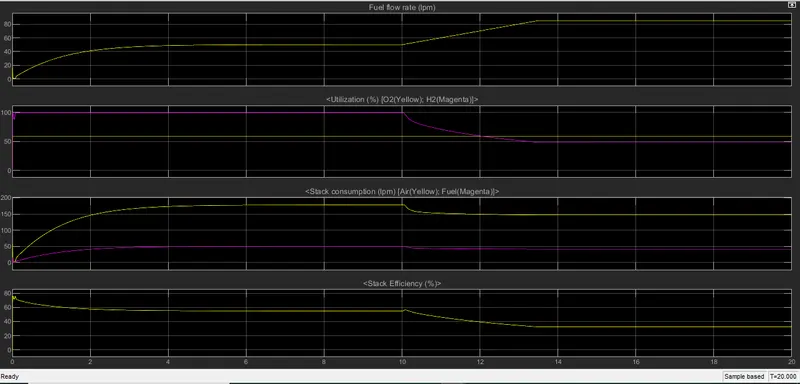
Variation of Parameters pertaining to the Fuel Cell Stack
The applicability of this particular Fuel Cell Stack Model is based around the fact that at all times, the Flow Rate of the fuel will depend on the RL Load Current output. But at the initial state, when the Fuel Cell Stack along with the DC-DC Boost Converter, has just been connected to the RL Load, and the current is about to pass through the Circuit (comprising of the Fuel Cell Stack, DC-DC Boost Converter and the RL Load), at that particular instant, the Flow Rate of the Fuel into the Fuel Cell Stack is decided by the characteristics and the parameters set to the Fuel Cell Stack because there the Output Current through the RL Load is yet to be generated and given as a feedback to decide the Flow Rate of Fuel into the Fuel Cell Stack. So the Flow Rate of the Fuel at the very initial state (time t=0) into the Fuel Cell Stack is independently decided by the Fuel Cell Stack based on the characteristics and parameters given to the Fuel Cell Stack.
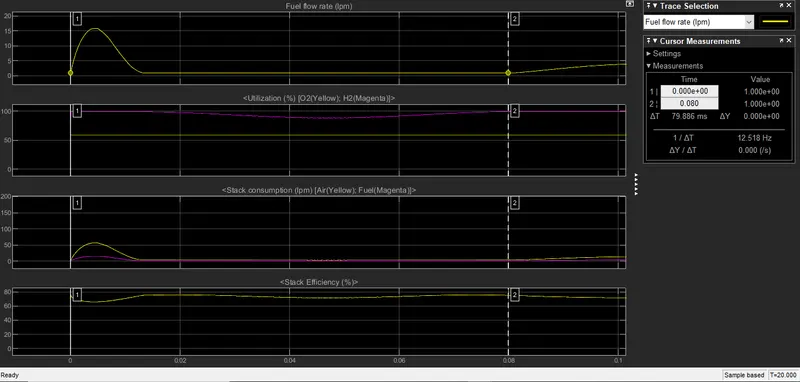
Fuel Cell Stack Parameters at the very Initial State of Operation when the data for Feedback Current hasn't reached the Fuel Cell Stack yet.
It can be seen from the plots there is a noticeable change in the profile of various parameters after the simulation time of 0.08 seconds or more precisely 0.079886 seconds. Since the Fuel Cell Stack behaviour has been modelled to behave according to the RL Load Current, but initially when the RL Load has been connected to the Voltage Source (comprising of the Fuel Cell Stack + the DC-DC Converter), the current is about to flow into the circuit and the RL Load, there is no data for RL Load Current to be sent as Feedback to the Flow Rate Regulator, hence until the time the Flow Rate Regulator gets the 1st RL Load Current Data and hence subsequently gets the RL Load Current Data, the Fuel Cell Stack operates independently and the Flow Rate into the Fuel Cell Stack depends on the characteristics of the Fuel Cell Stack, it’s internal Losses and various other parameters.
From the profile, it can be seen that there is noticeable change in the profile of the Flow Rate at approximately 0.08 seconds, which can be an indication that from 0.08 seconds, the Fuel Cell Stack starts operating on basis of Feedback Current from the RL Load as per the conditions set in the Flow Rate Selector Block and the Flow Rate Regulator Sub-system. Till 0.08 seconds, the Fuel Cell Stack operates independently.
On the basis of the performance of the Fuel Cell Stack during its independent operation (when its operation is not on the basis of the Feedback RL Load Current), the following conclusions can be formed:
- When the Fuel Flow Rate is constant at 1 lpm., the utilization of H2(in percentage) decreases at an increasing rate reaches a constant value and then increases at a decreasing rate. Basically the curve formed by H2 utilization, is like a bell curve turned upside down.

Pink Curve represents the Utilzation Percentage of H2 from 0 time unit to 0.08 time unit
- The utilization of O2 (in percentage) initially shoots up to around 59% (at t=0) and remains constant when the Fuel Flow Rate is constant at 1 lpm.
- The Stack Consumption (Air & Fuel) remains constant when the Fuel Flow Rate is constant at 1 lpm.
- The Stack Efficiency more or less remains constant with a very slight deviation in Stack Efficiency of about 0.303 % when the Fuel Flow Rate is constant at 1 lpm.
- The Fuel Flow (in lpm) Profile corresponds exactly to the Stack Consumption of Air (in lpm) Profile albeit the values are different for both these curves.
- The profile of Stack Consumption of Fuel (in lpm) has a bell-like curve when the Flow Rate of Fuel is not constant (within time t=0 to t=0.08 seconds) and becomes constant when the Flow Rate of Fuel becomes constant.
After the simulation time of 0.08 seconds, the Fuel Cell Stack starts responding to the RL Load Current and as per the condition set using the Fuel Flow Rate Selector Sub-system and the Switch Block. According to the Fuel Flow Rate Selector, apart from the time when the Fuel Cell Stack develops its electrochemical potential difference independently, when the simulation time is lesser than or equal to 10 seconds (t ≤ 10), the Flow Rate of Fuel in the Fuel Cell Stack will only depend on the RL Load Current Feedback:
When (t ≤ 10), Fuel Flow Rate = f (RL Load Current)
The behaviour of the Fuel Cell Stack (from its parameters), from t=0.08 seconds to t=10 seconds are as follows:
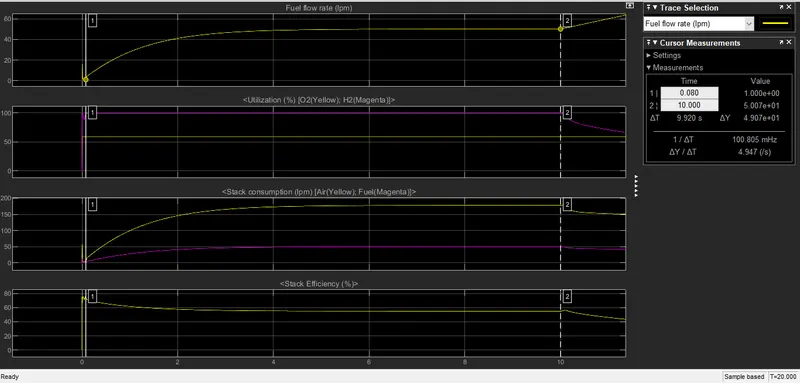
Fuel Flow Rate Profile and other Fuel Cell Stack Parameters from time=0.08 to time=10 seconds
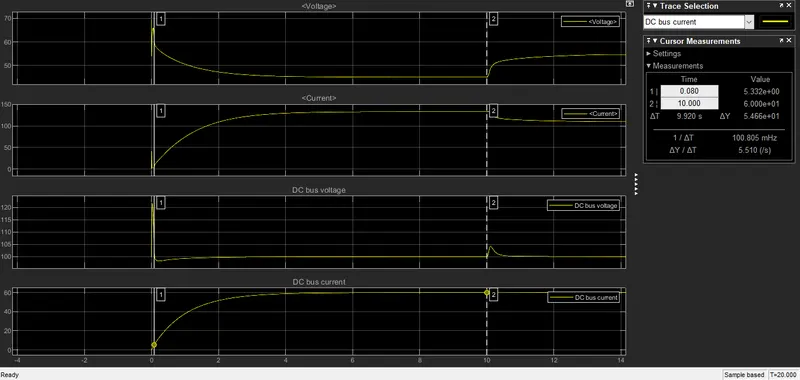
RL Load Current (DC Bus Current) Profile and other Voltage & Current Characteristics (Fuel Cell Stack & RL Load) from time=0.08 to time=10 seconds
From the above output plots (specifically focusing on the DC Bus Current and the Fuel Flow Rate), it can be concluded that the curve profile of the DC Bus Current (RL) is very similar to the Fuel Flow Rate Curve from the simulation time of 0.08 seconds to 10 seconds and hence it is proved that during this time frame, the Fuel Flow Rate into the Fuel Cell Stack is only dependent on the RL Load Current.
The following points can also be observed when the operation of Fuel Cell Stack is dependent on the RL Load Current Feedback:
- The Utilization (in percentage) of both O2 and H2 remains constant throughout this time period. The utilization of H2 after the independent operation of Fuel cell is 99.56 % which is the nominal value set in the Flow Rate Regulator Block.
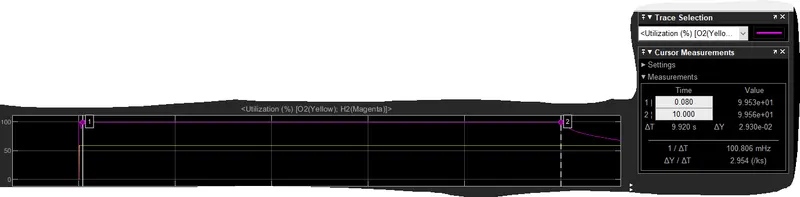
H2 Utilzation stays at 99.56% from approx. 0.08 seonds to 10 seconds
H2 utilization set to 99.56 % when Flow Rate only depends on Feedback Load Current
- The Stack Consumption (in litres per minute) of both Air & Fuel increases at decreasing rate (the slope for Air is much higher than Fuel) until it becomes constant and remains constant till the end of the time period (t=10 seconds).
- The Fuel Stack’s working efficiency decreases at a very slow rate. The reduction slope is nearly:
[(55-75.08)/ (10-0.080)]=[-20.08/9.920]=-2.02 % per time unit.
Therefore there is decrease of 2.02% of Stack efficiency per simulation time unit.
- The curve of the current flowing through the Fuel Cell Stack also has a similar profile to the RL Load Current Profile and Fuel Flow Rate Profile within this time frame (t=0.08 to t=10) although the values of the Current flowing in the Fuel Cell Stack is higher compared to the current flowing in the RL Load on account of the higher Voltage across the RL Load compared to the Voltage across the ends of the Fuel Cell Stack.
After the simulation time of 10 seconds, the Flow Rate of Fuel into the Fuel Cell Stack now not only depends on the Feedback of RL Load Current, but also on the parameters on the Ramp Block whose output signal is connected to the 1st input port of the Flow Rate Selector. According to the values set to the parameters in the Ramp Block, the Flow Rate varies according to the flowing relationship:
Flow Rate at a particular Time Instant= 10 X (Time Instant) – 100.
Now according to the conditions set in the Flow Rate Selector, if the simulation time exceeds 10 time units, then the Flow Rate of Fuel in the Fuel Cell Stack will depend both on the feedback RL Load Current as well as on the Linear Relationship set between Time and Fuel Flow Rate as set in the Ramp Block.
Flow Rate of fuel after simulation time of 10 time units:
When (t > 10), Fuel Flow Rate at a particular time instant = f (RL Load Current) + [10 X (Time Instant) – 100].
After 10 time units, there is a noticeable change in the behavioural patterns of the Flow Rate of the Fuel and its related parameters.
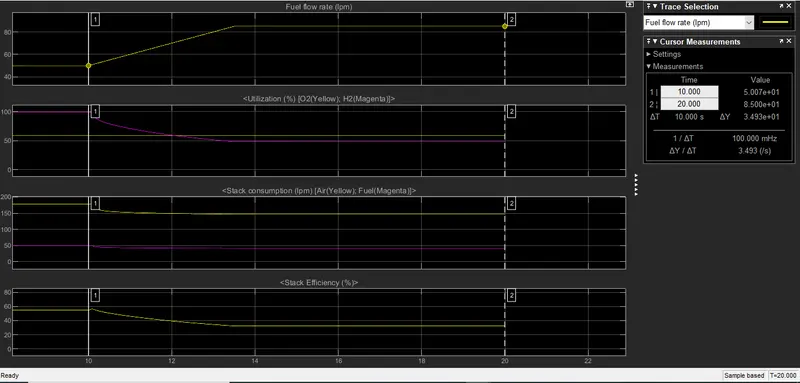
Fuel Cell Stack Parameters Profiles from Simulation time t=10 to t=20.
As can be observed, after simulation time of 10 time units, the Flow Rate profile has become a more linear profile which indicates that the parameters set in the Ramp Block has more effect on the Fuel Flow Rate than the effect of Feedback Current. However this linear profile of Fuel Flow Rate is short lived since the maximum limit for Fuel Flow Rate has been set to 85 Litres per minute using the ‘Saturation2 Block’. Therefore this linear behaviour of the Fuel Flow Rate ends once the Fuel Flow Rate has reached 85 lpm and remains constant at 85 lpm till the end of simulation time. As per the observation in the Scope1 Block, the Fuel Flow Rate reaches the limit of 85 lpm at 13.493 Simulation time units.
As the Fuel Flow Rate started increasing almost linearly from t=10 time units to t=13.49 time units, the Utilization percentage of H2 also starts decreasing at an increasing rate, while the Utilization percentage of O2 remained constant throughout the simulation time from t=0 to t=20 time units.This may be because the Hydrogen Utilzation has been set to be used at a fixed value(in lpm) no matter what the Flow Rate of Fuel is. Hence the Flow Rate is increasing, but the Hydrogen Utilzation maybe set to a fixed value(in lpm), therfore the Utilzation Percentage of Hydrogen is decreasing as the Flow Rate is increasing.
Also when the Fuel Flow Rate starts increasing linearly from t=10 to 13.493 time units, the Stack consumption of Air & Fuel also somewhat decreases. This may be because the Stack Consumption corresponds to the electrochemical potential difference formed between the ends of the terminals of the Fuel Cell Stack and the Stack Consumption will hence correspond to the Feedback Load Current for efficient and optimum consumption of Fuel, no matter what the Fuel Flow Rate is. This can be verified from the regions in the plot where the Stack Consumption Profile of both Air & Fuel is similar to regions in the plot where the Fuel Flow Rate is dependent only on the Feedback Load Current(Simulation time of t=0.079886 to t=10 seconds). Thus no matter what the Fuel Flow Rate, the stack consumption will only depend on the data of the Fuel Flow Rate which has been obtained on the basis of the data of Feedback RL Load Current only and not on the Fuel Flow Rate relationship set up in the Ramp Block.
As is evident from the Stack Efficiency Plot during the time period when Fuel Flow Rate is linearly increasing (from t=10 to t=13.493 time units), the Stack Efficiency is decreasing at a higher rate than it was in the previous time frame (t=0.079886 to t=10 time units). This may be due to the decreased utilization percentage of H2 within this time frame of t=10 to t=13.493 time units which means that a substantial amount of H2 is left being unutilized which may be causing this decrease in Stack Efficiency during this time period. Even the Curve profile of utilization percentage of H2 and the Stack Efficiency is quite similar which further adds weight to this reason.
Once the Fuel Flow Rate reaches 85 lpm(at t=13.493 time units) and remains constant at this level till the end of simulation time, other parameters Fuel Cell Parameters like Utilization Percentage of H2 and O2 also becomes constant till the end of simulation time. The Stack Consumption (in lpm) of Air & Fuel also becomes constant till the end of Simulation time. The Stack Efficiency also becomes constant from 13.493 time units till the end of simulation time.
Solution to Objective 3:
From the simulation time of t=0 time units to t=0.079886 time units, when the Fuel Cell Stack is operating independently (no dependency on the Flow Rate Regulator and Flow Rate Selector), as there is no data of Feedback Current that has come to the Fuel Cell Stack as yet.
Fuel Cell Stack & its relevant parameters from Simulation Time t=0 to t=0.080 units
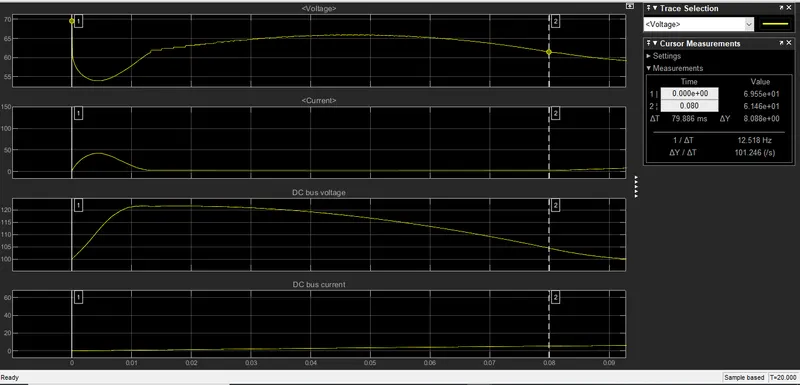
Voltage-Current Characteristics of the Fuel Cell Stack and the RL Load
From the observation of the plots, the following can be concluded:
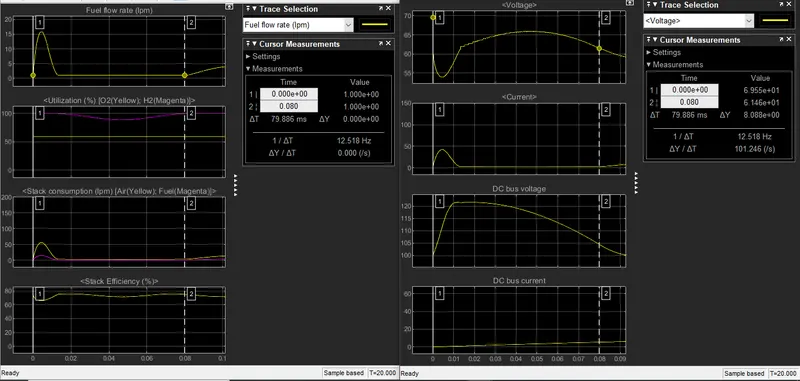
Fuel Cell Parameters and the Current, Voltage Plots for the RL Load and the Fuel Cell Stack from time t=0 units to t=0.080 units.
- As the Fuel Flow Rate increases in the Fuel Cell Stack, the Fuel Cell Electrochemical Potential Difference across its ends decreases. However at around t=0.013 units, when the Fuel Flow Rate remains constant, the Fuel Cell Stack Voltage forms a Bell like Curve.
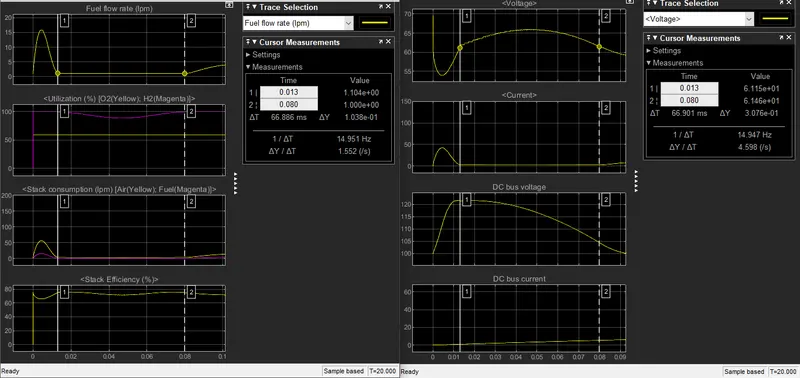
At Time t=0.013 units to 0.08 units,the Flow Rate becomes constant, but the Fuel Cell Stack Voltage() Forms a bell-like curve during this time frame.
- As the Fuel Cell Stack decreases as the Fuel Flow Rate increases, consequently the Fuel Cell Stack Current increases.
- The behaviour of the Fuel Cell Stack Current corresponds more to the behaviour of the Fuel Flow Rate into the Fuel Cell Stack.
- The DC Bus Current (contributed by both the Fuel Cell Stack and the DC-DC Boost Converter) increases from 0 Amperes at time t=0 units to 5.33 Amperes at time t=0.08 units.
- The DC Bus Voltage, as mentioned in the documentation of this model is initially supplied by the DC-DC (100 V average) Boost Converter. Hence the Potential Difference across the ends of the RL Load is 100 Volts and not by the Fuel Cell Stack. The RL Load Voltage increases as the Fuel Cell Stack Voltage decreases which may indicate that the DC-DC Boost Converter compensates for the Voltage across the RL Load when the Fuel Cell Stack is failing to do so. This reason becomes more evident when the Fuel Cell Stack Voltage starts to increase, the RL Load Voltage starts to decrease which may indicate the decreasing role of DC-DC Boost Converter in providing for the RL Load Voltage.
From the simulation time of 0.08 time units to 10 Simulation time units, the Fuel Flow Rate to the Fuel Cell Stack starts depending on the Feedback Current flowing through the RL Load. The parameters set in the Flow Rate Regulator on the basis of the Feedback Current is shown below:
Fuel Flow Rate Regulator Parameters
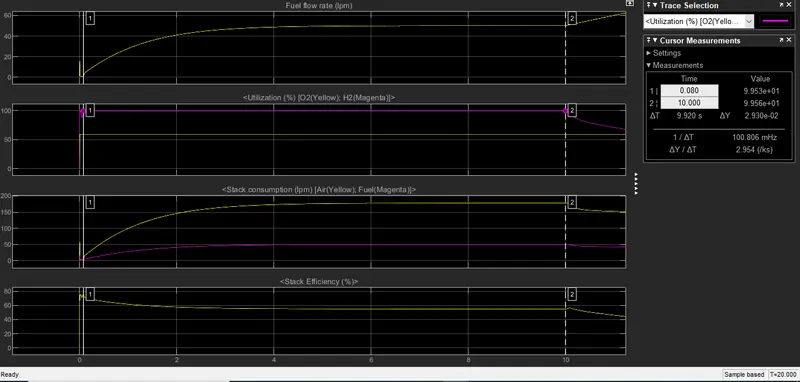
Fuel Cell Stack & its relevant parameters from Simulation Time t=0.08 to t=10 units
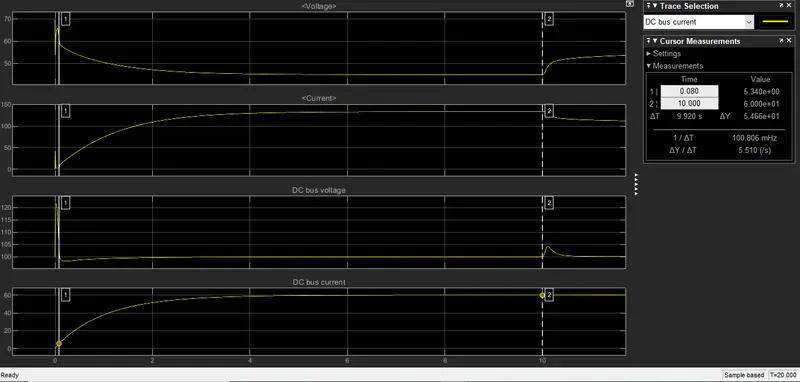
Voltage Current Plots of the Fuel Cell Stack & RL Load within the time period of t=0.08 units to t=10 units
From the observation of the plots, the following can be concluded:
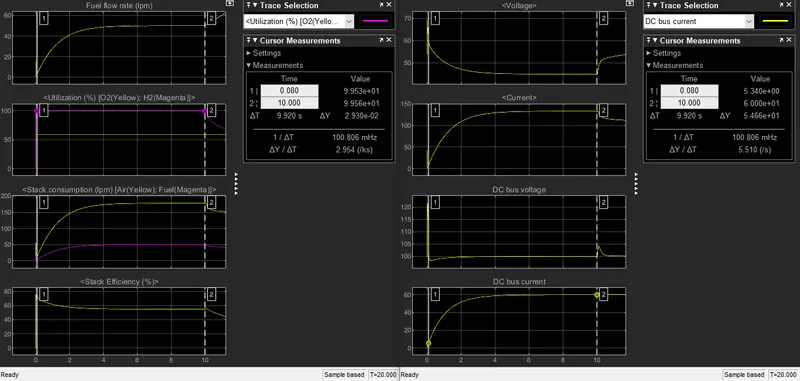
Voltage Current Plots of the Fuel Cell Stack & RL Load along with the Fuel Cell Stack parameters within the time period of t=0.08 units to t=10 units
- The curve of the Fuel Flow Rate is similar to the Fuel Cell Stack Current. The only difference is in the values.
- The Fuel Cell Stack Voltage is the polar opposite of the Fuel Cell Stack Current (curve upside down).
- Whatever be the Potential Difference across the Fuel Cell Stack, the DC-DC Boost Converter ensures that during this time period(t=0.08 to t=10 units), the Voltage across the RL Load remains at 100 V (greater than even the peak Voltage Value across the Fuel Cell Stack).
- Using the DC-DC Boost Converter, the Voltage across the RL Load has become more than the Fuel Cell Stack Voltage and hence the RL Load Current has also correspondingly becomes less than the Fuel Cell Stack Current.
- The RL Load Current, the Fuel Cell Stack Current and the Fuel Flow Rate have similar profile with different values.
- The Fuel Utilization Percentage of H2 is 99.56% as is set in the Flow Rate Regulator Block.
From the simulation time of 10 time units to 20 Simulation time units, the Fuel Flow Rate to the Fuel Cell Stack starts depending on the Feedback Current flowing through the RL Load and also on the parameters set in the Ramp Block (output signal fed to the Flow Rate Selector Block). The parameters set in the Flow Rate Regulator on the basis of the Feedback Current is shown below:
Flow Rate dictated by Feedback Current from RL Load
Based on the parameters set in the Ramp Block as shown below, the Flow Rate varies according to time as per the following relation:
Flow Rate at a particular Time Instant= 10 X (Time Instant) – 100.
Flow Rate Variation w.r.t. Time as set in the Ramp Block
Therefore after Simulation Time greater than 10 Time Units-> Flow Rate = [10 X (Time Instant) – 100] + f (RL Load Current)
Fuel Cell Stack & its relevant parameters from Simulation Time t=10 to t=20 units
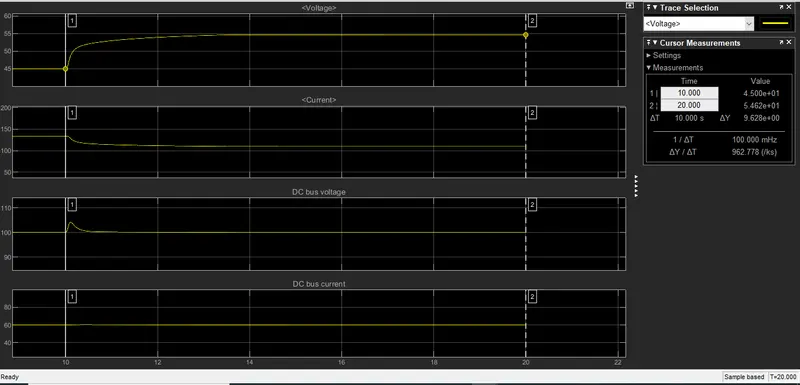
Voltage-Current Characteristics of the Fuel Cell Stack and the RL Load from Simulation Time t=10 to t=20 units.
From the observation of the plots, the following can be concluded:
- From the Simulation Time of 10 time units, the Fuel Flow Rate starts increasing in a more or less linear fashion, thanks to the additional effect of the parameters set to the Ramp Block which is fed as an input to the Flow Rate Selector Block. However the Limit of this linear increase is only upto 85 lpm (set using the Saturation2 Block) after which the Fuel Flow Rate remains constant at 85 lpm till the end of simulation time. The Simulation time reaches 85 lpm at nearly 13.493 seconds.
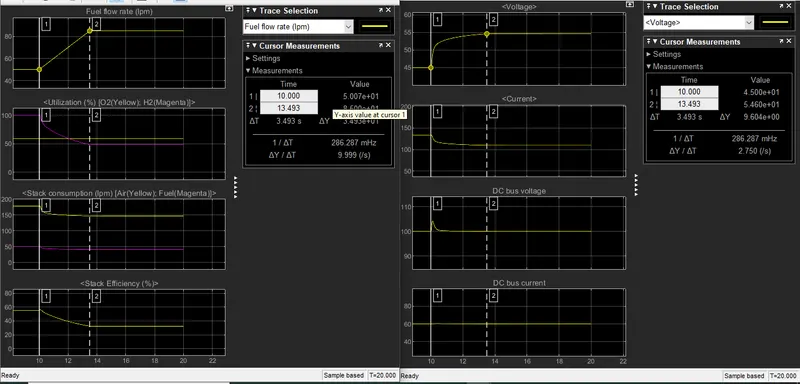
Voltage Current Plots of the Fuel Cell Stack & RL Load along with the Fuel Cell Stack parameters within the time period of t=10 units to t=13.493 units
- As the Fuel Flow Rate starts increasing more or less in a linear fashion, the effect of the Fuel Flow Rate set in the Ramp Block becomes more prominent than the Fuel Flow Rate which is determined by the Feedback Current (set in the Flow Rate Regulator Block). As the Fuel Flow Increases linearly upto 85 lpm from t=10 time units, The Fuel Cell Stack Voltage also starts increasing at a decreasing rate till it reaches a constant value of roughly 54.6 Volts at 13.493 time units(Time when Fuel Flow Rate reaches 85 lpm).
- Correspondingly, as the Fuel Cell Stack Voltage increases at a decreasing rate from 10 time units to roughly 13.493 time units, the Fuel Cell Stack Current starts decreasing at somewhat increasing rate till it reaches a constant value of about 110 Amperes and remains somewhat at this level till the end of simulation time.
- At 10 time units, since there is a sudden & significant change in variation of Fuel Flow Rate, the Fuel Cell Voltage also shows a steep increase in its voltage and then then slowly the steepness decreases and settles at a constant value. This sudden & significant decrease can hamper the performance of the device/Load connected in the circuit. Such Voltage/Current Fluctuations (both in intensity & frequency) has the ability to affect the performance of the Load/Device connected in the circuit.
- The DC-DC Boost Converter which is used to Boost the Fuel Cell Stack Voltage to an average Voltage Value of 100 V ensures that the fluctuation is kept as minimum as possible. This can be seen from the Amplitude of the Waveform representing the DC Bus Voltage at 10 time units, where the Fuel Flow Rate Variation curve changes its profile. The DC-DC Boost Converter ensures that the Voltage across the RL Load remains at 100 V throughout.
- Since the DC-DC Boost Converter ensures that the Voltage across the RL Load remains constant at 100 V throughout, hence the current flowing through the RL Load also remains constant within this time period(t=10 to t=20 time units) at 60 Amperes.
- During this simulation time period of 10 to 20 time units, the H2 utilization drops below 99.56% which suggests that the effect of Fuel Flow Rate set by the Ramp Block has a large significant effect on the Flow Rate of Fuel into the Fuel Cell Stack than the Flow Rate determined by the Feedback Load Current.
REFERENCES:
- https://in.mathworks.com/help/physmod/sps/ug/6-kw-45-vdc-fuel-cell-stack.html;jsessionid=4dc30b75e26cf46cdb634bd38b72