Flow Over Bicycle
AIM: To write a program to calculate drag force on bicycle under different conditions using MATLAB.
OBJECTIVES :
1) to calculate aerodynamic drag force acting on bicycle.
2) to plot graph velocity against drag force and observe interconnection between them.
3) to plot graph drag coefficient against drag force and observe interconnection between them.
4) to observe graphical difference between both graphs.
INTRODUCTION:
Among the total resistive forces when bicycle moving along with rider on level ground, aerodynamic drag is the main resistance opposed to the motion and it is dependent on various condition frontal area plays vital role frontal area includes rider and bicycle which is also call as direct exposing area to the wind from opposing end.in between bicycle and rider riders body take the 70% of the total aerodynamic force .that is why bicycle riders keeps changing there position to avoid aerodynamic drag such as possible.
THEORY:
DRAG FORCE:-Drag force is the resistance force of a fluid. This force applies acting opposite towards the motion of the object which is moving submerge in a certain fluid. Thus Drag Force is defined as the force which resists the motion of a body with fluid.
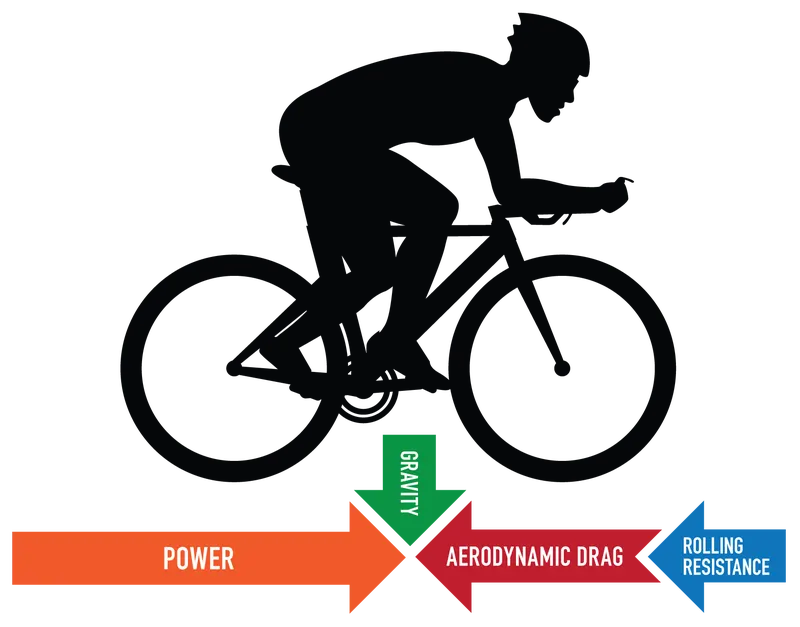
Fig.1.1-Aerodynamic drag force
The factors which are mainly responsible for aerodynamic drag force are
- Physical properties of fluid causing the drag of bicycle such as velocity, density.
- Frontal exposing area to the aerodynamic drag force including rider and bicycle.
Formulae to calculate drag force is-

where,
FD= Drag force in 'N'
ρ = density of fluid in 'kg/m^3
A = frontal area in m^2
v = velocity of object in m/s
CD = coefficient of drag force
Fig 1.1
Frontal area :- As we mentioned in introduction area in this case is the area which is directly exposing to the drag force which include bicycle and rider.so to get over of drag force we need to design cycle front body in such manner that the flow will be streamline. still the most contributing factor in drag force is rider which contributes 70% 0f total to come over it professional rider keep on changing their positions.
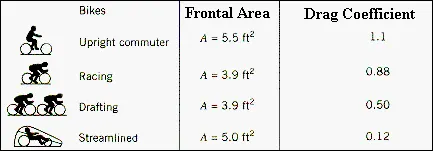
Fig 1.2-drag corefficients with respect to frontal area
Calculation- so here we going to type a program for two different condition and calculate drag force and their respected graphical representation.
1)Calculation of drag force in MATLAB and plotting graph of velocity against drag force at diffrent values of velocity.
Editor window:-
% calculating drag force on bicycle using matlab
close all
clear all
clc
%inputs
%Drag coefficient
c_d = 0.78

%density in kg/m^3
rho = 1.12

%frontal area in m^2
A = 0.556

%Velocity in m/s we here varrying the values of velocity to plot graph
v = [1:10]

%drag force
F_d = 0.5*rho*A*v.^2*c_d

%plotting a graph of velocity against drag force
plot(v,F_d,'linewidth',3);
xlabel('Velocity (m/s)');
ylabel('Drag force (N)');
grid on
Drag force:- corresponding to their relative velocity values
F_d =
[ 0.2429 0.9714 2.1857 3.8858 6.0715 8.7430 11.9002 15.5431 19.6717 24.2861]
Graph:-
- Graphical representation of velocity vs drag force
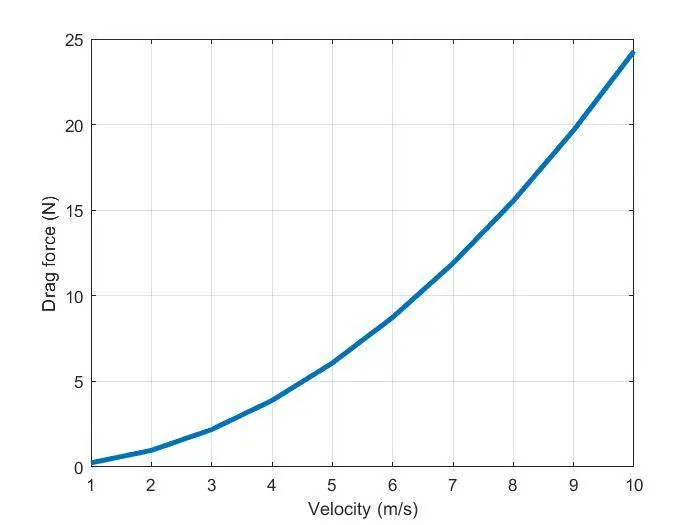
Result: this graph shows a curved line as the velocity increases drag forces also goes on increasing Drag force FD is found to be proportional to the square of the speed.
2) Calculation of drag force in MATLAB and plotting graph of drag coefficient against drag force where velocity will be constant.
we going to use only different values of drag coefficient from Fig:-1.2 as an example
Editors window:-
%calculating drag force using matlab

%Inputs
%Drag coefficient
c_d = [0.12 0.50 0.88 1.1];

%frontal area in m^2
A = 0.510

%Density in kg/m^3
rho = 1.12

%Velocity in m/s
v = 5

%Drag force in N

F_d = 0.5*rho*A*c_d.*v^2

%plotting a graph of drag coefficient vs drag force
plot(c_d,F_d,'linewidth',3);
xlabel('Drag coeff');
ylabel('Drag force');
grid on
Drag force:- given drag force values wrt to drag coefficient dependent on frontal area
Fd = 0.8568 3.5700 6.2832 7.8540
Graph:-
graphical representation of drag coeff wrt to area vs drag force
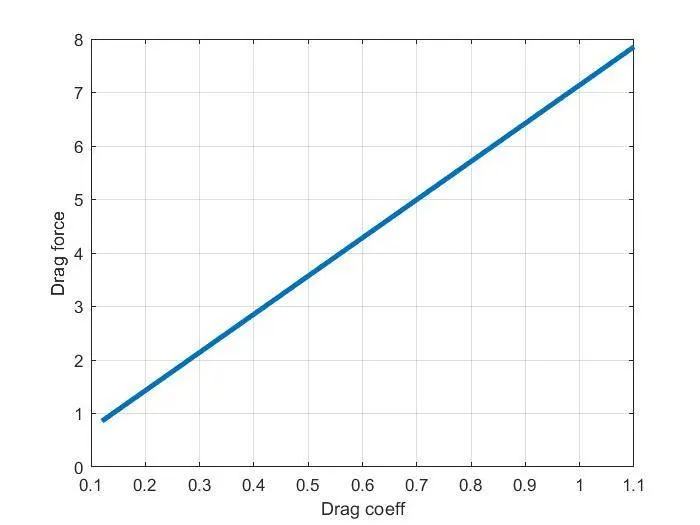
Result:- the graph of velocity vs drag force is straight line as drag coefficient increases which result in increase of drag force and its a straight line.
Conclusion:-1) from graph of velocity vs drag force we can conclude that as velocity increases drag force increases and it is square of the speed of bicycle.and it is represented by curved line 2)from graph of drag coeff wrt to area vs drag force and it is represented by straight line.drag coeff increases which causes increase in drag force to avoid the effect of drag force the frontal body of bicycle must be designed in such manner that it can take less amount of opposing drag force it should be streamline or rider needs to change his position to reduce drag force and overcome from it.
Refrences:-1) fig 1.1 is aerodynamic force on bicycle is taken from :- https://d3laewezlz9ul2.cloudfront.net/wp-content/uploads/2018/07/13142056/image8.png
2)fig 1.2 is diffrent drag coeff wrt to diffrent frontal area is taken from :-
https://www.princeton.edu/~maelabs/hpt/mechanics/mecha_55.htm