Flow over a cylinder
Flow over a cylinder
Aim :
To simulate the transient state flow over a cylinder by using the flow simulation tool in solidworks software.
Objective :
- To run a baseline simulation and then calculate the Reynolds number.
- To increase the Reynolds number by a factor of 20%,40% and 100% then run the transient flow simulation.
Introduction :
Steady State :
The steady state is the state that is established after a certain time in your system.
Steady state occurs after the system becomes settled and at the steady state system works normally. It depends on the forcing function i,e source.
Transient state :
The transient state is basically between the beginning of the event and the steady state.
Transient response can be referred as the system's instant behaviour against input change or disturbance. In other words, How system reacts against the inputs.
Procedure :
Modelling of the cylinder :
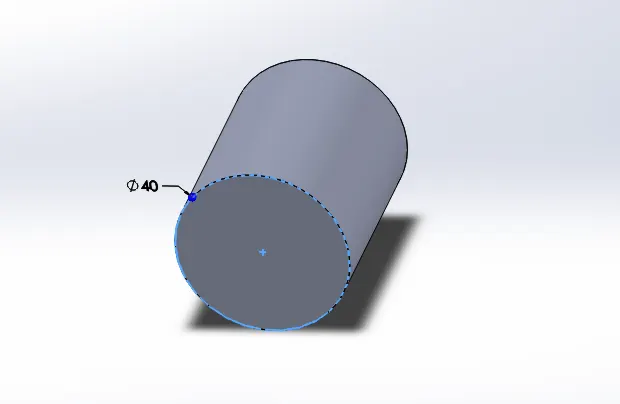
This is a very simple process as a cylinder is modelled by drawing a circle in a planes (for our case it's front plane) and is extruded to get a cylinderical shape. At first a circle of diameter 40mm was drawn and was extruded to a length of 100mm and was saved.
Reynolds number calculation :
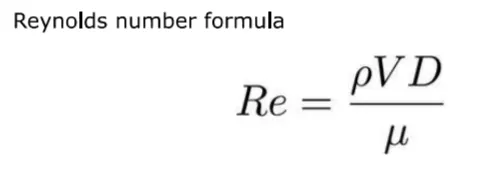
Here,
Rho = Density of fluid
V = Velocity of flow
mew = viscosity of fluid
D = Diameter of cylinder
Flow simulation setup :
- Analysis type : External and Time dependent with simulation time and step time are calculated according to the Reynold number show in table.
- Length of domain = 0.5m
- End time = length / velocity
- Type of fluid : Air
- Density of Air : 1.2041 kg/m^3
- Viscosity of Air : 1.825x10^-5 kg/m.sec
- Type of flow : Laminar and Turbulant
- Initial conditions : Pressure (101325 Pa), Temperature (293.2 K), Velocity x-direction calculated from table.
- Now according to the objective transient simulations has to be done by increasing Re by a factor of 20%, 40% and 100%.
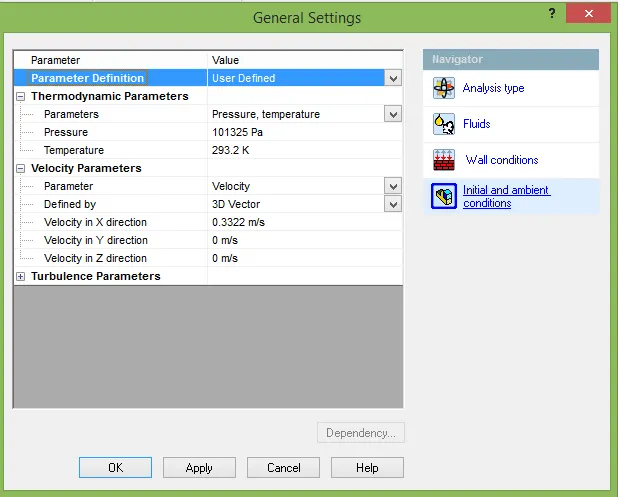
Here, we take the Reynold number for simulate the various flow. and from that Re number increase that into 20%,40% and 100%. and we going to calculate velocity according to the Re number. And the flow through time and simulation end time also calculated and tabulated.
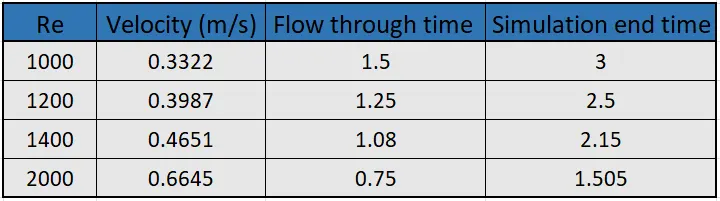
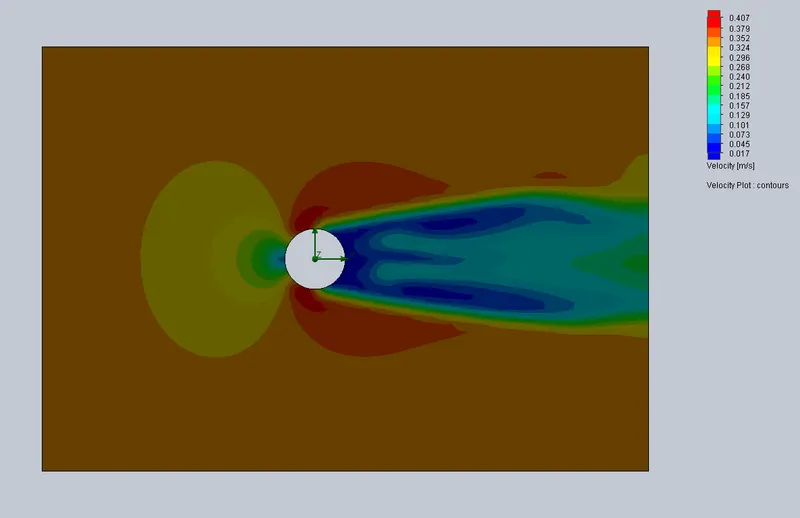
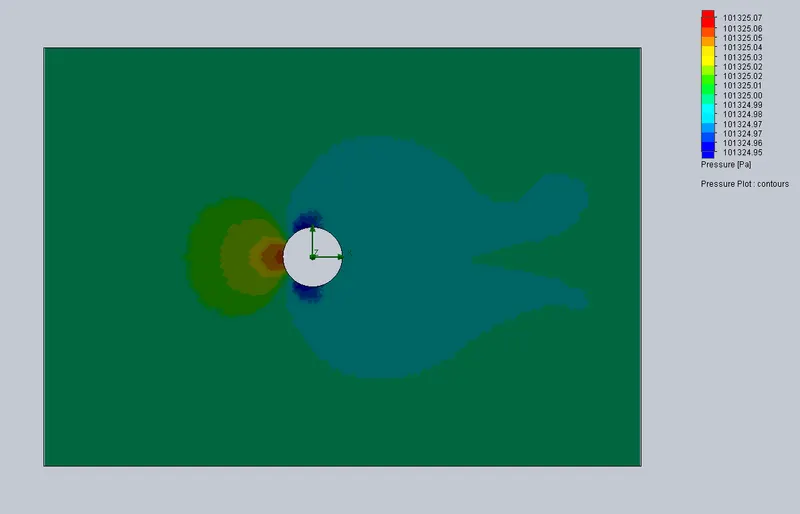
- Case 1: Re = 1000 ; velocity = 0.3322 m/s ; simulation time = 3 sec
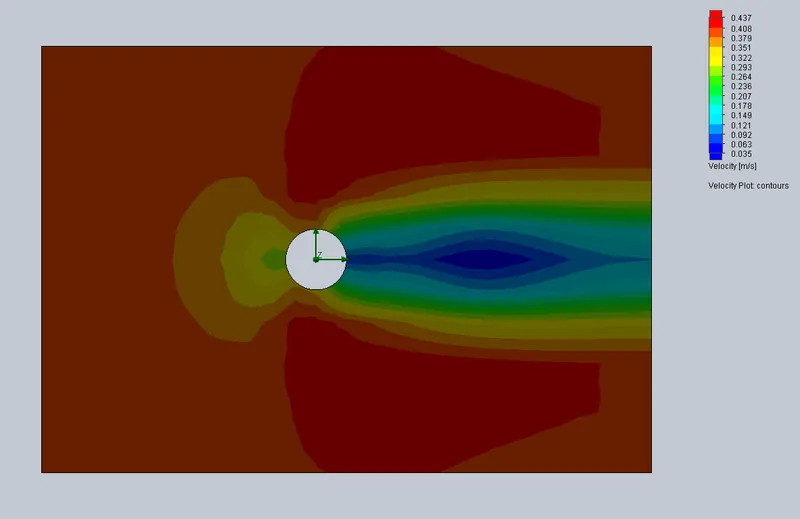
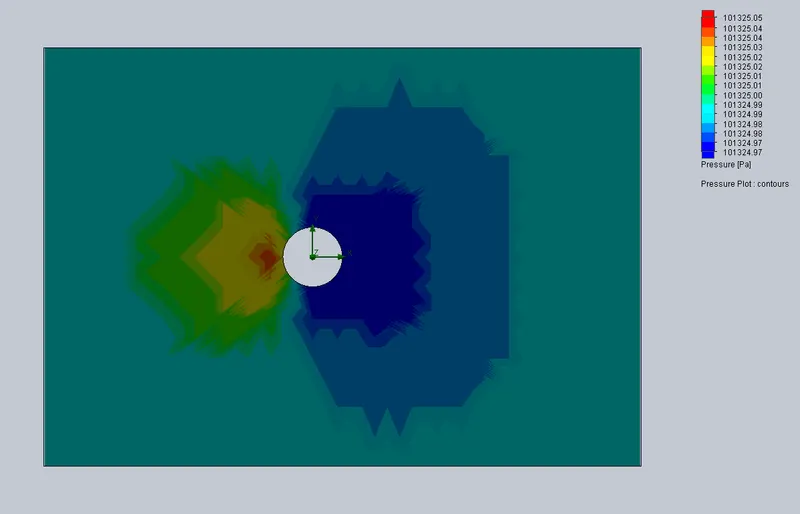
- Case 2: Re = 1200 ; velocity = 0.3987 m/s ; simulation time = 2.5 sec
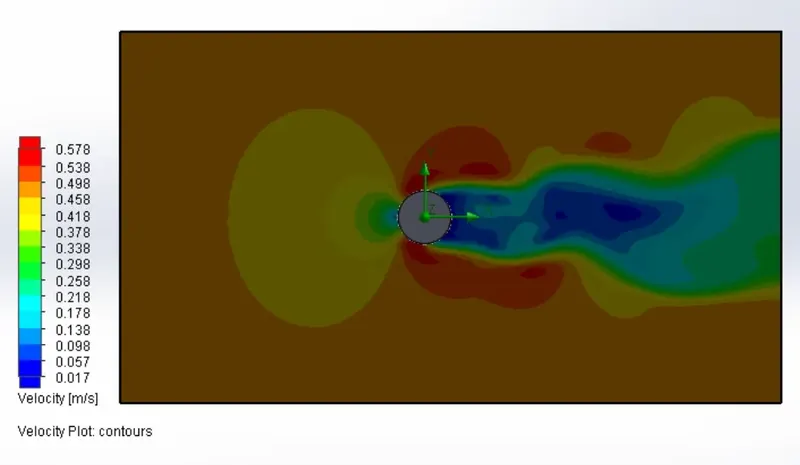
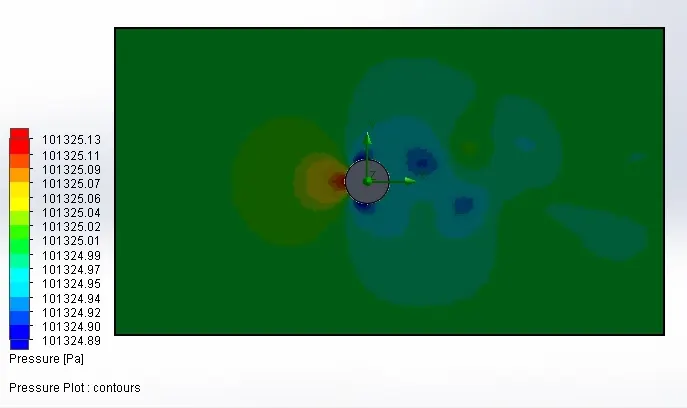
- Case 3: Re = 1400 ; velocity = 0.4651 m/s ; simulation time = 2.15 sec
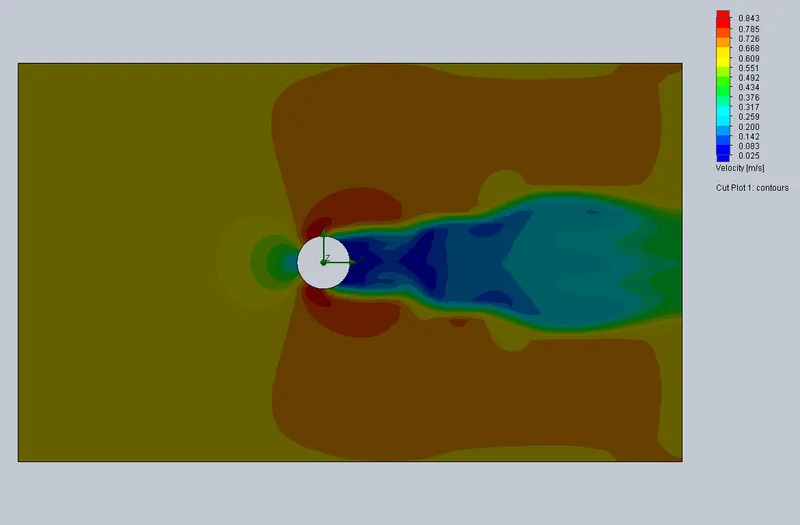
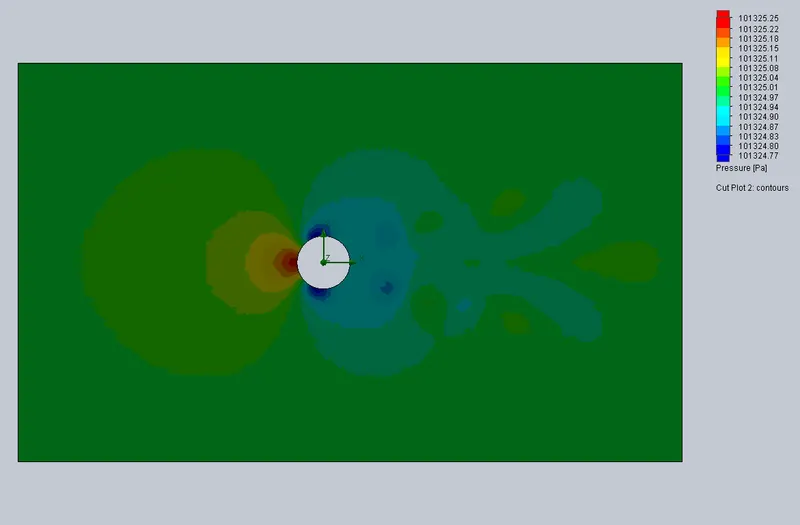
- Case 4: Re = 2000 ; velocity = 0.6645 m/s ; simulation time = 1.505 sec
Results :
Velocity plot (Re = 1000)
Velocity plot (Re = 1200)
Velocity plot (Re = 1400)
Velocity plot (Re = 2000)
Pressure Plot (Re = 1000)
Pressure Plot (Re = 1200)
Pressure Plot (Re = 1400)
Pressure Plot (Re = 2000)
Animations :
Case 1 : velocity Animation (Re 1000)
Case 2 : velocity Animation (Re 1200)
Case 3 : velocity Animation (Re 1400)
Case 4 : velocity Animation (Re 2000)
Case 1 : Pressure Animation (Re 1000)
Case 2 : Pressure Animation (Re 1200)
Case 3 : Pressure Animation (Re 1400)
Case 4 : Pressure Animation (Re 2000)
Conclusions :
Hence the flow over cylinder simulation is done for Reynolds number of 1000 and incresed by 20%, 40% and 100% is done successfully. In this velocity and pressure analysis as the Reynold number increase the velocity of the flow also increase.
In the velocity animation at the Re 1000 and Re 1200 levels the flow look like a fixed pair of foppl vortices in wave and this flows are in the Transition range. And the Re 1400 and Re 2000 levels the flow look like the laminar boundary layer separation and this flow this wave Transition flow to completely turbulent flow.