Final Project: Electric Rickshaw modelling
Create a detailed MATLAB model of an electric rickshaw (three wheel passenger vehicle) as per details below:
Rear wheels driven by PM brushed type motor
Assume efficiency points of motor controller and motor
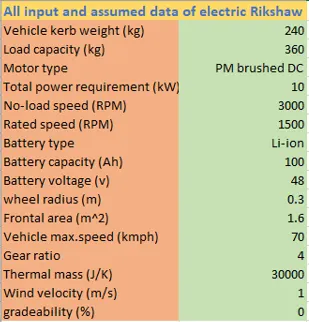
Make an excel sheet of all input and assumed data
Results: For any three standard driving cycles show energy consumption, temperature rise of motor and controller for 100 km constant speed driving at 45 kmph.
AIM : Design of an Electric Rickshaw using MATLAB Simulink.
ABSTRACT :
In this project, we going to build the MATLAB model of the ELECTRIC RICKHAW by using a PM brushed type DC motor and a suitable Lithium-Ion battery for the motor. Before that, we will know about what is Electric RICKHAW, how it's works and the benefits of EV RICKHAW. Then we make an actual EV RICKHAW model in SIMULINK with suitable blocks from the powertrain block set. My main motto is to check "how my RICKHAW performs for any three standard driving cycles showing energy consumption, the temperature rise of motor and controller for vehicle cover around 100 km at constant speed driving 45 kmph.
INTRODUCTION:
Electric E-Rickshaw is also known as electric tuk-tuk, e-rickshaw and auto which are going more popular after 2018 in Indian market. This E-rickshaw is best alternative of petrol/ CNG auto rickshaw and human or horse pulled rickshaws because of their low fuel cost, zero emissions and less human efforts.
The electrical system used in Indian version is 48-330VDC can run 70– 130 km/full charge, top speed 25 -70km/hour and this electric motor power ranging from 0.650-10 kWatts; the battery takes 4–10 hrs to become fully charged. Basic seating capacity is driver plus 4 passenger total 5 persons.
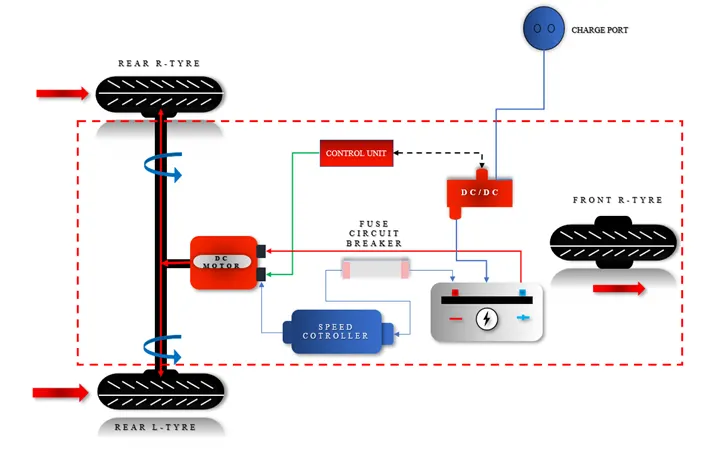
Here basically, e-rickshaw is designed in MATLAB Simulink. In the designed electric rickshaw main blocks are battery, drive cycle, controlled, DC Motor, Vehicle body and transmission system. Drive cycle is the input of human effort that how he is going to drive his actual cycle. We can use drive cycle like FTP75, WOT or by using Excel.
The main objective of this project is to obtain speed by driver, to estimate the temperature of motor and controller, to estimate the state of charge (SOC) and distance travel by the vehicle. There is a SOC block that will estimate the state of charge of battery, distance is calculated by speed and time parameter for all the three Drive cycle.
E-Rikshaw model(3 wheeler):
excel sheet including all input and assumed data
Simulink model:
As we can see that the below diagram is consisting of MATLAB Simulink model of an electric rickshaw. In below model we use three type of different drive cycle to run the vehicle body. A basic current is applied to the model. The required voltage to the vehicle is controlled by the controller. Depending upon the vehicle parameter the controller will follow the drive cycle and run the motor.
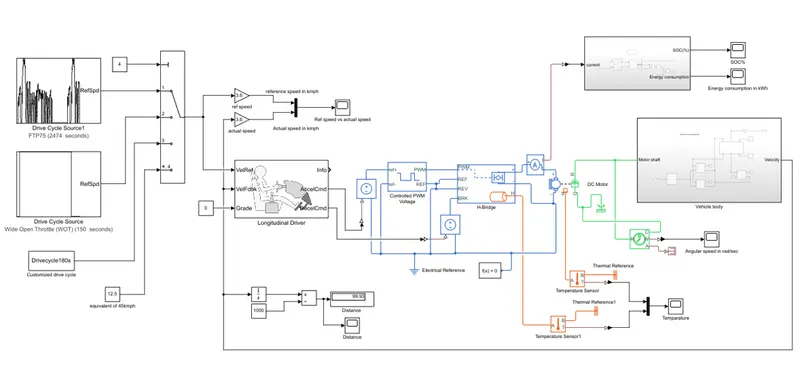
It consists of many components
- Vehicle body subsystem
- DC motor and motor controller with temparature sensors
- Longitudinal driver
- Battery management system and Energy management system
- Drive cycles
1.Vehicle body subsystem:
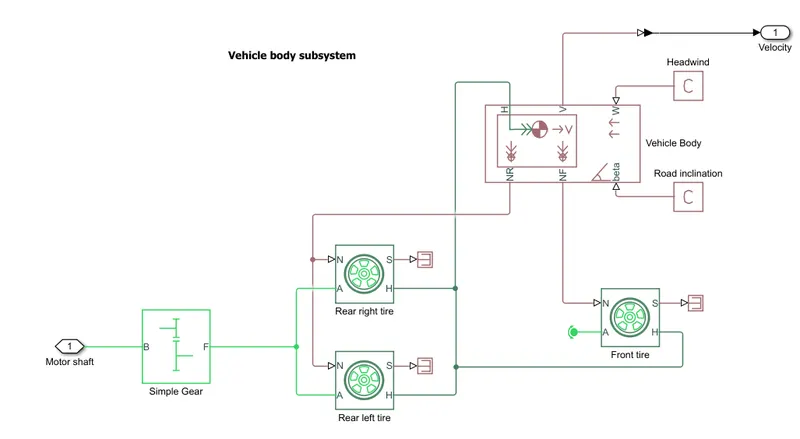
This subsystem is consists of 3 tire blocks,vehicle body and simple gear
The vehicle is assumed to be a rear axle driven (3 wheels - 2 on each axle).
i)Tire (Magic formula):.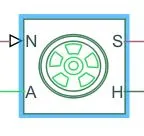
The N port of the tire corresponds to the Normal Reaction acting on it.
The A port corresponds to the Mechanical Rotational conserving port for the wheel axle. Thus both the wheels on the same axle should form a connection through their respective A ports.
Connection H corresponds to the Mechanical Translational conserving port for the wheel hub through which the thrust developed by the tire is applied to the vehicle. Thus, all the 3 wheels form a connection through their respective H ports and this is in turn connected to the translational hub of the vehicle body.
The connection S represents the output port for slip of the tire.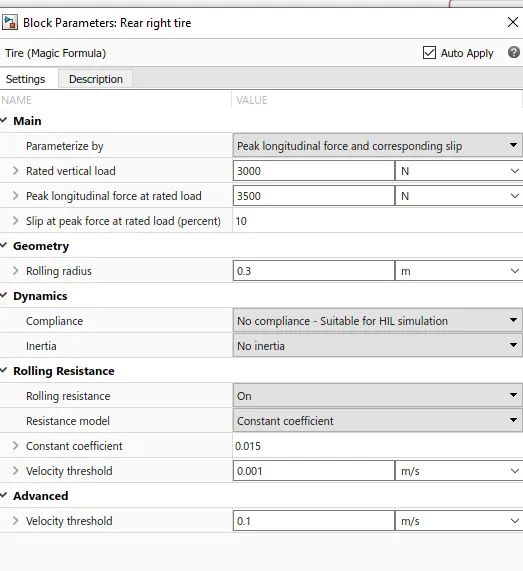
- The tires are parameterized by Peak longitudinal force and corresponding slip.
- The other block parameters such as - rated vertical load, peak longitudinal force at rated load and slip at peak force at rated load - are kept with their default values.
- The tire radius is given as 0.3 m.
- Also, the rolling resistance is given with a constant coefficient of 0.015.
This 2 axle (3 wheel) assebly is now connected to a Velocity Body simscape block.
ii)Vehicle body:
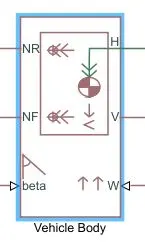
- This block basically represents a two-axle vehicle body in longitudinal motion. The block accounts for -
body mass,aerodynamic drag,road incline,weight distribution between axles due to acceleration road profile. - Here, the connection H is the mechanical translational conserving port hub.
NF & NR correspond to the output ports for nomral reaction forces on front axle and rear axle wheels respectively.
Connection V represents the actual output translational velocity of the vehicle.
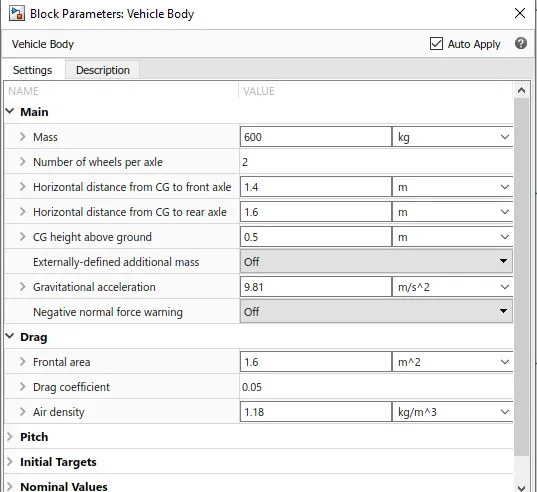
beta is the road inclination angle & W corresponds to the headwind speed and it is kept as 1m/s (headwind - direction opposite to that of vehicle). - The gross weight is given to be 600 kg.
- The geometric parameters of the vehicle are given as default
- 0.05 for proper drag force on the vehicle,Air density is 1.18kg/m^3 and the frontal area is kept as 1.6m^2
- The pitch dynamics for the vehicle are not considered for this simulation.
iii)Simple gear:
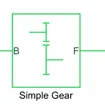
The input for vehicle body subsystem is taken as the Rotational speed of the motor. This input is fed to the front axle through a Simple Gear representing the Final Drive Ratio of 4
Here, the rotational direction of the output shaft is kept the same as that of the input shaft. Also, no meshing losses are considered for the simulation.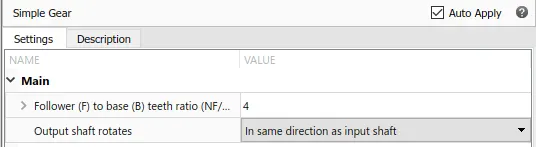
2.DC motor and motor controller with temparature sensors:
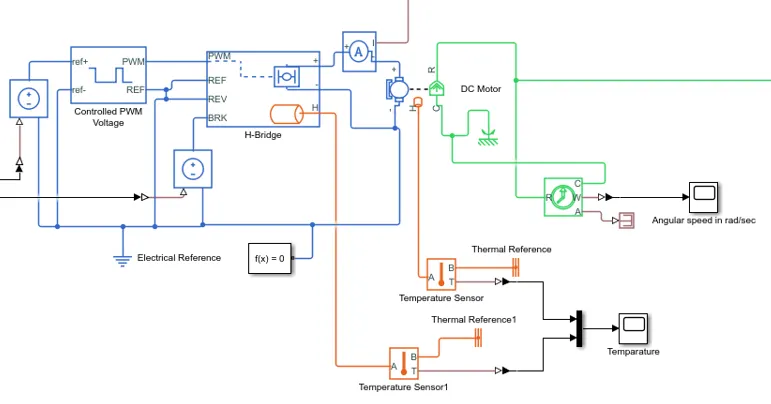
i)DC Motor with temparature sensor :

- Simulink provides an inbuilt model block for DC motor which converts electrical input into mechanical rotational output.
Note : Here, the blue colour corresponds to the electrical side of the motor and the green colour corresponds to the mechanical side. - Here, the motor field type is kept as Permanent magnet and the model parameterization is done by rated load and speed.
The armature inductance and the mechanical parameters are given their default values. - The rated load is kept as 10kW power and rated DC supply voltage is 48V
All the other parameters are changed as shown below -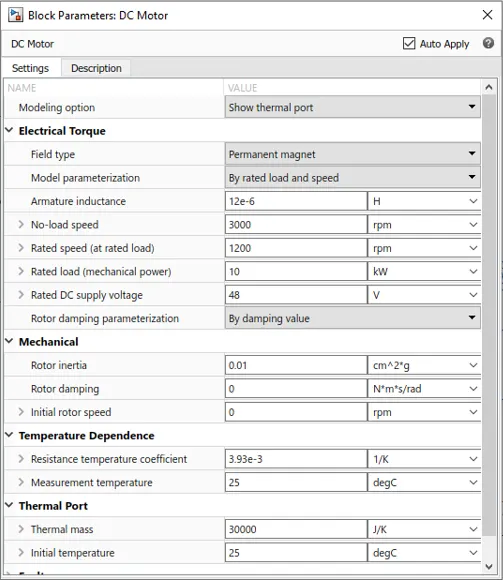
- The connection R represents the Rotor (rotational output) while the connection C is for the Casing (stationary). Thus, the R port is connected to the input of the vehicle subsystem created earlier. The C port is connected to a mechanical rotational reference.
- The + and - terminals of the motor are connected to the motor controller. If these terminals are directly connected to a battery, the required DC motor will run on the rated capacity of the battery. This will eventually result into no control over the DC motor and the vehicle will run at top speed throughout the simulation.
Thus, a motor controller is very much needed. - Motor thermal port is enabled and temparature sensor is connected to it.
- one main thing to consider is thermal mass which is kept as 30000J/K
Temperature Sensor :
- Temperature Sensor is used to mesure the temperature of H-Bridge and Motor.
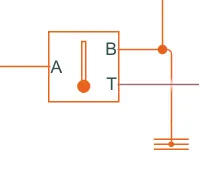
- This block measures temperature in a thermal network. There is no heat flow through the sensor. The physical signal port T reports the temperature difference across the sensor.
- The measurement is positive when the temperature at port A is greater than the temperature at port B.
ii)Motor Controller :
The H-Bridge circuit along with the controlled PWM voltage together form the motor controller circuit.
>>H-Bridge circuit -
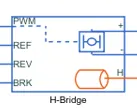
- This block represents an H-bdidge motor drive. The block can be driven by the Controlled PWM Voltage block in PWM or Averaged mode.
- In PWM mode, the motor is powered if the PWM port voltage is above the enabled threshold voltage.
- In Averaged mode, the PWM port voltage divided by the PWM signal amplitude parameter defines the ratio of the on-time to the PWM period.
- Connection REF is for the reference input. This combined with the PWM connected will form the pulse input for the H-Bridge.
Here, the REF input is connected to the Electrical Reference (ground). - Connection REV corresponds to the reverse motion of the motor which essentially means, the backward motion of the vehicle.
Here, the backward motion of the vehicle is not accounted for and so, the port is connected to the electrical reference. - Connection BRK is for the braking of the vehicle.
- Since, the PWM mode results in a huge amount of simulation time, Averaged mode is selected for this simulation.
- Load current characteristics are considered to be smoothed here.
- Also, the regenerative braking is enabled for the simulation. This means, when the vehicle starts decelerating, corresponding amount of charge will be fed back to the battery.
Accordingly, the BRK input is connected from a Controlled Voltage Source. This will generate emf corresponding to the intensity of brakes applied and fed the power back to the battery. - The Input Threshold parameters are left with their default values.
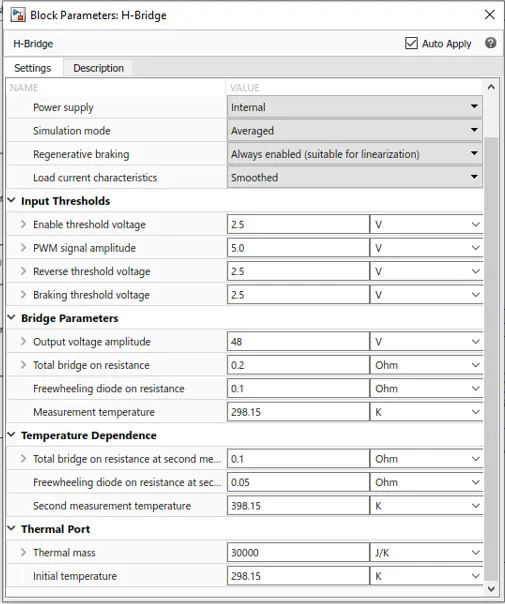
- The Output Voltage Amplitude of the H-Bridge circuit is given the same value as the rated DC supply voltage of the DC motor.
- thermal mass of the H-bridge is kept as 30000J/K which is same as motor.
- Therma port of the H-bridge is enabled and temparature is measured through Temparature sensor
>>Cotrolled PWM voltage:
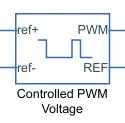
- Simulink provides an inbuilt Controlled PWM Voltage block. This block is used for providing the proper pulse inputs to the H-Brdige circuit.
The PWM & REF connections are for the corresponding ports on the H-Bridge circuit.
The 2 reference inputs correspond to the throttle inputs given by the driver. The block generates corresponding pulse width as per the accelerations and brakes apllied by the driver himself. - Here, the PWM frequency is 1000 Hz. Also, the simulation mode is Averaged as that in the H-Bridge circuit.
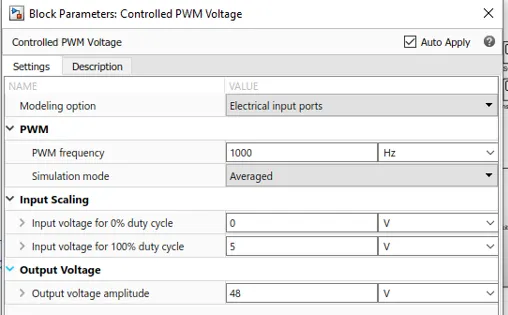
- The input scaling parameters given are -
0V for 0% duty cycle and 5V for 100% duty cycle. Accordingly, the output voltage amplitude becomes 48V.
3.Longitudinal Driver :
- Longitudinal Driver is an inbuilt block provided by the powertrain blockset.
- It is a parametric longitudinal speed tracking controller for generating normalized Acceleration and Braking commands based on reference and feedback velocities.
- The VelRef port is the reference velocity port where the input drive cycle data is fed.
The VelFdbk port corresponds to the feedback velocity. The actual velocity output given by the vehicle body is connected here. By comparing the actual (feedback) velocity with the reference velocity, the driver block generates acceleration and braking signals in order to minimise the error between the two concerned velocities.
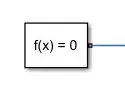
Grade corresponds to the grade angle. For this simulation, no inclination is considered and hence, a constant block with value 0 is connected.
Info gives the output for the bus signal for different block calculations like difference in reference vehicle speed and vehicle speed, etc.
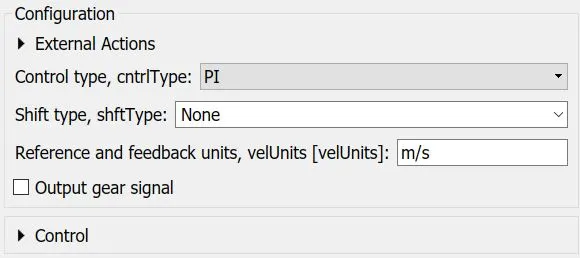
AccelCmd & DecelCmd correspond to the acceleration and deceleration commands generated respectively and are connected to the corresponding ports of the Controlled PWM Voltage block. - Here, the selected control type is PI. Acordingly, the block implements proportional-integral (PI) control with tracking windup and feed-forward gains.
5. Battery Management System and Energy management system:
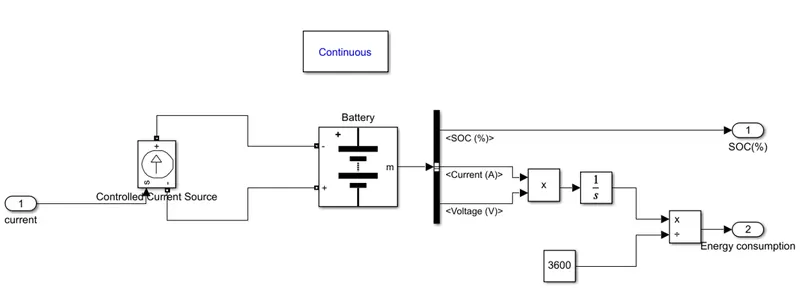
The BMS will also control the recharging of the battery by redirecting the recovered energy (i.e.- from Regenerative Braking) back into the li-ion battery pack (typically composed of a number of battery modules, each composed of a number of cells). Battery thermal management systems can be either passive or active, and the cooling medium can either be air, liquid, or some form of phase change. Air cooling is advantageous in its simplicity. Such systems can be passive, relying only on the convection of the surrounding air, or active, utilizing fans for airflow. Commercially, the Honda Insight and Toyota Prius both utilize active air cooling of their battery systems.
The major disadvantage of air cooling is its inefficiency. Large amounts of power must be used to operate the cooling mechanism, far more than active liquid cooling. The additional components of the cooling mechanism also add weight to the BMS, reducing the efficiency of batteries used for transportation. Liquid cooling has a higher natural cooling potential than air cooling as liquid coolants tend to have higher thermal conductivities than air. The batteries can either be directly submerged in the coolant or coolant can flow through the BMS without directly contacting the battery. Indirect cooling has the potential to create large thermal gradients across the BMS due to the increased length of the cooling channels. This can be reduced by pumping the coolant faster through the system, creating a tradeoff between pumping speed and thermal consistency.
The equivalent circuit of the Battery Block is shown below:
i) Li-ion Battery Pack :
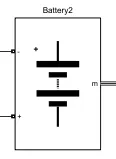
When the battery gets charge then there is a exponential voltage drop, and the width of the drop is depends upon the Battery Type. Since the battery is rechargable so a considerable amount of charge can be extracted from the battery until the voltage drops below the battery nominal voltage.
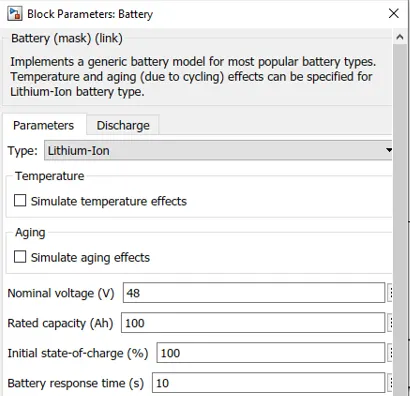
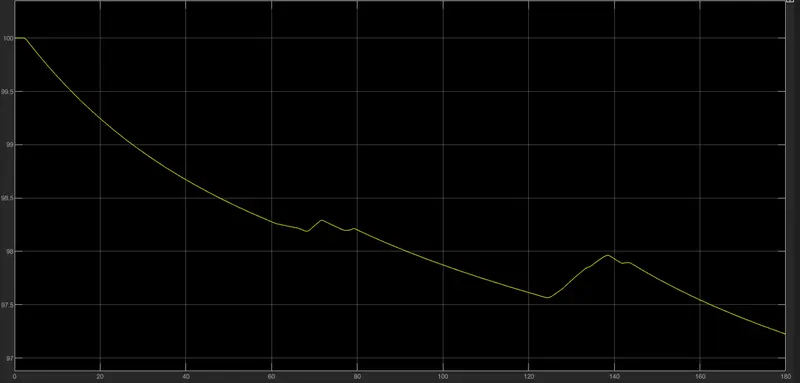
As per the project requirement, the Nominal Voltage of the Battery is set as 48V with initial SOC of 100%.
Its rated capacity is given as 100Ah
The positive terminal of the battery is connected to the Controlled Current Source Block where the current is controlled as per the voltage of the DC-motor.
The value of the parameters set for the Battery is given as a figure below:
ii) Controlled Current Source:
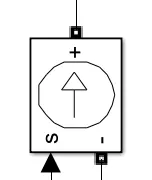
This block is responsible converting the Simulink input signal into an equivalent current source. The generated current is driven by the input signal of the block. The block is initialized as a AC current source type and the simulation is started in the steady state condition, so therefore the block input must be connected to a signal starting as a sinusoidal or DC waveform corresponding to the initial values.
The positive and the negative terminals of the block is connected across the Battery and the physical port 'S' is connected to the physical output port 'l' of the Current Sensor of the DC Motor Subsystem. It is arranged in a fashion that the current drawn by the DC Motor is coming form the Generic Battery.
Directly we are getting State of charge of the battery by connecting the bus selector to the m terminal of the battery
the remaining charge is now converted into percentage value of the charging capacity of the battery.
vi)Reference Velocity (Drive Cycle) :
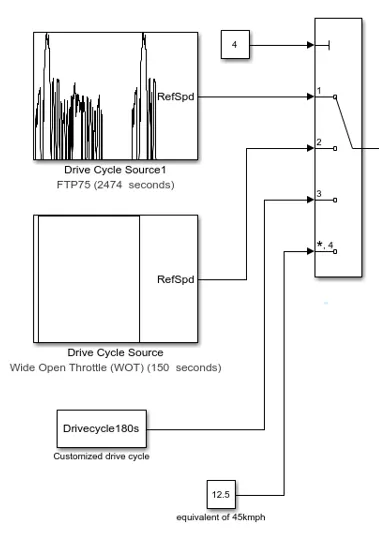
There are 4 differenrt reference velocity is considered and those are connected to multiport switch
By changing the values in first port we are getting pertidcular drive cycle
i)Drive cycle source1(FTP75(2474seconds):
The Drive Cycle Source block is used to provide the reference speed for the simulation.
It generates a standard or user-specified longitudinal drive cycle.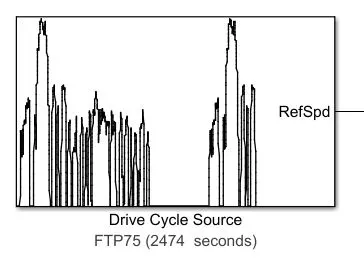
Here, the selected drive cycle is the standard FTP75. 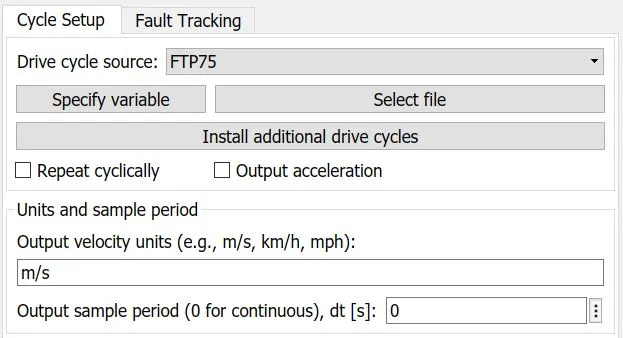
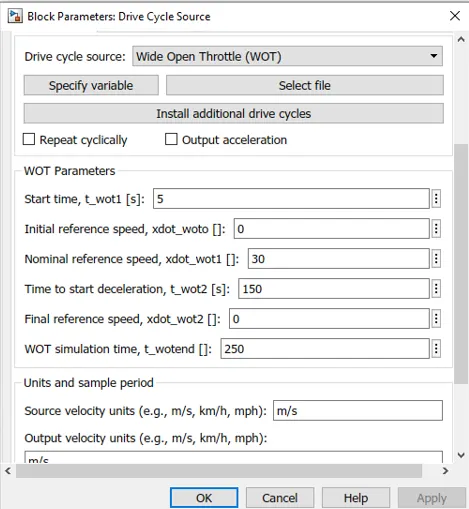
ii)Drive cycle source 2(WOT) for 250Seconds:
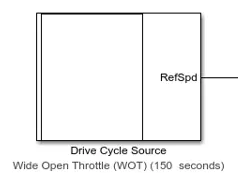
this drive cycle is used to check the max speed of the rekshaw
iii)Customized drive cycle for 180 seconds using the excel sheet:
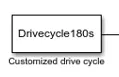
drive cycle :
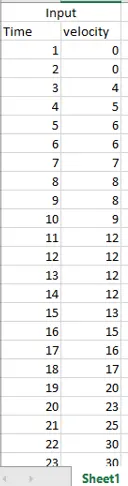
(the complete drive cycle is attached)
iv)45kmph speed for 100km:
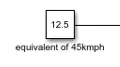
this is the constant 0f 12.5m/s which is equivalent to 45kmph to run the RIKHSAW for 100km to check the all performance like motor temparature,SOC,energy etc
Simulation :
- A Solver Configuration is added to ensure proper solving of the mathematical equations by the model.
- Scopes are connected to analyze different outputs such as the SOC of the battery, the reference velocity & the actual velocity of the vehicle and the distance covered by the vehicle during the total run.
- The 2 velocities are first converted from m/s to kmph values. For this, simple Gain blocks are used.
- The distance is calculated by simply time-integration of the vehicle velocity.
Results:
1.Drive cycle source1(FTP75(2474seconds):
ref speed vs actual speed:-
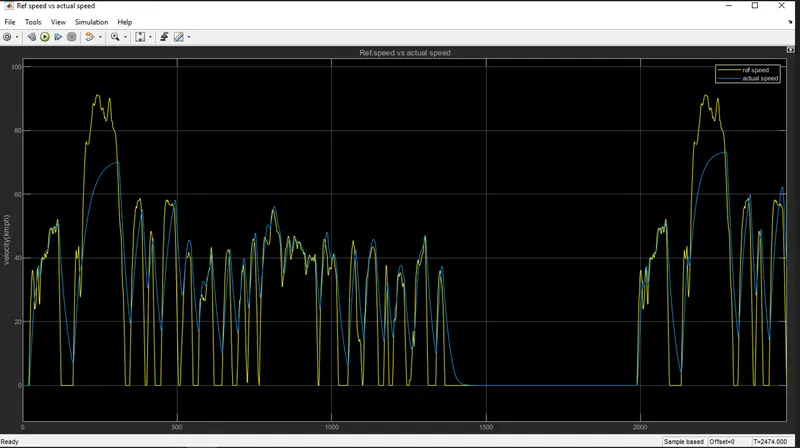
As we can see from the above picture, the actual velocity of the vehicle differs from the reference drive cycle velocity.
This is because, the chosen battery capacity and motors are not able to propel the speed upto the required extent.
If a battery of higher capacity is chosen, the actual velocity will tend to match with the reference velocity.
Also, it may be noted that in certain regions, despite the drive cycle showing small decelerations, the vehicle actually is accelerating with decreasing magnitudes. Reason being the same.
State of charge:-
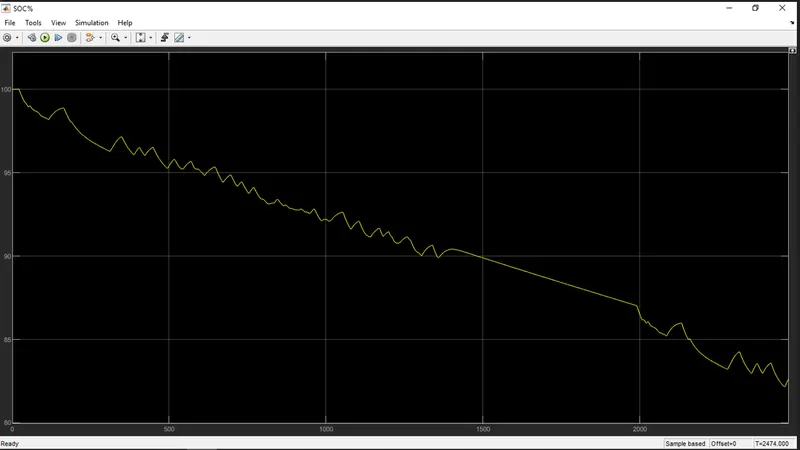
The State-of-Charge of the battery at the end of simulation run is nearly about 82 %.
This means that the battery is not completely drained at the end and the vehicle can run on the same drive cycle for a 5 more times before the battery SOC becomes 0.
Also, the thing to be noted here is, since we had enabled the regenerative braking for the simulation, the battery SOC increases slightly whenever the vehicle undergoes heavy deceleration.we can see the spikes which are emerging upwards
Again, this depends upon the generating tendency of the motor and the maximum amount of current that the battery can take.
Total distance travelled:
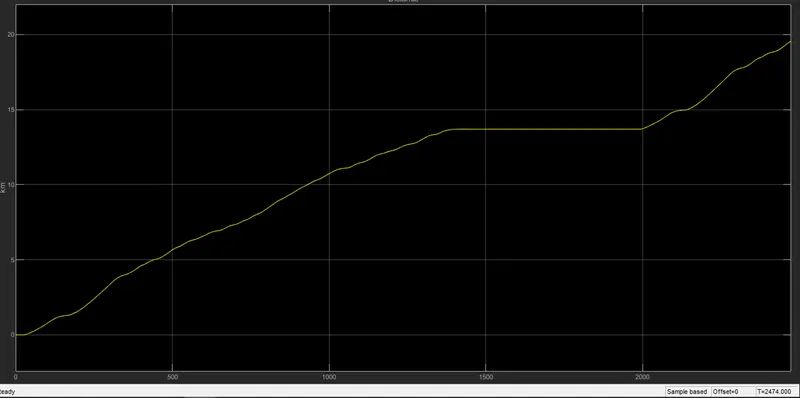
It may be noted that, since, the reference velocity of the drive cycle never becomes negative (i.e. there is no backward motion of the vehicle), the distance is increasing throughout.
The total distance covered by the vehicle is about 19.95km.
this value is according acual velocity using reference drive cycle and if the speed of the vehicle matches with refrence velocity effectively then distance also increases with respect to the time.
Energy consumption:
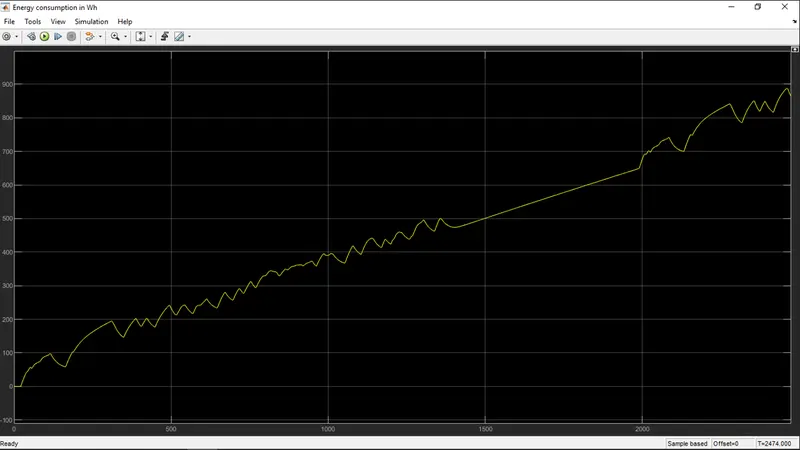
Here we can see that rikshaw consumed upto 900Wh energy
Temparature :
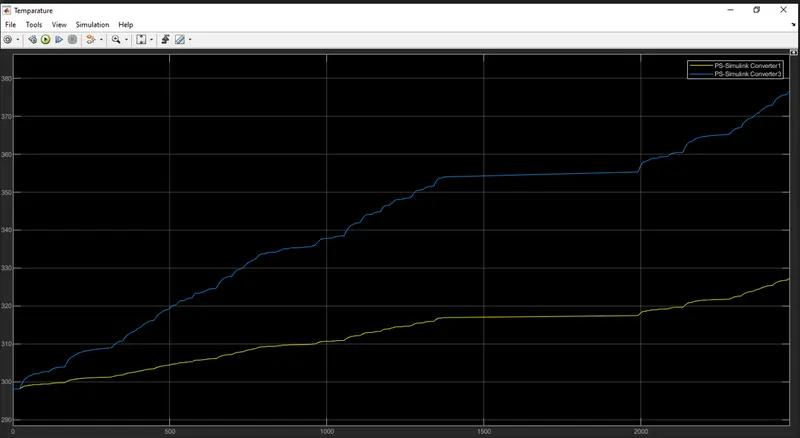
The motor(blue) temparature reaches upto 370K and H-bridge(yellow) reaches upto 328K
2.Drive cycle source 2(WOT) for 250Seconds:
ref speed vs acutal speed:
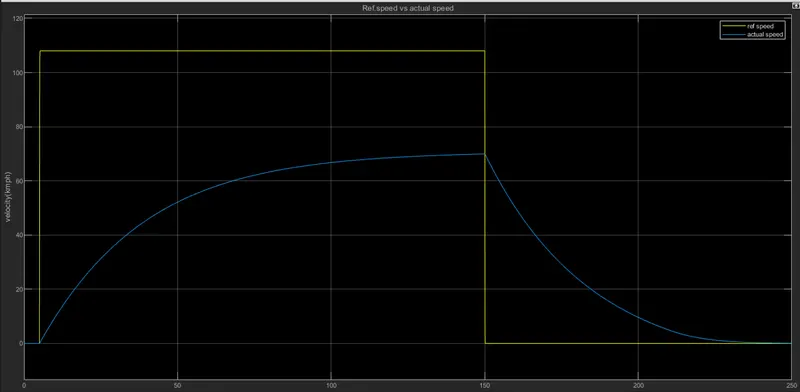
here we can see that max.speed it can reach 70kmph with full load condition
It will take almost 150s to reach its max.speed.
Angular speed in rad/sec:
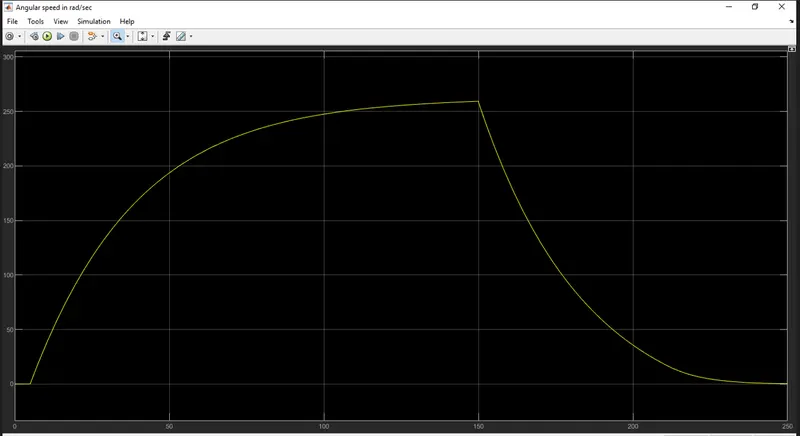
Max angular speed can be 260rad/sec
3.Customized drive cycle for 180 seconds using the excel sheet:
ref speed and actual speed:
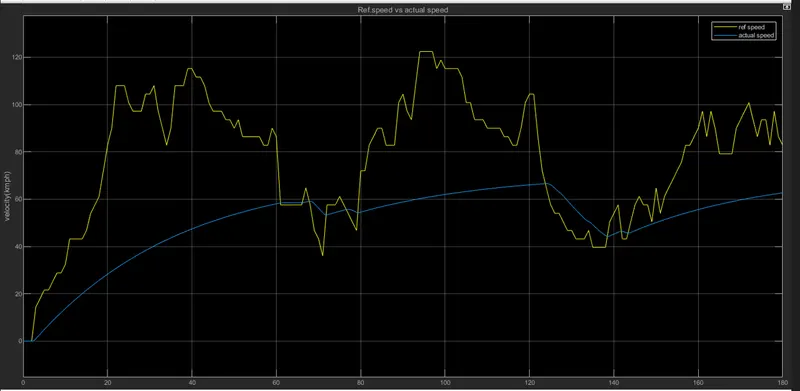
SOC(%):
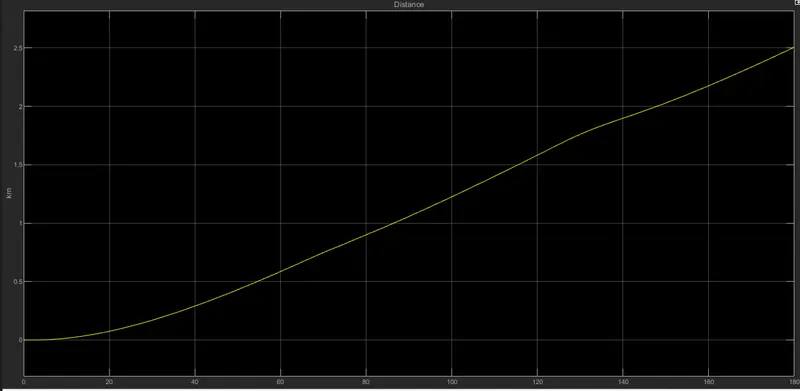
Distance travelled:
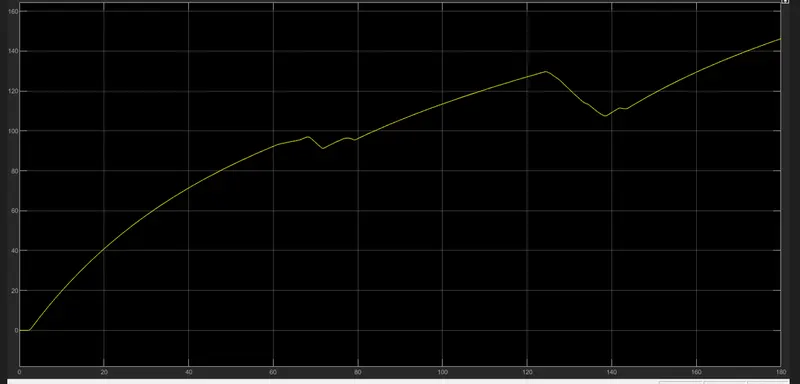
Energy consumption:
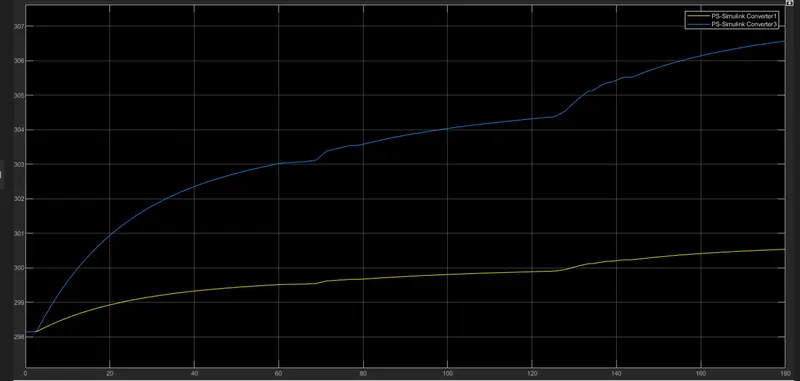
Temparature:
4.45kmph speed for 100km (8006 seconds):
ref speed and actual speed:
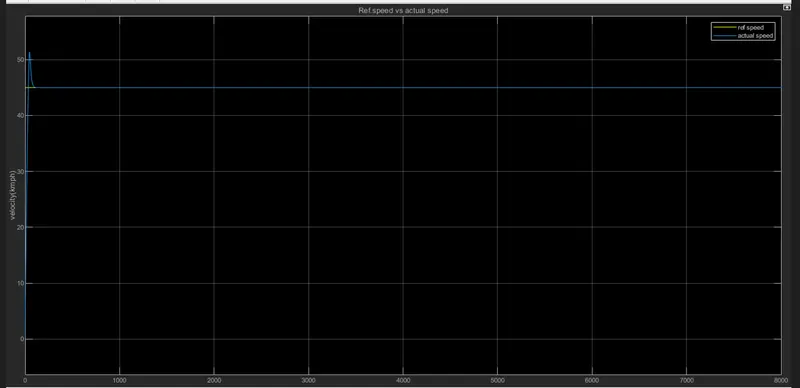
Ref speed is given as 45kmph(12.5m/s) and riksaw is tracking very effectively till 100km range
SOC(%):
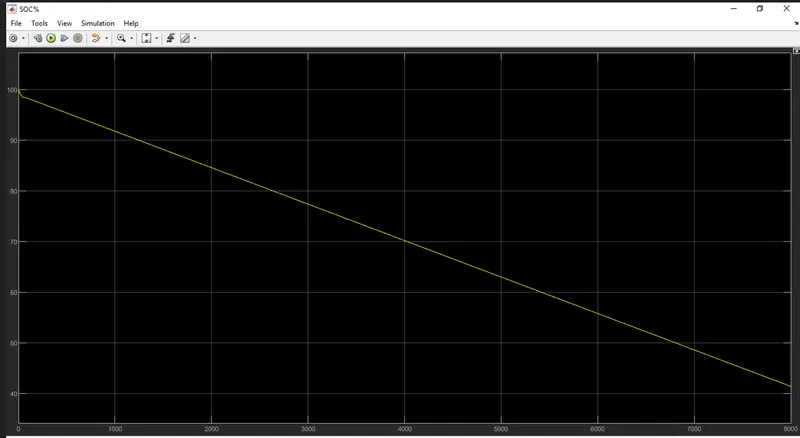
After reaching 100km with constant 45kmph speed the SOC becomes 42% and initially it was 100%
Energy consumption:
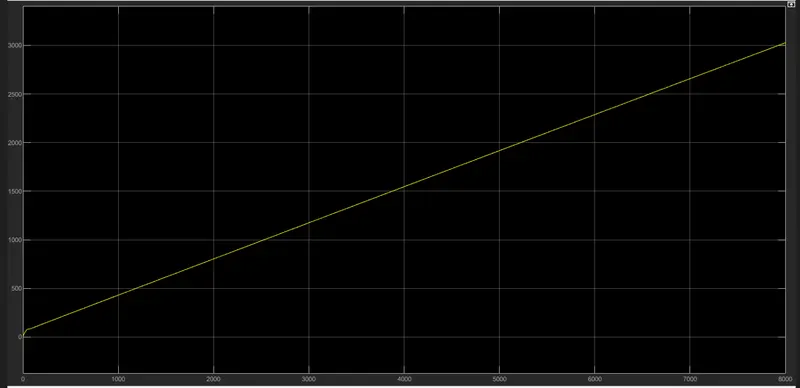
Total energy consumption by the vehicle is almost 3010Wh which is equivalent 62.7Ah
Temparature:
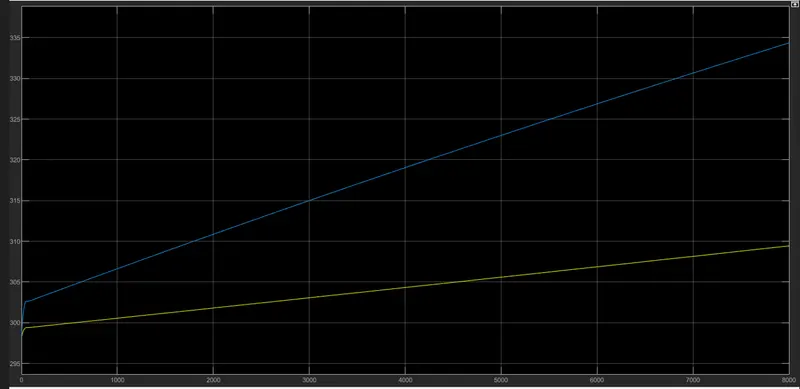
Motor Temparature is 334K and H-bridge temparature is 304K
Efficiency point of motor and motor controller:
The majority of DC motors have a maximum ambient temperature between 85⁰C and 100⁰C, and a maximum winding temperature between 100⁰C and 125⁰C.
 |
| Equation 1. Change in Winding Resistance |
 |
| Equation 2. Watts Lost Due to Winding Resistance |
The motor torque constant (KT) and voltage constant (KE) are directly related to the magnetic flux density (Br) of the permanent magnets. Depending on the physics of the magnet material used, overall flux density will change at a given percentage with an increase in magnet temperature. As the material temperature increases, atomic vibrations cause once-aligned magnetic moments to “randomize” resulting in a decrease in magnetic flux density. Assuming the motor is operating within its intended design window, the decrease in flux density is temporary and will begin to recover as the magnet cools. If the maximum temperature rating of the magnets is exceeded, however, partial demagnetization will occur and permanently alter the performance of the motor.
hence its efficiency decreases
So.in order to get best efficiency from the motor cooling is required.
Here I have compromised with the temperature of Motor and controller to achieve vehicle speed is near to reference speeds. Since I haven’t used any cooling system in the model. In the real time application, the motor temperature is less than 100 C.
In the real time application, the motor, battery & controller temperature is controlled by air cooling. Hence, the temperature of this components is not increased to this extent.
So to get better performance from motor and H -bridge controller we need to change thermal mass.
here we choosed 30000J/K to get better performance of the motor and motor controller.
Conclusion
- The MATLAB model of e-rickshaw is created by using Li-ion Battery 48V 100Ah and PM Brushed DC Motor.
- By changing the thermal mass of both the motor and motor controller Temparature across each motor and motor controller is observed
- Detremined the variations of Temperature of Motor and controller, SoC% and Energy consumed by the by vehicle for all the three Reference Drive cycles (i.e.; FTP75, WOT, Manually prepared).
- This Battery powered Rickshaw will be the most popular mode of transport in the future.